Risk Based Monitoring Software Market Size by End User (Pharma & Biopharmaceutical Co., Medical Device Co., CROs), Delivery Mode (Web Hosted, On-premise, Cloud-based), Type (Enterprise, Site), Component (Software, Services) - Global Forecast to 2025


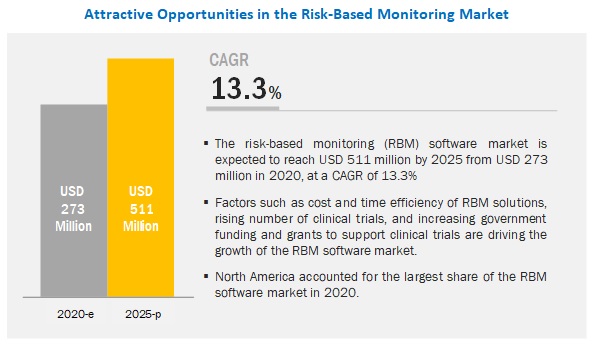
The size of global risk based monitoring software market in terms of revenue was estimated to be worth $273 million in 2020 and is poised to reach $511 million by 2025, growing at a CAGR of 13.3% from 2020 to 2025. The research study consists of an industry trend analysis, pricing analysis, patent analysis, conference and webinar materials, key stakeholders, and buying behaviour in the market.
Growth in this market can primarily be attributed to factors such as the cost and time efficiency of RBM solutions, rising number of clinical trials, and increasing government funding and grants to support clinical trials. However, the high implementation cost of RBM solutions is expected to restrain the growth of this market during the forecast period.
The software component segment is expected to command the largest share of the risk based monitoring software industry.
Based on the component, the risk based monitoring software market is segmented into Software and Services. In 2020, the software segment is expected to command the largest share of the RBM software market. The large share of this segment can be attributed to can be attributed to the increasing R&D expenditure in the life science and clinical research industries, an increasing number of clinical trials, and rising customer base
The Web-based (On-demand) delivery mode segment is expected to command the largest share of the risk based monitoring software industry.
Based on delivery mode, the risk based monitoring software market is segmented into Web-based (On-demand), Licensed Enterprise (On-premise), and Cloud-based (SaaS). In 2020, the Web-based (On-demand) segment is expected to command the largest share of the RBM software market. The large share of this segment can be attributed to the advantages offered by web-based software, such as easy access, improved productivity, time efficiency, and cost-efficiency.
The pharmaceutical and biopharmaceutical companies segment to hold the largest share of the risk based monitoring software industry.
Based on end user, the risk based monitoring software market is segmented into pharmaceutical and biopharmaceutical companies, CROs, medical device companies, and other end users. In 2020, the pharmaceutical and biopharmaceutical companies segment is expected to command the largest share of the RBM software market. The increasing R&D expenditure of pharmaceutical and biopharmaceutical companies is the major factor driving the growth of this end-user segment.
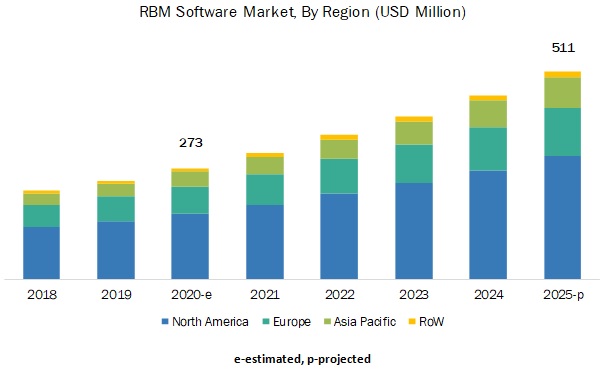
North America accounted for the largest share of the risk based monitoring software industry, while the Asia Pacific market is expected to register the highest growth during the forecast period
Geographically, the North American market is expected to account for the largest share of the global risk based monitoring software market. The Asia Pacific market is expected to grow at the highest CAGR in the forecast period. This growth can be attributed to increasing government funding to support clinical trials, the presence of less stringent regulatory guidelines as compared to developed nations, a large patient base, low operating costs for conducting clinical trials, shortage of trial volunteers in Europe and North America, and the growing number of pharmaceutical companies and CROs in the region
The key players operating in the global risk based monitoring software market are Oracle (US), Medidata Solutions (US), and Parexel (US). Other prominent players in the market are Bioclinica (US), Bio-Optronics (US), IBM Corporation (US), DATATRAK (US), Veeva Systems (US), DSG (US), MasterControl (US), ERT (US), Forte Research Systems (US), MedNet Solutions (US), ArisGlobal (US), Anju Software (US), MaxisIT (US), Techsol Corporation (US), OpenClinica (US), CRF Health (US), and Covance (US).
Scope of the Risk Based Monitoring Software Industry:
|
Report Metric |
Details |
|
Market Revenue Size in 2020 |
$273 million |
|
Projected Revenue Size by 2025 |
$511 million |
|
Industry Growth Rate |
Poised to grow at a CAGR of 13.3% |
|
Market Driver |
Cost & time efficiency of RBM solutions |
|
Market Opportunity |
Increasing outsourcing of clinical trial processes to CROs |
This research report categorizes the risk based monitoring software market to forecast revenue and analyze trends in each of the following submarkets:
By Type
- Enterprise RBM Software
- Site RBM Software
By Component
- Software
- Services
By Delivery Mode
- Web-based (On-demand)
- Licensed Enterprise (On-premise)
- Cloud-based (SaaS)
By End User
- Pharmaceutical & Biopharmaceutical Companies
- CROs
- Medical Device Companies
- Other End Users
By Region
-
North America
- US
- Canada
-
Europe
- Germany
- UK
- France
- RoE
-
Asia Pacific
- China
- Japan
- India
- RoAPAC
- RoW
Recent Developments of Risk based Monitoring Software Industry:
- In 2018, Bioclinica (US) launched the SMART technology suite available with Medical Imaging, Electronic Data Capture (EDC), and Interactive Response Technology (IRT) combined.
- In 2019, Veeva Systems (US), acquired Crossix Solutions (US), a provider of privacy-safe US patient data and best-in-class analytics platform to help maximize media and marketing effectiveness.
- In 2019, Parexel International Corporation (US), partnered with Datavant (US) to enable the connection of real-world data across all clinical trials conducted by Parexel.
Frequently Asked Questions (FAQ):
What is the projected market revenue value of the global risk based monitoring software market?
The global risk based monitoring software market boasts a total revenue value of $511 million by 2025.
What is the estimated growth rate (CAGR) of the global risk based monitoring software market?
The global risk based monitoring software market has an estimated compound annual growth rate (CAGR) of 13.3% and a revenue size in the region of $273 million in 2020.
To speak to our analyst for a discussion on the above findings, click Speak to Analyst
 Exclusive indicates content/data unique to MarketsandMarkets and not available with any competitors.
TABLE OF CONTENTS
1 INTRODUCTION (Page No. - 17)
1.1 OBJECTIVES OF THE STUDY
1.2 MARKET DEFINITION
1.2.1 MARKET SCOPE
1.2.2 MARKETS COVERED
1.2.3 YEARS CONSIDERED FOR THE STUDY
1.3 CURRENCY
1.4 LIMITATIONS
1.5 STAKEHOLDERS
2 RESEARCH METHODOLOGY (Page No. - 20)
2.1 RESEARCH DATA
2.1.1 SECONDARY DATA
2.1.1.1 Secondary sources
2.1.2 PRIMARY DATA
2.1.2.1 Primary sources
2.1.3 MARKET SIZE ESTIMATION METHODOLOGY
2.1.4 REVENUE MAPPING-BASED MARKET ESTIMATION (APPROACH 1)
2.1.5 MARKET ESTIMATION USING PARENT MARKET SIZE (APPROACH 2)
2.2 MARKET DATA ESTIMATION AND TRIANGULATION
2.3 ASSUMPTIONS OF THE STUDY
3 EXECUTIVE SUMMARY (Page No. - 30)
4 PREMIUM INSIGHTS (Page No. - 34)
4.1 RISK-BASED MONITORING SOFTWARE: MARKET OVERVIEW
4.2 MARKET SHARE, BY TYPE, 2020 VS. 2025
4.3 RISK-BASED MONITORING SOFTWARE MARKET SHARE, BY COMPONENT, 2020 VS. 2025
4.4 GLOBAL MARKET: GEOGRAPHIC GROWTH OPPORTUNITIES
5 MARKET OVERVIEW (Page No. - 36)
5.1 INTRODUCTION
5.2 MARKET DYNAMICS
5.2.1 DRIVERS
5.2.1.1 Cost and time efficiency of RBM solutions
5.2.1.2 Rising number of clinical trials
5.2.1.3 Increasing government funding and grants to support clinical trials
5.2.2 RESTRAINTS
5.2.2.1 High implementation costs
5.2.3 OPPORTUNITIES
5.2.3.1 Increased outsourcing of clinical trial processes to CROs
5.2.4 CHALLENGES
5.2.4.1 Dearth of skilled professionals for operating RBM solutions
6 RISK BASED MONITORING SOFTWARE MARKET, BY TYPE (Page No. - 40)
6.1 INTRODUCTION
6.2 ENTERPRISE RBM SOFTWARE
6.2.1 ENTERPRISE RBM SOFTWARE DOMINATES THE RBM SOFTWARE MARKET
6.3 SITE RBM SOFTWARE
6.3.1 SITE RBM SOFTWARE OFFERS IMPROVED TRIAL MANAGEMENT
7 RISK BASED MONITORING SOFTWARE MARKET, BY COMPONENT (Page No. - 45)
7.1 INTRODUCTION
7.2 SOFTWARE
7.2.1 GROWING ADOPTION OF CLINICAL TRIAL MANAGEMENT SOLUTIONS TO SUPPORT MARKET GROWTH
7.3 SERVICES
7.3.1 NEED FOR CONTINUOUS UPGRADE OF RBM SOFTWARE PRODUCTS HAS INCREASED THE DEMAND FOR SERVICES
8 RISK BASED MONITORING SOFTWARE MARKET, BY DELIVERY MODE (Page No. - 50)
8.1 INTRODUCTION
8.2 WEB-BASED (ON-DEMAND)
8.2.1 ADVANTAGES SUCH AS EASY ACCESS & REDUCTION IN COSTS TO SUPPORT MARKET GROWTH
8.3 LICENSED ENTERPRISE (ON-PREMISE)
8.3.1 ON-PREMISE MODELS MINIMIZE RISKS ASSOCIATED WITH DATA BREACHES AND EXTERNAL ATTACKS
8.4 CLOUD-BASED (SAAS)
8.4.1 INCREASING ADOPTION OF CLOUD-BASED SOLUTIONS TO DRIVE MARKET GROWTH
9 RISK BASED MONITORING SOFTWARE MARKET, BY END USER (Page No. - 57)
9.1 INTRODUCTION
9.2 PHARMACEUTICAL & BIOPHARMACEUTICAL COMPANIES
9.2.1 INCREASED PHARMACEUTICAL R&D SPENDING TO DRIVE MARKET GROWTH
9.3 CONTRACT RESEARCH ORGANIZATIONS (CROS)
9.3.1 INCREASING OUTSOURCING OF CLINICAL RESEARCH ACTIVITIES BY PHARMACEUTICAL, BIOTECHNOLOGY, AND MEDICAL DEVICE COMPANIES TO DRIVE MARKET GROWTH
9.4 MEDICAL DEVICE COMPANIES
9.4.1 GOVERNMENT FUNDING TO SUPPORT MARKET GROWTH
9.5 OTHER END USERS
10 RISK BASED MONITORING SOFTWARE MARKET, BY REGION (Page No. - 66)
10.1 INTRODUCTION
10.2 NORTH AMERICA
10.2.1 US
10.2.1.1 The US holds the largest share of the North American market
10.2.2 CANADA
10.2.2.1 Government funding to boost market growth
10.3 EUROPE
10.3.1 GERMANY
10.3.1.1 Initiatives to boost digital health to propel market growth
10.3.2 UK
10.3.2.1 Favorable R&D scenario in the country to boost the adoption of RBM software
10.3.3 FRANCE
10.3.3.1 Lack of sufficient funding to restrain market growth in France
10.3.4 ROE
10.4 APAC
10.4.1 CHINA
10.4.1.1 Increased pharmaceutical R&D spending to drive market growth
10.4.2 JAPAN
10.4.2.1 Stringent regulatory scenario in Japan to restrain market growth
10.4.3 INDIA
10.4.3.1 Favorable pharmaceutical R&D scenario to drive the adoption of RBM software
10.4.4 REST OF ASIA PACIFIC
10.5 REST OF THE WORLD
11 COMPETITIVE LANDSCAPE (Page No. - 96)
11.1 OVERVIEW
11.2 MARKET SHARE ANALYSIS
11.3 COMPETITIVE LEADERSHIP MAPPING
11.3.1 VISIONARY LEADERS
11.3.2 INNOVATORS
11.3.3 DYNAMIC DIFFERENTIATORS
11.3.4 EMERGING COMPANIES
11.4 COMPETITIVE SCENARIO
11.4.1 PRODUCT LAUNCHES & ENHANCEMENTS
11.4.2 FUNDING
11.4.3 ACQUISITIONS
11.4.4 PARTNERSHIPS
11.4.5 COLLABORATIONS
12 COMPANY PROFILES (Page No. - 103)
12.1 ORACLE
12.2 MEDIDATA SOLUTIONS
12.3 PAREXEL (ACQUIRED BY PAMPLONA CAPITAL MANAGEMENT)
12.4 BIOCLINICA
12.5 BIO-OPTRONICS
12.6 IBM
12.7 DATATRAK
12.8 VEEVA SYSTEMS
12.9 DSG
12.10 MASTERCONTROL
12.11 ERT
12.12 FORTE RESEARCH SYSTEMS
12.13 MEDNET SOLUTIONS
12.14 ARISGLOBAL
12.15 ANJU SOFTWARE
12.16 AXISIT
12.17 TECHSOL CORPORATION
12.18 OPENCLINICA
12.19 CRF HEALTH
12.20 COVANCE INC.
13 APPENDIX (Page No. - 131)
13.1 DISCUSSION GUIDE
13.2 KNOWLEDGE STORE: MARKETSANDMARKETS’ SUBSCRIPTION PORTAL
13.3 AVAILABLE CUSTOMIZATIONS
13.4 RELATED REPORTS
13.5 AUTHOR DETAILS
LIST OF TABLES (114 Tables)
TABLE 1 NUMBER OF REGISTERED CLINICAL TRIAL STUDIES GLOBALLY, 2002–2019
TABLE 2 RISK BASED MONITORING SOFTWARE MARKET, BY TYPE, 2018–2025 (USD MILLION)
TABLE 3 ENTERPRISE RBM SOFTWARE MARKET, BY REGION, 2018–2025 (USD MILLION)
TABLE 4 NORTH AMERICA: ENTERPRISE RBM SOFTWARE MARKET, BY COUNTRY, 2018–2025 (USD MILLION)
TABLE 5 EUROPE: ENTERPRISE RBM SOFTWARE MARKET, BY COUNTRY, 2018–2025 (USD MILLION)
TABLE 6 ASIA PACIFIC: ENTERPRISE RBM SOFTWARE MARKET, BY COUNTRY, 2018–2025 (USD MILLION)
TABLE 7 SITE RBM SOFTWARE MARKET, BY REGION, 2018–2025 (USD MILLION)
TABLE 8 NORTH AMERICA: SITE RBM SOFTWARE MARKET, BY COUNTRY, 2018–2025 (USD MILLION)
TABLE 9 EUROPE: SITE RBM SOFTWARE MARKET, BY COUNTRY, 2018–2025 (USD MILLION)
TABLE 10 ASIA PACIFIC: SITE RBM SOFTWARE MARKET, BY COUNTRY, 2018–2025 (USD MILLION)
TABLE 11 RISK-BASED MONITORING SOFTWARE MARKET, BY COMPONENT, 2018–2025 (USD MILLION)
TABLE 12 GLOBAL MARKET FOR SOFTWARE, BY REGION, 2018–2025 (USD MILLION)
TABLE 13 NORTH AMERICA: MARKET FOR SOFTWARE, BY COUNTRY, 2018–2025 (USD MILLION)
TABLE 14 EUROPE: MARKET FOR SOFTWARE, BY COUNTRY, 2018–2025 (USD MILLION)
TABLE 15 ASIA PACIFIC: MARKET FOR SOFTWARE, BY COUNTRY, 2018–2025 (USD MILLION)
TABLE 16 RISK-BASED MONITORING SOFTWARE MARKET FOR SERVICES, BY REGION, 2018–2025 (USD MILLION)
TABLE 17 NORTH AMERICA: MARKET FOR SERVICES, BY COUNTRY, 2018–2025 (USD MILLION)
TABLE 18 EUROPE: MARKET FOR SERVICES, BY COUNTRY, 2018–2025 (USD MILLION)
TABLE 19 ASIA PACIFIC: MARKET FOR SERVICES, BY COUNTRY, 2018–2025 (USD MILLION)
TABLE 20 GLOBAL MARKET, BY DELIVERY MODE, 2018–2025 (USD MILLION)
TABLE 21 RISK-BASED MONITORING SOFTWARE MARKET FOR WEB-BASED DELIVERY, BY REGION, 2018–2025 (USD MILLION)
TABLE 22 NORTH AMERICA: MARKET FOR WEB-BASED DELIVERY, BY COUNTRY, 2018–2025 (USD MILLION)
TABLE 23 EUROPE: MARKET FOR WEB-BASED DELIVERY, BY COUNTRY, 2018–2025 (USD MILLION)
TABLE 24 ASIA PACIFIC: MARKET FOR WEB-BASED DELIVERY, BY COUNTRY, 2018–2025 (USD MILLION)
TABLE 25 RISK-BASED MONITORING SOFTWARE MARKET FOR LICENSED ENTERPRISE DELIVERY, BY REGION, 2018–2025 (USD MILLION)
TABLE 26 NORTH AMERICA: MARKET FOR LICENSED ENTERPRISE DELIVERY, BY COUNTRY, 2018–2025 (USD MILLION)
TABLE 27 EUROPE: MARKET FOR LICENSED ENTERPRISE DELIVERY, BY COUNTRY, 2018–2025 (USD MILLION)
TABLE 28 ASIA PACIFIC: MARKET FOR LICENSED ENTERPRISE DELIVERY, BY COUNTRY, 2018–2025 (USD MILLION)
TABLE 29 GLOBAL MARKET FOR CLOUD-BASED DELIVERY, BY REGION, 2018–2025 (USD MILLION)
TABLE 30 NORTH AMERICA: MARKET FOR CLOUD-BASED DELIVERY, BY COUNTRY, 2018–2025 (USD MILLION)
TABLE 31 EUROPE: MARKET FOR CLOUD-BASED DELIVERY, BY COUNTRY, 2018–2025 (USD MILLION)
TABLE 32 ASIA PACIFIC: MARKET FOR CLOUD-BASED DELIVERY, BY COUNTRY, 2018–2025 (USD MILLION)
TABLE 33 GLOBAL MARKET, BY END USER, 2018–2025 (USD MILLION)
TABLE 34 RISK-BASED MONITORING SOFTWARE MARKET FOR PHARMACEUTICAL & BIOPHARMACEUTICAL COMPANIES, BY REGION, 2018–2025 (USD MILLION)
TABLE 35 NORTH AMERICA: MARKET FOR PHARMACEUTICAL & BIOPHARMACEUTICAL COMPANIES, BY COUNTRY, 2018–2025 (USD MILLION)
TABLE 36 EUROPE: MARKET FOR PHARMACEUTICAL & BIOPHARMACEUTICAL COMPANIES, BY COUNTRY, 2018–2025 (USD MILLION)
TABLE 37 ASIA PACIFIC: MARKET FOR PHARMACEUTICAL & BIOPHARMACEUTICAL COMPANIES, BY COUNTRY, 2018–2025 (USD MILLION)
TABLE 38 GLOBAL MARKET FOR CONTRACT RESEARCH ORGANIZATIONS, BY REGION, 2018–2025 (USD MILLION)
TABLE 39 NORTH AMERICA: MARKET FOR CONTRACT RESEARCH ORGANIZATIONS, BY COUNTRY, 2018–2025 (USD MILLION)
TABLE 40 EUROPE: MARKET FOR CONTRACT RESEARCH ORGANIZATIONS, BY COUNTRY, 2018–2025 (USD MILLION)
TABLE 41 ASIA PACIFIC: MARKET FOR CONTRACT RESEARCH ORGANIZATIONS, BY COUNTRY, 2018–2025 (USD MILLION)
TABLE 42 RISK-BASED MONITORING SOFTWARE MARKET FOR MEDICAL DEVICE COMPANIES, BY REGION, 2018–2025 (USD MILLION)
TABLE 43 NORTH AMERICA: MARKET FOR MEDICAL DEVICE COMPANIES, BY COUNTRY, 2018–2025 (USD MILLION)
TABLE 44 EUROPE: MARKET FOR MEDICAL DEVICE COMPANIES, BY COUNTRY, 2018–2025 (USD MILLION)
TABLE 45 ASIA PACIFIC: MARKET FOR MEDICAL DEVICE COMPANIES, BY COUNTRY, 2018–2025 (USD MILLION)
TABLE 46 GLOBAL MARKET FOR OTHER END USERS, BY REGION, 2018–2025 (USD MILLION)
TABLE 47 NORTH AMERICA: MARKET FOR OTHER END USERS, BY COUNTRY, 2018–2025 (USD MILLION)
TABLE 48 EUROPE: MARKET FOR OTHER END USERS, BY COUNTRY, 2018–2025 (USD MILLION)
TABLE 49 ASIA PACIFIC: MARKET FOR OTHER END USERS, BY COUNTRY, 2018–2025 (USD MILLION)
TABLE 50 GLOBAL MARKET, BY REGION, 2018–2025 (USD MILLION)
TABLE 51 NORTH AMERICA: RISK BASED MONITORING SOFTWARE MARKET, BY COUNTRY, 2018–2025 (USD MILLION)
TABLE 52 NORTH AMERICA: RISK-BASED MONITORING SOFTWARE MARKET, BY TYPE, 2018–2025 (USD MILLION)
TABLE 53 NORTH AMERICA: MARKET, BY COMPONENT, 2018–2025 (USD MILLION)
TABLE 54 NORTH AMERICA: MARKET, BY DELIVERY MODE, 2018–2025 (USD MILLION)
TABLE 55 NORTH AMERICA: MARKET, BY END USER, 2018–2025 (USD MILLION)
TABLE 56 US: RISK-BASED MONITORING SOFTWARE MARKET, BY TYPE, 2018–2025 (USD MILLION)
TABLE 57 US: MARKET, BY COMPONENT, 2018–2025 (USD MILLION)
TABLE 58 US: MARKET, BY DELIVERY MODE, 2018–2025 (USD MILLION)
TABLE 59 US: MARKET, BY END USER, 2018–2025 (USD MILLION)
TABLE 60 CANADA: MARKET, BY TYPE, 2018–2025 (USD MILLION)
TABLE 61 CANADA: RISK-BASED MONITORING SOFTWARE MARKET, BY COMPONENT, 2018–2025 (USD MILLION)
TABLE 62 CANADA: MARKET, BY DELIVERY MODE, 2018–2025 (USD MILLION)
TABLE 63 CANADA: MARKET, BY END USER, 2018–2025 (USD MILLION)
TABLE 64 EUROPE: RISK-BASED MONITORING SOFTWARE MARKET, BY COUNTRY, 2018–2025 (USD MILLION)
TABLE 65 EUROPE: MARKET, BY TYPE, 2018–2025 (USD MILLION)
TABLE 66 EUROPE: MARKET, BY COMPONENT, 2018–2025 (USD MILLION)
TABLE 67 EUROPE: MARKET, BY DELIVERY MODE, 2018–2025 (USD MILLION)
TABLE 68 EUROPE: MARKET, BY END USER, 2018–2025 (USD MILLION)
TABLE 69 GERMANY: RISK BASED MONITORING SOFTWARE MARKET, BY TYPE, 2018–2025 (USD MILLION)
TABLE 70 GERMANY: RISK-BASED MONITORING SOFTWARE MARKET, BY COMPONENT, 2018–2025 (USD MILLION)
TABLE 71 GERMANY: MARKET, BY DELIVERY MODE, 2018–2025 (USD MILLION)
TABLE 72 GERMANY: MARKET, BY END USER, 2018–2025 (USD MILLION)
TABLE 73 UK: RISK-BASED MONITORING SOFTWARE MARKET, BY TYPE, 2018–2025 (USD MILLION)
TABLE 74 UK: MARKET, BY COMPONENT, 2018–2025 (USD MILLION)
TABLE 75 UK: MARKET, BY DELIVERY MODE, 2018–2025 (USD MILLION)
TABLE 76 UK: MARKET, BY END USER, 2018–2025 (USD MILLION)
TABLE 77 FRANCE: MARKET, BY TYPE, 2018–2025 (USD MILLION)
TABLE 78 FRANCE: RISK-BASED MONITORING SOFTWARE MARKET, BY COMPONENT, 2018–2025 (USD MILLION)
TABLE 79 FRANCE: MARKET, BY DELIVERY MODE, 2018–2025 (USD MILLION)
TABLE 80 FRANCE: MARKET, BY END USER, 2018–2025 (USD MILLION)
TABLE 81 ROE: RISK-BASED MONITORING SOFTWARE MARKET, BY TYPE, 2018–2025 (USD MILLION)
TABLE 82 ROE: MARKET, BY COMPONENT, 2018–2025 (USD MILLION)
TABLE 83 ROE: MARKET, BY DELIVERY MODE, 2018–2025 (USD MILLION)
TABLE 84 ROE: MARKET, BY END USER, 2018–2025 (USD MILLION)
TABLE 85 ASIA PACIFIC: RISK BASED MONITORING SOFTWARE MARKET, BY COUNTRY, 2018–2025 (USD MILLION)
TABLE 86 ASIA PACIFIC: RISK-BASED MONITORING SOFTWARE MARKET, BY TYPE, 2018–2025 (USD MILLION)
TABLE 87 ASIA PACIFIC: MARKET, BY COMPONENT, 2018–2025 (USD MILLION)
TABLE 88 ASIA PACIFIC: MARKET, BY DELIVERY MODE, 2018–2025 (USD MILLION)
TABLE 89 ASIA PACIFIC: MARKET, BY END USER, 2018–2025 (USD MILLION)
TABLE 90 CHINA: RISK-BASED MONITORING SOFTWARE MARKET, BY TYPE, 2018–2025 (USD MILLION)
TABLE 91 CHINA: MARKET, BY COMPONENT, 2018–2025 (USD MILLION)
TABLE 92 CHINA: MARKET, BY DELIVERY MODE, 2018–2025 (USD MILLION)
TABLE 93 CHINA: MARKET, BY END USER, 2018–2025 (USD MILLION)
TABLE 94 JAPAN: MARKET, BY TYPE, 2018–2025 (USD MILLION)
TABLE 95 JAPAN: RISK-BASED MONITORING SOFTWARE MARKET, BY COMPONENT, 2018–2025 (USD MILLION)
TABLE 96 JAPAN: MARKET, BY DELIVERY MODE, 2018–2025 (USD MILLION)
TABLE 97 JAPAN: MARKET, BY END USER, 2018–2025 (USD MILLION)
TABLE 98 INDIA: RISK-BASED MONITORING SOFTWARE MARKET, BY TYPE, 2018–2025 (USD MILLION)
TABLE 99 INDIA: MARKET, BY COMPONENT, 2018–2025 (USD MILLION)
TABLE 100 INDIA: MARKET, BY DELIVERY MODE, 2018–2025 (USD MILLION)
TABLE 101 INDIA: MARKET, BY END USER, 2018–2025 (USD MILLION)
TABLE 102 ROAPAC: RISK BASED MONITORING SOFTWARE MARKET, BY TYPE, 2018–2025 (USD MILLION)
TABLE 103 ROAPAC: MARKET, BY COMPONENT, 2018–2025 (USD MILLION)
TABLE 104 ROAPAC: MARKET, BY DELIVERY MODE, 2018–2025 (USD MILLION)
TABLE 105 ROAPAC: MARKET, BY END USER, 2018–2025 (USD MILLION)
TABLE 106 ROW: MARKET, BY TYPE, 2018–2025 (USD MILLION)
TABLE 107 ROW: MARKET, BY COMPONENT, 2018–2025 (USD MILLION)
TABLE 108 ROW: MARKET, BY DELIVERY MODE, 2018–2025 (USD MILLION)
TABLE 109 ROW: MARKET, BY END USER, 2018–2025 (USD MILLION)
TABLE 110 KEY PRODUCT LAUNCHES & ENHANCEMENTS
TABLE 111 KEY FUNDING
TABLE 112 KEY ACQUISITIONS
TABLE 113 KEY PARTNERSHIPS
TABLE 114 KEY COLLABORATIONS
LIST OF FIGURES (30 Figures)
FIGURE 1 RESEARCH DESIGN
FIGURE 2 BREAKDOWN OF PRIMARY INTERVIEWS: BY COMPANY TYPE, DESIGNATION, AND REGION
FIGURE 3 RESEARCH METHODOLOGY: HYPOTHESIS BUILDING
FIGURE 4 MARKET SIZE ESTIMATION: REVENUE SHARE ANALYSIS (1/2)
FIGURE 5 MARKET SIZE ESTIMATION: REVENUE SHARE ANALYSIS (2/2)
FIGURE 6 MARKET SIZE ESTIMATION BASED ON PARENT MARKET SIZE (APPROACH 2)
FIGURE 7 DATA TRIANGULATION METHODOLOGY
FIGURE 8 RISK BASED MONITORING SOFTWARE MARKET, BY TYPE, 2020 VS. 2025 (USD MILLION)
FIGURE 9 RISK-BASED MONITORING SOFTWARE MARKET, BY COMPONENT, 2020 VS. 2025 (USD MILLION)
FIGURE 10 GLOBAL MARKET, BY DELIVERY MODE, 2020 VS. 2025 (USD MILLION)
FIGURE 11 GLOBAL MARKET, BY END USER, 2020 VS. 2025 (USD MILLION)
FIGURE 12 GEOGRAPHICAL SNAPSHOT OF THE GLOBAL MARKET
FIGURE 13 RISING NUMBER OF CLINICAL TRIALS TO DRIVE MARKET GROWTH
FIGURE 14 ENTERPRISE RBM SOFTWARE SEGMENT WILL CONTINUE TO DOMINATE THE RBM SOFTWARE MARKET IN 2025
FIGURE 15 SOFTWARE SEGMENT ACCOUNTED FOR THE LARGEST MARKET SHARE IN 2019
FIGURE 16 ASIA PACIFIC TO REGISTER THE HIGHEST GROWTH IN THE RBM SOFTWARE MARKET DURING THE FORECAST PERIOD
FIGURE 17 RISK BASED MONITORING SOFTWARE MARKET: DRIVERS, RESTRAINTS, OPPORTUNITIES, & CHALLENGES
FIGURE 18 NORTH AMERICA: MARKET SNAPSHOT
FIGURE 19 EUROPE: MARKET SNAPSHOT
FIGURE 20 APAC: MARKET SNAPSHOT
FIGURE 21 ROW: MARKET SNAPSHOT
FIGURE 22 KEY DEVELOPMENTS IN THE RISK-BASED MONITORING SOFTWARE MARKET
FIGURE 23 MARKET SHARE ANALYSIS (2018)
FIGURE 24 MARKET (GLOBAL): COMPETITIVE LEADERSHIP MAPPING, 2018
FIGURE 25 ORACLE: COMPANY SNAPSHOT (2018)
FIGURE 26 MEDIDATA SOLUTIONS: COMPANY SNAPSHOT (2018)
FIGURE 27 PAREXEL: COMPANY SNAPSHOT (2016)
FIGURE 28 IBM: COMPANY SNAPSHOT (2018)
FIGURE 29 DATATRAK: COMPANY SNAPSHOT (2018)
FIGURE 30 VEEVA SYSTEMS: COMPANY SNAPSHOT (2018)
The study involved four major activities in estimating the current size for the risk based monitoring software market. Exhaustive secondary research was done to collect information on the market and its different subsegments. The next step was to validate these findings, assumptions, and sizing with industry experts across the value chain through primary research. Both top-down and bottom-up approaches were employed to estimate the complete market size. After that, market breakdown and data triangulation were used to estimate the market size of segments and subsegments.
Secondary Research
In the secondary research process, various secondary sources such as D&B Hoovers, Bloomberg Business, and Factiva have been referred to, to identify and collect information for the RBM software market study. These secondary sources included annual reports, press releases & investor presentations of companies, white papers, certified publications, articles by recognized authors, gold standard & silver standard websites, regulatory bodies, and databases.
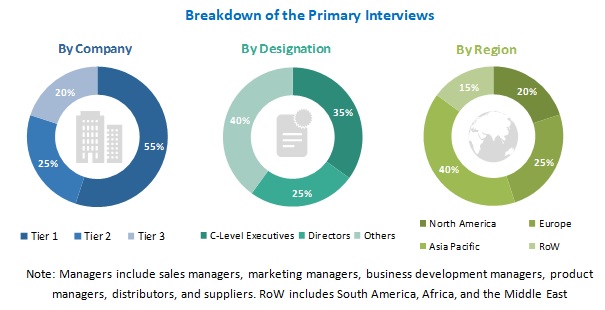
Primary Research
The RBM software market comprises several stakeholders such as RBM software vendors, healthcare institutions (hospitals, medical schools, group practices, individual surgeons, and governing bodies), medical device vendors/service providers, research institutes, and research and consulting firms. Various primary sources from both the supply and demand sides of the market were interviewed to obtain qualitative and quantitative information. Mentioned below is the breakdown of primary respondents:
To know about the assumptions considered for the study, download the pdf brochure
Market Size Estimation
Both top-down and bottom-up approaches were used to estimate and validate the total size of the RBM software market. These methods were also used extensively to estimate the size of various subsegments in the market. The research methodology used to estimate the market size includes the following:
- The key players in the industry and markets have been identified through extensive secondary research
- The industry’s supply chain and market size, in terms of value, have been determined through primary and secondary research processes
- All percentage shares, splits, and breakdowns have been determined using secondary sources and verified through primary sources
Data Triangulation
After arriving at the overall RBM software market size—using the market size estimation processes as explained above—the market was split into several segments and subsegments. To complete the overall market engineering process and to arrive at the exact statistics of each market segment and subsegment, the data triangulation and market breakdown procedures were employed, wherever applicable. The data was triangulated by studying various factors and trends from both the demand and supply sides in the RBM software industry
Report Objectives
- To define, describe, and forecast the RBM software market based on type, component, delivery mode, end-user, and region
- To provide detailed information regarding the major factors influencing the growth of this market (such as drivers, restraints, opportunities, and challenges)
- To analyze the micromarkets1 with respect to individual growth trends, prospects, and contributions to the overall RBM software market
- To analyze the opportunities for stakeholders and provide details of the competitive landscape for market leaders
- To forecast the size of the market segments concerning North America, Europe, the Asia Pacific, and the Rest of the World (Latin America and the Middle East & Africa)
- To strategically analyze the market structure and profile key players and their core competencies in the RBM software market
To track and analyze competitive developments such as product launches, expansions, acquisitions, partnerships, and collaborations in the RBM software market.
Available Customizations
With the given market data, MarketsandMarkets offers customizations as per the company’s specific needs. The following customization options are available for the RBM software market report:
Product Analysis
- Product matrix, which gives a detailed comparison of the software portfolios of the top five companies
Company Information
- Detailed analysis and profiling of additional market players (up to 5)

 Generating Response ...


Growth opportunities and latent adjacency in Risk Based Monitoring Software Market