The research study conducted on the Rocket and missile market involved extensive use of secondary sources, including directories, databases of articles, journals on rockets and missiles, company newsletters, and information portals such as Arms Control Association, Bloomberg, and Factiva to identify and collect information useful for this extensive, technical, market-oriented, and commercial study of the rocket and missile market. Primary sources are several industry experts from the core and related industries, alliances, organizations, Original Equipment Manufacturers (OEMs), vendors, suppliers, and technology developers. These sources relate to all segments of the value chain of the rocket and missile industry. In-depth interviews were conducted with various primary respondents, including key industry participants, subject-matter experts, C-level executives of key market players, and industry consultants, among others, to obtain and verify critical qualitative and quantitative information and to assess future prospects of the market.
Secondary Research
In the secondary research process, various secondary sources were referred to identify and collect information for this study on the rocket and missile market. Secondary sources included annual reports, press releases, and investor presentations of companies; white papers and certified publications; articles from recognized authors; manufacturer's associations; directories; and databases. Secondary research was mainly used to obtain key information about the supply chain of the Rocket and missile industry, the monetary chain of the market, the total pool of key players, market classification and segmentation according to the industry trends to the bottom-most level, regional markets, and key developments from both market- and technology-oriented perspectives.
Primary Research
Extensive primary research has been conducted after obtaining information regarding the rocket and missile market scenario through secondary research. Several primary interviews have been conducted with market experts from both the demand and supply sides across major countries of North America, Europe, Asia Pacific, Middle East, Africa, and Latin America. Primary data has been collected through questionnaires, emails, and telephonic interviews. These interviews have been conducted to gather insights such as market statistics, data on revenue collected from the products and services, market breakdowns, market size estimations, market size forecasting, and data triangulation. It has also helped analyze the product, speed, launch mode, propulsion type, and guidance mechanism segments of the market for five key regions.
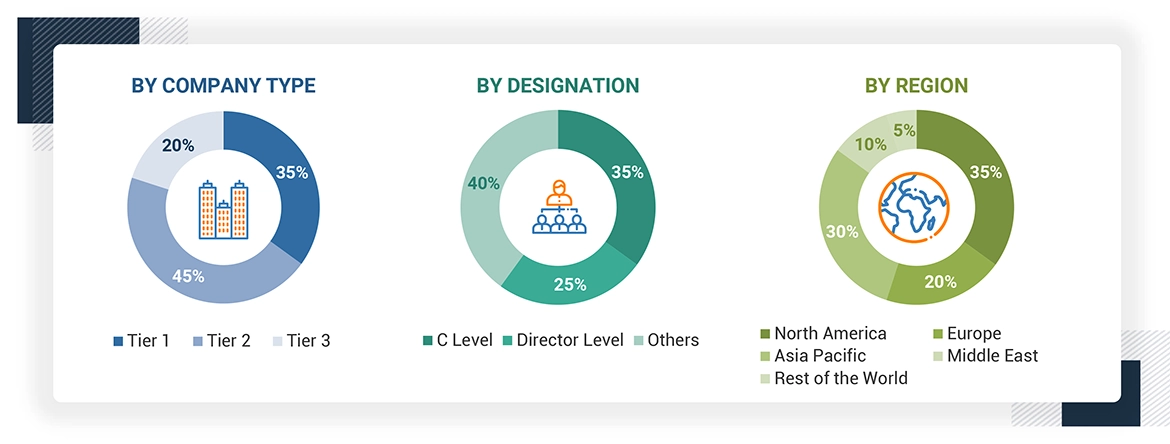
Note: Others include aircraft upholsterers, upholsterer technicians, and aircraft cabin modification industry experts. Tiers of companies are based on their revenue in 2023. Tier 1: company revenue greater than USD 1 billion; tier 2: company revenue between USD 100 million and USD 1 billion; and tier 3: company revenue less than USD 100 million.
About the assumptions considered for the study, To know download the pdf brochure


 HIGHEST CAGR MARKET IN 2024
 US FASTEST-GROWING MARKET IN THE REGION
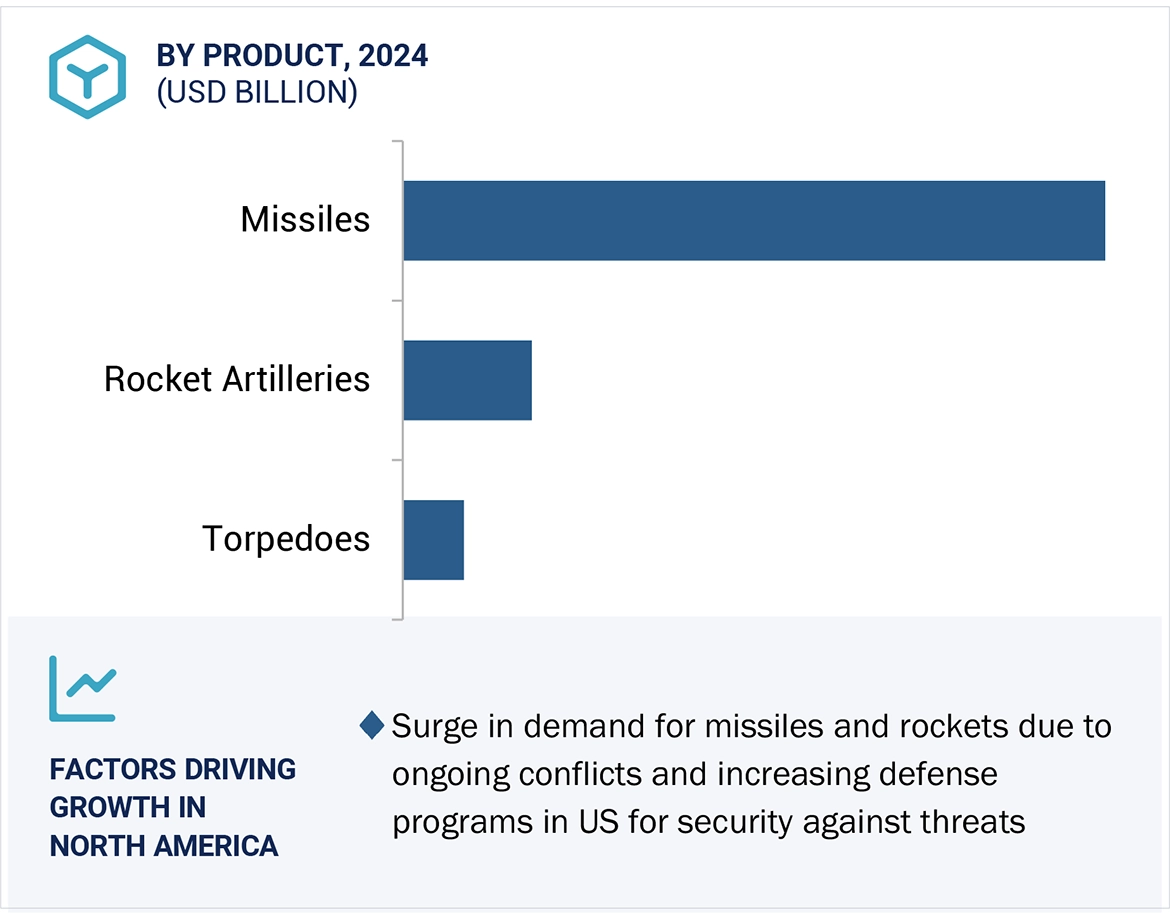


Growth opportunities and latent adjacency in Rocket and Missile Market