Self-Checkout Systems Market by Offering (Hardware, Software, and Services), Mounting Type (Standalone and Wall Mounted & Countertop), Model Type (Cash Model and Cashless Model), End User, and Geography - Global Forecast to 2032


 Exclusive indicates content/data unique to MarketsandMarkets and not available with any competitors.
Table of Contents
1 Introduction (Page No. - 12)
1.1 Objectives of the Study
1.2 Market Definition
1.3 Study Scope
1.3.1 Markets Covered
1.3.2 Year Considered for the Study
1.4 Currency
1.5 Package Size
1.6 Limitations
1.7 Stakeholders
2 Research Methodology (Page No. - 16)
2.1 Research Data
2.1.1 Secondary Data
2.1.1.1 Key Data From Secondary Sources
2.1.2 Primary Data
2.1.2.1 Key Data From Primary Sources
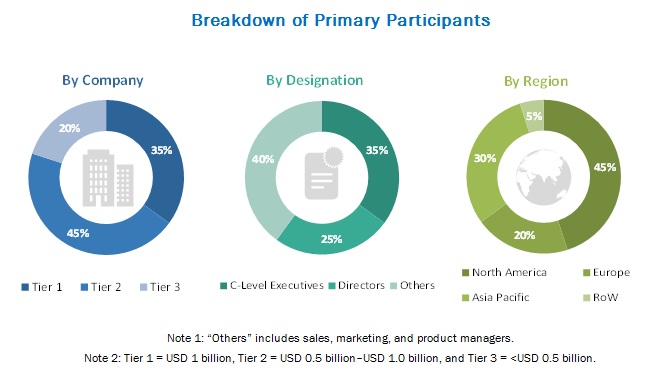
2.1.2.2 Breakdown of Primaries
2.1.2.3 Key Industry Insights
2.2 Market Size Estimation
2.3 Market Breakdown and Data Triangulation
2.4 Assumptions
3 Executive Summary (Page No. - 25)
4 Premium Insights (Page No. - 29)
4.1 Self-Checkout Systems Expected to Have A Huge Growth Opportunity in APAC
4.2 Self-Checkout Systems, By Mounting Type (2016–2022)
4.3 Self-Checkout Systems, By Region and End User
4.4 Self-Checkout Systems, By Model Type
4.5 Self-Checkout Systems, By Region (2016)
5 Market Overview (Page No. - 33)
5.1 Introduction
5.2 Market Segmentation
5.2.1 Self-Checkout Systems, By Offering
5.2.2 Self-Checkout Systems, By Mounting Type
5.2.3 Self-Checkout Systems, By Model Type
5.2.4 Self-Checkout Systems, By End User
5.2.5 Self-Checkout Systems, By Region
5.3 Market Dynamics
5.3.1 Drivers
5.3.1.1 Increase in Checkout Speed
5.3.1.2 Reduces Operational Cost
5.3.1.3 Caters to the Labor Shortage Issues Across the Developed Countries
5.3.2 Restraints
5.3.2.1 Reluctance to Use Self-Checkout Systems
5.3.2.2 Increased Risk of Loss of Inventory
5.3.3 Opportunities
5.3.3.1 Growing Demand From Retail Stores Such as Convenience Stores and Specialty Stores
5.3.4 Challenges
5.3.4.1 Successful Implementation of Self-Checkout Systems
6 Industry Trends (Page No. - 40)
6.1 Introduction
6.2 Value Chain Analysis
6.3 Porter’s Five Forces Model
6.3.1 Threat of New Entrants
6.3.2 Threat of Substitutes
6.3.3 Bargaining Power of Suppliers
6.3.4 Bargaining Power of Buyers
6.3.5 Intensity of Competitive Rivalry
7 Market, By Offering (Page No. - 47)
7.1 Introduction
7.2 Hardware
7.2.1 Display Devices
7.2.2 Price Readers
7.2.3 Payment-Related Hardware
7.2.4 Weighing Scales
7.2.5 Others
7.3 Software
7.4 Services
8 Market, By Model Type (Page No. - 52)
8.1 Introduction
8.2 Cash Model Type
8.3 Cashless Model Type
9 Market, By Mounting Type (Page No. - 56)
9.1 Introduction
9.2 Stand-Alone Mounting Type
9.3 Wall-Mounted and Countertop Mounting Type
10 Market, By End User (Page No. - 60)
10.1 Introduction
10.2 Supermarkets
10.3 Hypermarkets and DEPArtment Stores
10.4 Convenience Stores
10.5 Others
11 Market, By Geography (Page No. - 64)
11.1 Introduction
11.2 North America
11.2.1 U.S.
11.2.2 Canada
11.2.3 Mexico
11.3 Europe
11.3.1 U.K.
11.3.2 Germany
11.3.3 France
11.3.4 Rest of Europe
11.4 Asia-Pacific (APAC)
11.4.1 Japan
11.4.2 China
11.4.3 Australia
11.4.4 Rest of Apac
11.5 Rest of the World (RoW)
11.5.1 South America
11.5.2 Middle East and Africa
12 Competitive Landscape (Page No. - 86)
12.1 Overview
12.2 Market Ranking Analysis: Market
12.3 Competitive Situation
12.3.1 New Product Launches and Developments
12.3.2 Partnerships, Agreements, and Collaborations
12.3.3 Acquisitions, Contracts, and Joint Ventures
13 Company Profiles (Page No. - 92)
13.1 Introduction
(Business Overview, Products & Services, Key Insights, Recent Developments, SWOT Analysis, Ratio Analysis, MnM View)*
13.2 NCR Corporation
13.3 Diebold Nixdorf, Inc.
13.4 Fujitsu Limited
13.5 Toshiba Tec Corporation
13.6 ITAB Scanflow AB
13.7 ECR Software Corporation
13.8 Pan-Oston Co.
13.9 IER
13.10 Computer Hardware Design, Ltd.
13.11 PCMS Group PLC
13.12 Slabb Inc.
*Details on Business Overview, Products & Services, Key Insights, Recent Developments, SWOT Analysis, MnM View Might Not Be Captured in Case of Unlisted Companies.
14 Appendix (Page No. - 116)
14.1 Insights of Industry Experts
14.3 Knowledge Store: Marketsandmarkets’ Subscription Portal
14.4 Introducing RT: Real Time Market Intelligence
14.5 Available Customizations
14.6 Related Reports
14.7 Author Details
List of Tables (35 Tables)
Table 1 Self-Checkout Systems Market in Terms of Value and Volume, 2013–2022
Table 2 Self-Checkout Systems, By Offering, 2013–2022 (USD Million)
Table 3 Self-Checkout Systems, By Model Type, 2013–2022 (USD Million)
Table 4 Self-Checkout Systems for Cash Model Type, By Region, 2013–2022 (USD Million)
Table 5 Self-Checkout Systems for Cashless Model Type, By Region, 2013–2022 (USD Million)
Table 6 Self-Checkout Systems, By Mounting Type, 2013–2022 (USD Million)
Table 7 Self-Checkout Systems, By End User, 2013–2022 (USD Million)
Table 8 Self-Checkout Systems, By Region, 2013–2022 (USD Million)
Table 9 Market in North America, By Country, 2013–2022 (USD Million)
Table 10 Self-Checkout Systems in North America, By End User, 2013–2022 (USD Million)
Table 11 Self-Checkout Systems in North America, By Model Type, 2013–2022 (USD Million)
Table 12 Self-Checkout Systems in the U.S., By End User, 2013–2022 (USD Million)
Table 13 Self-Checkout Systems in Canada, By End User, 2013–2022 (USD Million)
Table 14 Self-Checkout Systems in Mexico, By End User, 2013–2022 (USD Million)
Table 15 Self-Checkout Systems in Europe, By Country, 2013–2022 (USD Million)
Table 16 Self-Checkout Systems in Europe, By End User, 2013–2022 (USD Million)
Table 17 Self-Checkout Systems in Europe, By Model Type, 2013–2022 (USD Million)
Table 18 Self-Checkout Systems in the U.K., By End User, 2013–2022 (USD Million)
Table 19 Self-Checkout Systems in Germany, By End User, 2013–2022 (USD Million)
Table 20 Self-Checkout Systems in France, By End User, 2013–2022 (USD Million)
Table 21 Self-Checkout Systems in Rest of Europe, By End User, 2013–2022 (USD Million)
Table 22 Self-Checkout Systems in Apac, By Country, 2013–2022 (USD Million)
Table 23 Self-Checkout Systems in Apac, By End User, 2013–2022 (USD Million)
Table 24 Self-Checkout Systems in Apac, By Model Type, 2013–2022 (USD Million)
Table 25 Self-Checkout Systems in Japan, By End User, 2013–2022 (USD Million)
Table 26 Self-Checkout Systems in China, By End User, 2013–2022 (USD Million)
Table 27 Self-Checkout Systems in Australia, By End User, 2013–2022 (USD Million)
Table 28 Self-Checkout Systems in Rest of Apac, By End User, 2013–2022 (USD Million)
Table 29 Self-Checkout Systems in RoW, By Region, 2013–2022 (USD Million)
Table 30 Self-Checkout Systems in South America, By End User, 2013–2022 (USD Million)
Table 31 Self-Checkout Systems in Middle East and Africa, By End User, 2013–2022 (USD Million)
Table 32 Ranking Analysis: Self-Checkout Systems Market
Table 33 New Product Launches and Developments, 2014–2016
Table 34 Partnerships, Agreements, and Collaborations, 2014–2016
Table 35 Acquisitions, Contracts, and Joint Ventures, 2014–2016
List of Figures (48 Figures)
Figure 1 Market Segmentation: Self-Checkout Systems
Figure 2 Self-Checkout Systems : Process Flow of Market Size Estimation
Figure 3 Self-Checkout Systems : Research Design
Figure 4 Bottom-Up Approach for Market Size Estimation: Self-Checkout Systems Market
Figure 5 Top-Down Approach for Market Size Estimation: Self-Checkout Systems
Figure 6 Data Triangulation
Figure 7 Market: Market Size Analysis (2013–2022)
Figure 8 Market for Supermarkets Expected to Dominate During the Forecast Period
Figure 9 North America Accounted for the Largest Share of the Self-Checkout Systems in 2015
Figure 10 Attractive Growth Opportunities in the Self-Checkout Systems Market
Figure 11 Market for Wall-Mounted and Countertop Systems Expected to Grow at A Higher CAGR Between 2016 and 2022
Figure 12 North America Expected to Hold the Largest Share of the Self-Checkout Systems in 2016
Figure 13 Market for Cashless Type Systems Expected to Grow at A Higher Rate During the Forecast Period
Figure 14 U.S. Expected to Hold the Largest Share of Self-Checkout Systems in 2016
Figure 15 Market, By Region
Figure 16 Drivers, Restraints, Opportunities, and Challenges for the Market
Figure 17 Value Chain Analysis: Major Value Addition Takes Place During the Manufacturing and Assembly, and Software Development Phases
Figure 18 Porter’s Five Forces Analysis
Figure 19 Porter’s Analysis: Market
Figure 20 Impact Analysis of Threat of New Entrants
Figure 21 Impact Analysis of Threat of Substitutes
Figure 22 Impact Analysis of Bargaining Power of Suppliers
Figure 23 Impact Analysis of Bargaining Power of Buyers
Figure 24 Impact Analysis of Intensity of Competitive Rivalry
Figure 25 Hardware Offerings Expected to Hold the Largest Size of the Self-Checkout Systems Market During the Forecast Period
Figure 26 Self-Checkout Systems Market, By Model Type
Figure 27 Cash Model Type Expected to Hold A Larger Size of the Self-Checkout Systems During the Forecast Period
Figure 28 Market, By Mounting Type
Figure 29 Stand-Alone Mounting Type Expected to Hold the Largest Size of the Self-Checkout Systems During the Forecast Period
Figure 30 Market, By End User
Figure 31 Market for Convenience Stores Expected to Grow at the Highest Rate During the Forecast Period
Figure 32 Geographic Snapshot (2015): APAC Countries Such as China and Japan Expected to Witness Significant Growth During the Forecast Period
Figure 33 Snapshot of the Self-Checkout Systems in North America: Convenience Stores Expected to Grow at A High Rate Between 2016 and 2022
Figure 34 Snapshot of the Self-Checkout Systems in Europe: Supermarkets Expected to Hold the Largest Size of the Market During the Forecast Period
Figure 35 Snapshot of the Self-Checkout Systems in Apac: Japan Expected to Hold the Largest Size of the Market During the Forecast Period
Figure 36 New Product Launches and Developments as the Key Growth Strategy Adopted By the Company (2014–2016)
Figure 37 Battle for Market Share: New Product Launches and Developments: Key Strategies Adopted By Major Players in the Market
Figure 38 Market Evaluation Framework: New Product Launches and Developments Fueled Innovation and Growth of the Companies Between 2014 and 2016
Figure 39 Geographic Revenue Mix of Top Market Players
Figure 40 NCR Corp.: Company Snapshot
Figure 41 NCR Corp.: SWOT Analysis
Figure 42 Wincor Nixdorf AG: Company Snapshot
Figure 43 Wincor Nixdorf AG: SWOT Analysis
Figure 44 Fujitsu Ltd.: Company Snapshot
Figure 45 Fujitsu Ltd.: SWOT Analysis
Figure 46 Toshiba Tec Corp.: Company Snapshot
Figure 47 Toshiba Tec Corp.: SWOT Analysis
Figure 48 ITAB Scanflow AB: SWOT Analysis
Secondary Research
In the secondary research process, various secondary sources have been referred to for identifying and collecting information important for this study. These secondary sources include retail journals and magazines, IEEE journals; annual reports, press releases, and investor presentations of companies; white papers; and certified publications and articles from recognized authors, directories, and databases such as Factiva, Hoovers, and OneSource.
Primary Research
In the primary research process, various primary sources from both supply and demand sides have been interviewed to obtain qualitative and quantitative information important for this report. The primary sources from the supply side include industry experts such as CEOs, VPs, marketing directors, technology and innovation directors, and related executives from key companies and organizations operating in the self-checkout systems market. After complete market engineering (including calculations regarding market statistics, market breakdown, market size estimations, market forecasting, and data triangulation), extensive primary research has been conducted to gather information as well as verify and validate the critical numbers arrived at.
To know about the assumptions considered for the study, download the pdf brochure
Market Size Estimation
In the complete market engineering process, both top-down and bottom-up approaches have been implemented, along with several data triangulation methods, to estimate and validate the size of the self-checkout systems market and other dependent submarkets listed in this report.
- The key players in the industry and markets have been identified through extensive secondary research.
- The industry’s supply chain and market size, in terms of value, have been determined through primary and secondary research processes.
- All percentage shares, splits, and breakdowns have been determined using secondary sources and verified through primary sources.
Data Triangulation
After arriving at the overall market size from the estimation process explained above, the overall market has been split into several segments and subsegments. To complete the overall market engineering process and arrive at the exact statistics for all segments and subsegments, the market breakdown and data triangulation procedures have been employed, wherever applicable. The data have been triangulated by studying various factors and trends identified from both demand and supply sides, in retail industry.
Report Objectives
The following are the major objectives of the study.
- To define, describe, and forecast the self-checkout systems market, segmented on the basis of offering, mounting type, model type, end user, and geography
- To define, describe, and forecast the global market in terms of volume
- To forecast the size of the market, in terms of value, and its market segments with respect to four main regions, namely, North America, Europe, Asia-Pacific (APAC), and Rest of the World (RoW)
- To identify the major market trends and factors driving or inhibiting the growth of the market and its submarkets
- To provide value chain analysis as well as the impact of the Porter’s five forces on the market
- To strategically analyze the micromarkets with respect to individual growth trends, future prospects, and contribution to the overall market
- To analyze the opportunities in the market for stakeholders by identifying the high-growth segments of the market
- To strategically profile the key players operating in the self-checkout systems market and comprehensively analyze their market ranking and core competencies
- To analyze the strategic developments such as new product launches, alliances, joint ventures, and mergers and acquisitions in the market
Scope of the Report
|
Report Metric |
Details |
|
Market size available for years |
2013-2022 |
|
Base year considered |
2015 |
|
Forecast period |
2016-2022 |
|
Forecast units |
Value (USD) and Volume (Thousand Units) |
|
Segments covered |
Offering, Model Type, Mounting Type, End User, and Region |
|
Geographies covered |
North America, APAC, Europe and RoW |
|
Companies covered |
NCR Corporation (US), Diebold Nixdorf (US), Fujitsu (Japan), Toshiba TEC (Japan), ITAB ScanFlow (Sweden) |
This research report categorizes the market based on offering, model type, mounting type, end user, and region.
Self-Checkout Systems Market, by Offering
- Hardware
- Software
- Services
Self-Checkout Systems Market, by Model Type
- Cash Model Type
- Cashless Model Type
Self-Checkout Systems Market, by Mounting Type
- Stand-alone Mounting Type
- Wall-mounted and countertop Mounting Type
Self-Checkout Systems Market, by End User
- Supermarkets
- Hypermarkets and Department Stores
- Convenience Stores
- Others
Self-Checkout Systems Market, by Geography
- North America (US, Canada, and Mexico)
- Europe (UK, Germany, France, and Rest of Europe)
- APAC (Japan, China, Australia, and Rest of APAC)
- RoW (South America, and the Middle East and Africa)
Available Customizations
With the given market data, MarketsandMarkets offers customizations according to the company’s specific needs. The following customization options are available for the report:
Company Information:
Detailed analysis and profiling of additional market players (up to 5)


Growth opportunities and latent adjacency in Self-Checkout Systems Market