
Interactive Kiosk Market Size, Share & Trends

Interactive Kiosk Market Size, Share & Trends by Information & Directory, Bitcoin, Ordering & Retail, Ticketing & Reservation, Hospitality & Travel, Public Sector, Restaurant & QSR, Financial Service, Healthcare, Floor-standing, Wall-mounted, Region - Global Forecast to 2030


INTERACTIVE KIOSK MARKET SIZE, SHARE & TRENDS
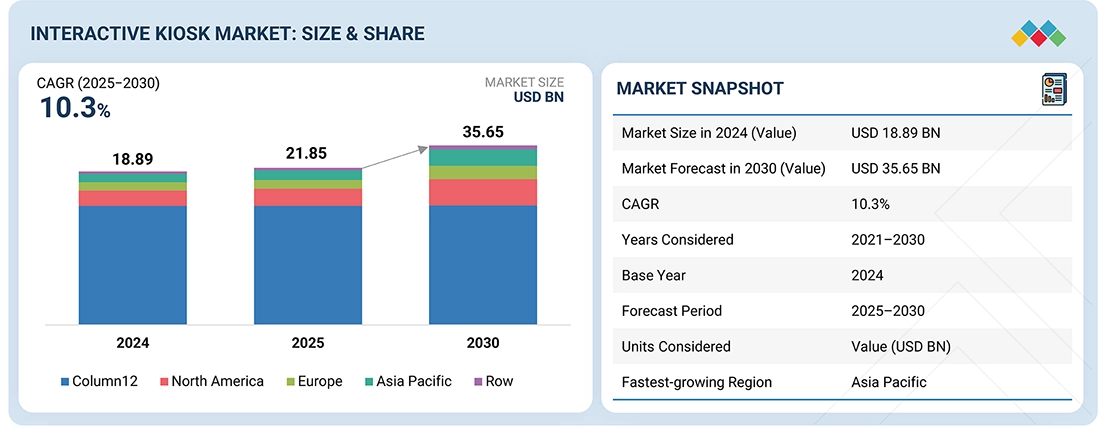
According to Marketsandmarkets, the interactive kiosk market size was valued at USD 21.85 billion in 2025 and is projected to reach USD 35.65 billion by 2030, growing at a CAGR of 10.3% 2025-2030.The market is driven by the increasing deployment of interactive kiosks across retail, hospitality, transportation, banking, healthcare, and government sectors. Rising demand for self-service automation, contactless transactions, and enhanced customer engagement fuels the adoption.
MARKET SNAPSHOT TABLE
| REPORT METRIC | DETAILS |
|---|---|
| Market Size in 2025 (Value) | USD 21.85 Billion |
| Market Forecast in 2030 (Value) | USD 35.65 Billion |
| Growth Rate | CAGR of 10.3% from 2025–2030 |
| Years Considered | 2021–2030 |
| Base Year | 2024 |
| Forecast Period | 2025–2030 |
| Units Considered | Value (USD Billion), Volume (Thousand Units) |
| Report Coverage | Revenue Forecast, Company Ranking, Competitive Landscape, Growth Factors, and Trends |
| Top Companies |
|
| Growth Driver |
|
| Segments Covered |
|
| Regions Covered | North America, Europe, Asia Pacific, and RoW |
Market Size & Forecast
KEY TAKEAWAYS
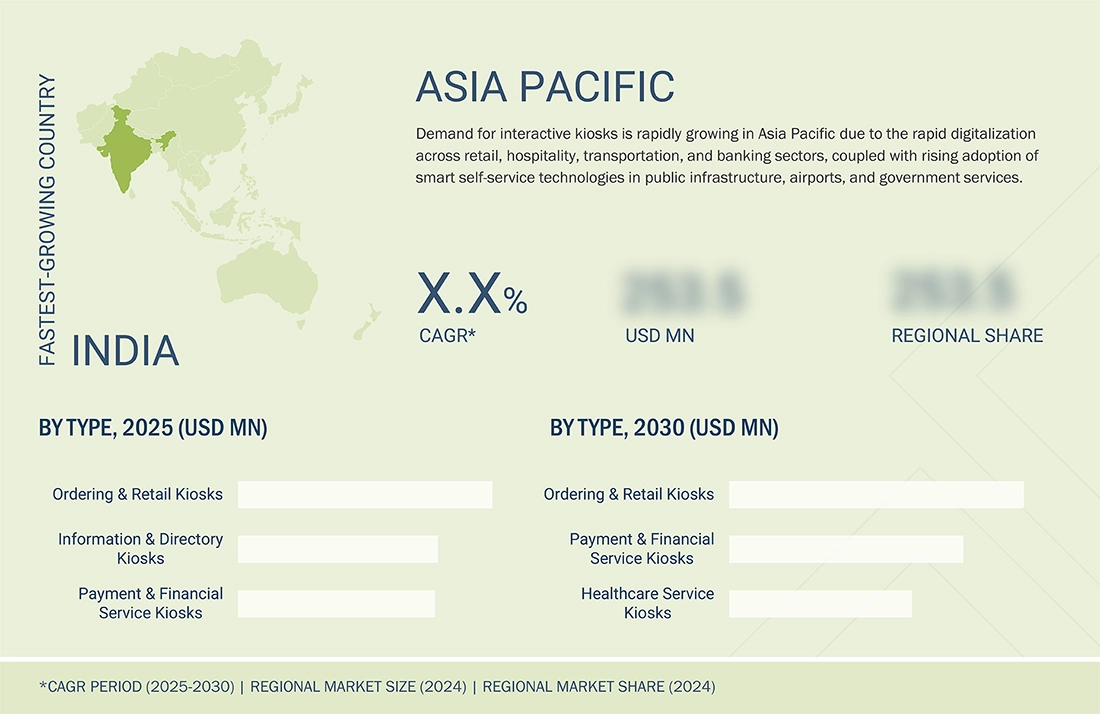
- BY region, Asia Pacific is projected to register the highest growth rate of 39% during the forecast period.
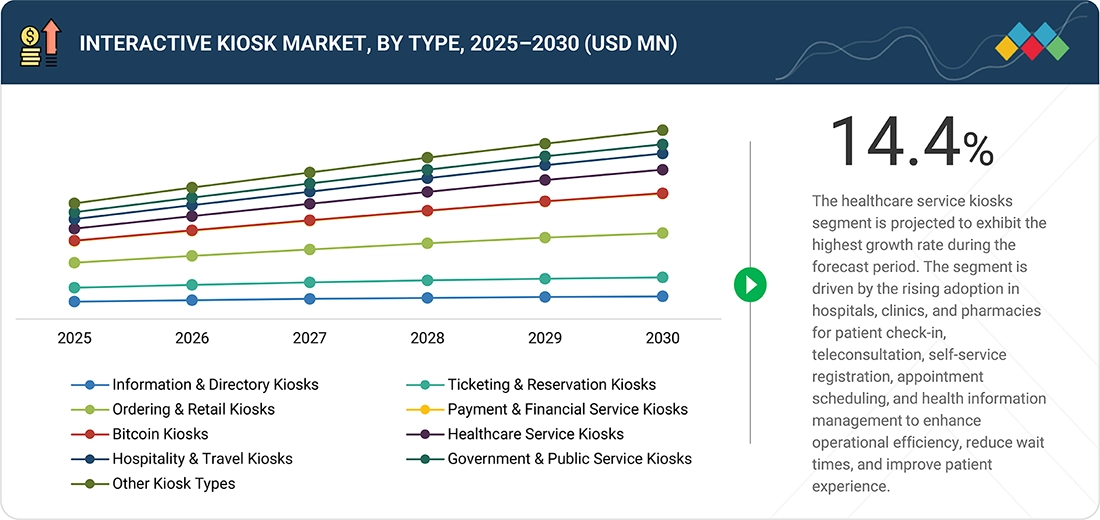
- By type, the healthcare service kiosks segment is projected to register the highest growth rate of 14.4% during the forecast period.
- By vertical, the retail segment is dominating the interactive kiosk market with 23% in 2024
- By offering, the software segment is projected to register the highest growth rate of 13.6% during the forecast period.
- By location, the indoor segment is dominating the interactive kiosk market with 76% in 2024
- By mounting type, the other kiosks segment is projected to register the highest growth rate of 14% during the forecast period.
- By display panel size, the medium segment is dominating the interactive kiosk market with 51% in 2024
- The leading players in the interactive kiosk market include NCR Voyix Corporation (US), Diebold Nixdorf, Incorporated (US), Zebra Technologies Corp. (US), Advantech Co., Ltd. (Taiwan), and Glory Ltd. (Japan). Companies focus on strategic partnerships, acquisitions, and R&D investments to expand their solution portfolios and global presence. Emphasis on AI-powered interfaces, cloud connectivity, and remote monitoring capabilities enables vendors to deliver scalable and adaptive kiosk systems catering to retail, public infrastructure, and service-based applications.
- Company VeriFone, Inc., ACRELEC, and Evoke Creative were identified as star players in the market given their strong market share and product footprint.
The interactive kiosk market share is projected to grow significantly over the next decade, driven by rising demand in retail, transportation, hospitality, financial services, and government applications. Increasing adoption of self-service technologies, automation, and contactless transactions, along with advancements in IoT integration, AI-based analytics, and compact modular kiosk systems, is further accelerating market expansion globally.In addition, advancements in touch technology, AI-based personalization, and cloud-integrated kiosk management platforms accelerate market expansion. In the transportation sector, airports and metro stations increasingly integrate digital kiosks for automated ticketing and passenger assistance, while in retail and QSR environments, interactive kiosks are enabling self-checkout, ordering, and loyalty registration. The growing implementation of smart city projects and digital public service initiatives further strengthen the adoption of interactive kiosks globally.
Source: Secondary Research, Interviews with Experts, MarketsandMarkets Analysis
TRENDS & DISRUPTIONS IMPACTING CUSTOMERS' CUSTOMERS
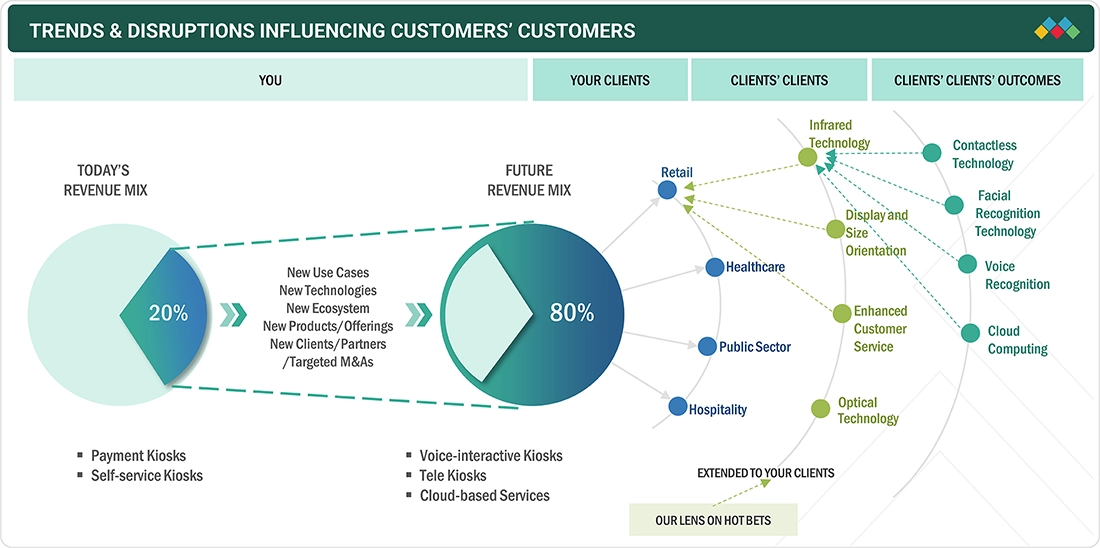
The interactive kiosk market trends is witnessing a transition toward new revenue sources driven by the integration of advanced technologies, such as voice interaction, facial recognition, contactless interfaces, and cloud-based connectivity. Traditional kiosk applications in retail, hospitality, healthcare, and public services are evolving into intelligent self-service ecosystems that enhance customer experience, operational efficiency, and service personalization. Voice-interactive kiosks are gaining traction across quick-service restaurants and retail environments, enabling faster, hands-free ordering and improved accessibility. Similarly, tele-kiosks and cloud-managed systems are transforming healthcare and government sectors by supporting remote consultations, digital service delivery, and real-time data synchronization. These next-generation solutions represent key future drivers, expanding the revenue mix toward AI-enabled, connected, and analytics-driven kiosk platforms expected to dominate the market in the coming years.
Source: Secondary Research, Interviews with Experts, MarketsandMarkets Analysis
INTERACTIVE KIOSK MARKET DYNAMICS
Level
-
Growing preference for contactless and secure payment technologies

-
Mounting demand for self-service kiosks across industries

Level
-
High initial setup and maintenance costs

-
Cybersecurity and data privacy concerns

Level
-
High emphasis on streamlining operations in healthcare and government sectors

-
Growing popularity of QSRs and convenience retail

Level
-
Requirement for continuous software and hardware lifecycle management

-
Environmental and vandalism concerns in outdoor installations

Source: Secondary Research, Interviews with Experts, MarketsandMarkets Analysis
Driver: Growing preference for contactless and secure payment technologies
Interactive kiosks are increasingly adopted across retail, banking, hospitality, healthcare, and transportation sectors to provide secure, contactless, and automated service experiences. The shift toward digital transactions and customer self-service models boosts the adoption, particularly due to the widespread demand for hygiene and operational efficiency. Integration of AI, IoT, and biometric authentication further enhance kiosk functionality, enabling personalized services, data-driven engagement, and remote management. Additionally, the expansion of smart city projects and digital transformation initiatives in emerging economies creates new opportunities for deploying interactive kiosks across public spaces and service touchpoints.
Restraint: High initial setup and maintenance costs
Despite their advantages, interactive kiosks involve high initial investment due to hardware procurement, installation, and integration expenses. Maintenance costs, including regular software updates, security upgrades, and hardware replacements, add to the total cost of ownership. Small and medium enterprises often face budget constraints that limit large-scale deployment. Moreover, environmental exposure in outdoor installations demands robust designs, increasing production and servicing costs. These challenges collectively restrict adoption in price-sensitive markets, particularly among small retailers and local service providers.
Opportunity: High emphasis on streamlining operations in healthcare and government sectors
The growing implementation of AI and cloud-based analytics in kiosks is opening new growth avenues in the healthcare, public administration, and education sectors. Smart kiosks equipped with AI-enabled chatbots, voice interaction, and facial recognition improve service accessibility and automate administrative processes. In healthcare, these kiosks are used for patient check-in, data verification, and teleconsultation, while in government offices they facilitate citizen service delivery and digital documentation. Integration with e-payment systems and identity management platforms transforms kiosks into multipurpose digital service hubs, creating strong long-term revenue opportunities
Challenge: Environmental and vandalism concerns in outdoor installations
One of the key challenges in the interactive kiosk market is ensuring consistent performance and durability across diverse environmental conditions. Kiosks deployed in outdoor or high-traffic public areas are prone to wear, vandalism, and exposure to temperature fluctuations, which may impact touchscreen responsiveness and system stability. Additionally, data privacy and cybersecurity regulations require strict compliance for kiosks handling sensitive personal or financial information. Adherence to accessibility standards, such as ADA and GDPR compliance, further adds to the design and deployment complexities, compelling manufacturers to invest in advanced hardware protection and secure data architecture
Interactive Kiosk Market: COMMERCIAL USE CASES ACROSS INDUSTRIES
| COMPANY | USE CASE DESCRIPTION | BENEFITS |
|---|---|---|
 |
Partnered with Diebold Nixdorf to deploy self-service kiosks equipped with modern multi-touch interfaces for Power Card purchases, recharges, and food ordering; kiosks were designed for high-speed transactions and seamless integration into the entertainment environment | Reduced wait times, improved staff efficiency | Enabled guests to spend more time playing and recharging cards | Enhanced the overall digital experience with a modular, scalable, and future-proof self-service solution |
 |
Collaborated with Pyramid Computer GmbH to install Polytouch self-service kiosks across retail stores, integrating them with POS and CRM systems to enable checkout, product lookup, loyalty registration, and digital payments | Improved checkout efficiency by over 40% | Reduced queue times | Increased data accuracy for loyalty analytics | Enhanced customer engagement as part of broader retail digital transformation strategy |
 |
Deployed KALEA interactive kiosks from ADVANTECH-AURES at its HOSHO budget hotels to enable guests to perform self check-in/out, access keycards, and make on-site payments via integrated scanners and payment modules | Provided 24/7 access for guests, reduced front-desk congestion | Improved check-in efficiency | Supported scalable hotel automation across European cities through modern, guest-centric experience |
 |
Partnered with Pyramid Computer GmbH to integrate POLYTOUCH PASSPORT 32 kiosks within hospital networks, supporting patient self check-in, data entry, wayfinding, and digital payments under Siemens’ HiMed healthcare platform | Streamlined patient admission | Reduced check-in times | Improved data accuracy | Minimized administrative burden, enabling staff to focus more on patient care while advancing healthcare digitalization |
 |
Implemented Lamasatech’s Dynamo survey & feedback kiosks across its public parks to collect real-time visitor feedback through smiley-face, multiple-choice, and open-ended questions via wired and 4G-connected units | Enhanced visitor engagement | Improved feedback response rates | Provided actionable insights in real time | Enabled faster operational decisions to address issues and boost public satisfaction |
Logos and trademarks shown above are the property of their respective owners. Their use here is for informational and illustrative purposes only.
INTERACTIVE KIOSK MARKET ECOSYSTEM
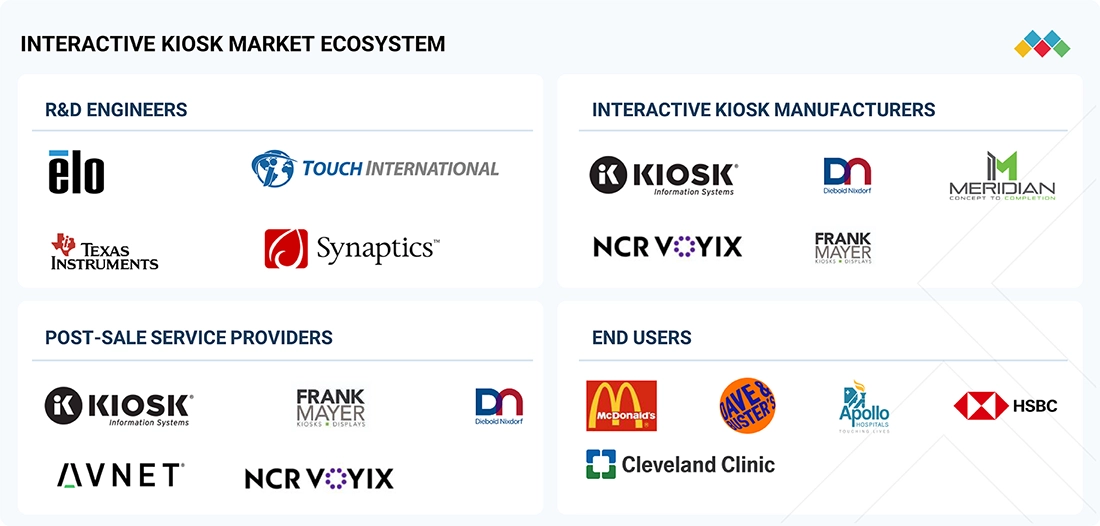
The interactive kiosk market share ecosystem comprises established providers, including NCR Voyix Corporation (US), Diebold Nixdorf, Incorporated (US), Zebra Technologies Corp. (US), Advantech Co., Ltd. (Taiwan), and Glory Ltd. (Japan). The ecosystem also involves key stakeholders represented in the figure, such as R&D engineers (Elo, Synaptics, Texas Instruments, Touch International), interactive kiosk manufacturers (NCR Voyix, Diebold Nixdorf, Frank Mayer, Meridian Kiosks), post-sale service providers (KIOSK Information Systems, Frank Mayer, Avnet), and end users (McDonald’s, Auntie Anne’s, Apollo Hospitals, Cleveland Clinic, HSBC). The synergy among these participants fosters continuous innovation across kiosk design, touchscreen technology, payment integration, and AI-driven interfaces. Collaborations between R&D engineers, hardware manufacturers, and service providers are creating robust, connected, and customizable kiosk platforms, enhancing performance, security, and scalability. Growing adoption in retail, healthcare, hospitality, and banking sectors is further supported by digital transformation and the shift toward self-service automation.
Logos and trademarks shown above are the property of their respective owners. Their use here is for informational and illustrative purposes only.
INTERACTIVE KIOSK MARKET SEGMENTS
Source: Secondary Research, Interviews with Experts, MarketsandMarkets Analysis
Interactive Kiosk Market, By Type
The ordering & retail kiosks segment accounted for the largest market share in 2024, as these kiosks are widely used for people & motion interaction, payment processing, and consumer engagement due to their cost efficiency, reliability, and ease of integration. Self-service ordering kiosks are increasingly adopted across retail chains, quick-service restaurants, and convenience stores to enhance customer experience, reduce wait times, and streamline operations.
Interactive Kiosk Market, By Vertical
The retail segment accounted for a significant share in 2024, supported by the rising adoption of kiosks for self-checkout, product browsing, digital advertising, and customer feedback collection. Additionally, the healthcare and transportation sectors are witnessing growing deployment of kiosks for patient registration, ticketing, and information services to improve service efficiency and accessibility.
Interactive Kiosk Market, By Offering
The hardware segment accounted for the largest share in 2024, driven by the increasing integration of advanced touchscreens, biometric systems, and payment modules. The growing demand for durable, vandal-resistant enclosures and high-resolution displays further support the market growth. Meanwhile, software and services segments are expanding with the rising need for remote management and content customization.
Interactive Kiosk Market, By Location
The indoor segment accounted for the largest market share in 2024, as kiosks are extensively deployed in retail stores, airports, hospitals, and corporate environments for wayfinding, check-in, and digital engagement purposes. The outdoor segment is also witnessing robust growth due to the increasing deployment in transportation hubs, public spaces, and quick-service drive-thru restaurants for 24/7 customer interaction.
Interactive Kiosk Market, By Mounting Type
The floor-standing segment accounted for the largest market share in 2024 due to their widespread use in retail, hospitality, and transportation sectors for information display and transaction services. Wall-mounted and countertop kiosks are also gaining traction, especially in healthcare and financial institutions where space optimization and secure operation are key.
Interactive Kiosk Market, By Display Panel Size
The medium-sized segment accounted for the largest market share in 2024 due to the rising preference for kiosks with 32–55-inch displays offering an optimal balance between visibility and compactness. Large-format displays are increasingly adopted in transportation and retail environments for interactive advertising and digital signage, while smaller panels find usage in ticketing and self-check-in systems.
REGION
Asia Pacific is projected to register the highest CAGR in the global interactive kiosk market during the forecast period
The Asia Pacific interactive kiosk market growth is projected to witness the highest growth rate during the forecast period. This growth is attributed to the rapid digitalization, strong government initiatives for smart city development, and the expanding retail and transportation infrastructure across China, Japan, South Korea, and India. Additionally, the growing adoption of self-service technologies in banking, healthcare, and public service sectors and the increasing investment in AI-enabled kiosks and contactless payment solutions further fuel the market growth. The large-scale production capabilities and cost advantages also make it a major hub for interactive kiosk innovation and manufacturing.
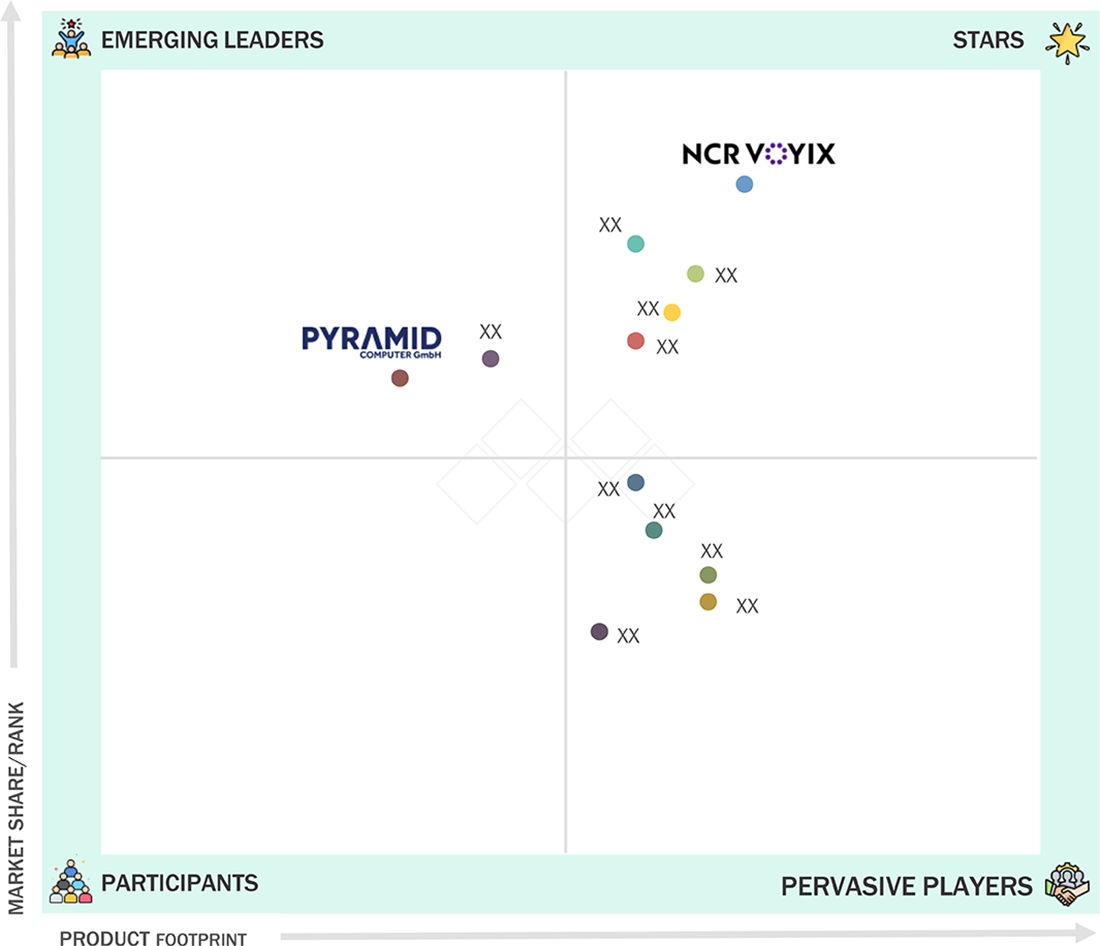
Interactive Kiosk Market: COMPANY EVALUATION MATRIX
In the interactive kiosk market, NCR Voyix (Star) leads with a strong global presence and a comprehensive product portfolio spanning self-service kiosks, point-of-sale (POS) systems, and digital transaction management solutions. Its focus on integrating AI-driven analytics, contactless payment technologies, and seamless omni-channel platforms positions it as a key innovator in enhancing customer experience across retail, banking, and hospitality sectors. Pyramid Computer (Emerging Leader) is also gaining significant traction, leveraging its expertise in modular kiosk design, customizable hardware platforms, and advanced display integration. The company’s Polytouch series has seen expanding adoption across healthcare, transportation, and quick-service restaurants, driven by its flexibility, ease of deployment, and robust software compatibility. While NCR Voyix dominates with its extensive solution portfolio and established client base, Pyramid Computer demonstrates strong potential to climb further in market positioning through continued innovation in interactive hardware engineering and customer-centric kiosk solutions.
Source: Secondary Research, Interviews with Experts, MarketsandMarkets Analysis
WHAT IS IN IT FOR YOU: Interactive Kiosk Market REPORT CONTENT GUIDE
DELIVERED CUSTOMIZATIONS
We have successfully delivered the following deep-dive customizations:
| CLIENT REQUEST | CUSTOMIZATION DELIVERED | VALUE ADDS |
|---|---|---|
| Interactive Kiosk Manufacturer | Detailed competitive profiling across self-service kiosk suppliers by type and vertical | Technology roadmap mapping by interface (touchscreen, gesture, voice-enabled) |
| Retail & QSR Chain Operator | Comprehensive mapping of kiosk vendors offering payment, ordering, and self-checkout solutions | Benchmarking across modular, countertop, and floor-standing systems |
| Healthcare Service Provider | Profiling of kiosk providers specialized in patient registration, queue management, and teleconsultation | Evaluation of HIPAA-compliant data security features |
| Banking & Financial Institution | Patent and product mapping of kiosk-based self-service terminals (excluding ATMs) | Evaluation of kiosk integration with cardless, biometric, and mobile payment systems |
RECENT DEVELOPMENTS
- October 2025 : Zebra Technologies Corp. acquired Elo Touch Solutions, Inc., an innovator of solutions that engage customers, to expand its presence in self-service kiosks, POS, and interactive touch displays. Elo’s expertise in consumer-facing touchpoints complements Zebra’s strengths in frontline devices and automation. The acquisition positions Zebra to deliver integrated, end-to-end connected retail and hospitality experiences.
- July 2025 : Diebold Nixdorf, Incorporated partnered with LOC Software, a software vendor focused on retail management systems, to streamline self-checkout deployments by integrating LOC’s ThriVersA platform natively with Diebold Nixdorf’s kiosk and self-checkout hardware.
- March 2024 : Spinneys, in collaboration with Diebold Nixdorf, Incorporated, launched Lebanon’s first “advanced self-checkout” installation. The system consists of Diebold Nixdorf’s DN Series EASY eXpress self-checkout kiosks, integrated with a security scale and running Vynamic Self-Service software. The platform is described as compact, modular, and built to support evolving retail needs, emphasizing flexibility, reliability, and adaptability.
Table of Contents
 Exclusive indicates content/data unique to MarketsandMarkets and not available with any competitors.
Methodology
The study involved four major activities in estimating the current size of the interactive kiosk market. Exhaustive secondary research was conducted to gather information on the market, adjacent markets, and the overall interactive kiosk landscape. These findings, assumptions, and projections were validated through primary research involving interviews with industry experts and key stakeholders across the value chain. Both top-down and bottom-up approaches were utilized to estimate the overall market size. Subsequently, market breakdown and data triangulation techniques were applied to determine the sizes of various segments and subsegments. Two key sources, secondary and primary, were leveraged to conduct a comprehensive technical and commercial assessment of the interactive kiosk market.
Secondary Research
The market for companies offering interactive kiosk solutions is arrived at by secondary data available through paid and unpaid sources, analyzing the product portfolios of major companies in the ecosystem, and rating the companies by their performance and quality. The secondary sources included annual reports, press releases, and investor presentations of companies; white papers; journals and certified publications; and articles from recognized authors, websites, directories, and databases. Secondary research was conducted to obtain key information about the industry’s supply chain, the market’s value chain, the total pool of key players, market segmentation according to the industry trends (to the bottom-most level), regional markets, and key developments from market- and technology-oriented perspectives. The secondary data was collected and analyzed to determine the overall market size, which is further validated through primary research.
Primary Research
Extensive primary research was conducted after gaining knowledge about the current scenario of the interactive kiosk market through secondary research. Several primary interviews were conducted with experts from the demand and supply sides across four major regions—North America, Europe, Asia Pacific, and RoW. This primary data was collected through questionnaires, emails, and telephonic interviews.

Notes: The three tiers of companies have been defined based on their total revenue as of 2024. The categorization given below has been applied:
Tier 1: >USD 1 billion, Tier 2: USD 250 million–USD 1 billion, and Tier 3: USD 250 million.
Other designations include sales managers, marketing managers, and product managers.
To know about the assumptions considered for the study, download the pdf brochure
Market Size Estimation
Both top-down and bottom-up approaches were used to estimate and validate the total size of the interactive kiosk market. These methods have also been used to estimate the size of various subsegments in the market. The following research methodology was used to estimate the market size:
- Identifying products currently provided or expected to be offered by providers
- Tracking major interactive kiosk manufacturers
- Estimating the size of the interactive kiosk market based on demand, considering installation base expansion, replacement cycles, and end user adoption across verticals such as retail, hospitality, transportation, and healthcare
- Tracking ongoing and upcoming product launches by companies and forecasting the market based on these developments and other critical parameters
- Conducting multiple discussions with key opinion leaders to understand the demand for interactive kiosks and analyzing the breakdown of the scope of work carried out by each major company
- Arriving at market estimates by analyzing revenues generated by manufacturers based on their locations (countries), and then combining country-based data to get a market estimate based on region
- Assigning a percentage to the overall revenue or, in a few cases, to segmental revenues of each company to derive their revenues from the sales of interactive kiosks. This percentage for each company has been assigned based on its product portfolio and target application
- Verifying and cross-checking estimates at every level through discussions with key opinion leaders, including CXOs, directors, operation managers, and domain experts at MarketsandMarkets
Interactive Kiosk Market: Top-Down and Bottom-Up Approach

Data Triangulation
After arriving at the overall size of the interactive kiosk market using the market size estimation process explained above, the total market was split into several segments and subsegments. Data triangulation and market breakdown procedures were employed, wherever applicable, to complete the overall market engineering process and arrive at the exact statistics for all segments and subsegments of the market. The data was triangulated by studying various factors and trends from the demand and supply sides. The market size was also validated using the top-down and bottom-up approaches.
Market Definition
The interactive kiosk refers to the ecosystem of self-service digital terminals that enable users to perform specific tasks or access information interactively without direct human assistance. These kiosks integrate hardware components, such as touchscreens, display panels, printers, scanners, sensors, and computing units, with software interfaces and connectivity features to deliver automated services across various public and commercial environments.
Interactive kiosks are deployed for diverse functions, including information dissemination, ticketing, payment transactions, product ordering, check-in/check-out, wayfinding, and other customer engagement applications. They are utilized across industries such as retail, banking & financial services, healthcare, transportation, hospitality, government, education, and entertainment.
An interactive kiosk represents the growing convergence of automation, IoT, AI-driven interfaces, and digital payment technologies in self-service solutions aimed at improving accessibility, reducing operational costs, and increasing customer engagement across physical touchpoints.
Key Stakeholders
- Raw material and component suppliers
- Display and touchscreen manufacturers
- Hardware component suppliers (processors, sensors, printers, scanners, etc.)
- Software and platform developers
- Original equipment manufacturers (OEMs)
- Original design manufacturers (ODMs) and kiosk integrators
- System integrators and solution providers
- Payment solution providers
- Networking and connectivity providers
- Distributors and retailers
- Research and development organizations
- Technology standards organizations, forums, alliances, and associations
- Technology investors and venture capital firms
- End users (retail, hospitality, transportation, BFSI, healthcare, government, entertainment, etc.)
- Maintenance and service providers
- Value-added resellers (VARs)
Report Objectives
- To describe and forecast the size of the interactive kiosk market, by offering, type, location, display panel size, mounting type, and vertical, in terms of value
- To describe and forecast the market size of various segments across four key regions—North America, Europe, Asia Pacific, and RoW, in terms of value
- To forecast the size of the interactive kiosk market, in terms of volume
- To provide detailed information regarding the drivers, restraints, opportunities, and challenges influencing the growth of the interactive kiosk market
- To analyze the interactive kiosk value chain and ecosystem, along with the average selling price of interactive kiosks
- To strategically analyze the regulatory landscape, standards, patents, Porter’s five forces, import and export scenarios, AI/Gen AI impact, trade values, the 2025 US tariff, and case studies pertaining to the market under study
- To strategically analyze micromarkets with regard to individual growth trends, prospects, and contributions to the overall market
- To analyze opportunities in the market for stakeholders by identifying high-growth segments
- To provide details of the competitive landscape for market leaders
- To provide details related to the macroeconomic outlook for regions covered under the study
- To analyze growth strategies, such as product launches, partnerships, contracts, collaborations, acquisitions, and expansions, adopted by players in the interactive kiosk market
- To profile key players in the interactive kiosk market and comprehensively analyze their market ranking based on their revenue, market share, and core competencies
Customization Options
With the given market data, MarketsandMarkets offers customizations according to the company’s specific needs. The following customization options are available for the report:
Company Information:
- Detailed analysis and profiling of additional market players (up to five)
Key Questions Addressed by the Report
What is the projected size of the Interactive Kiosk Market by 2030?
The Interactive Kiosk Market is projected to reach USD 35.65 billion by 2030, growing from USD 21.85 billion in 2025.
What is the expected CAGR of the Interactive Kiosk Market?
The market is expected to grow at a CAGR of 10.3% during the forecast period from 2025 to 2030.
What are the key growth drivers of the Interactive Kiosk Market?
Rising demand for self-service solutions, growing adoption of contactless payments, digital transformation initiatives, and increasing customer engagement requirements are major growth drivers.
Which industries are the largest adopters of interactive kiosks?
Retail, hospitality, transportation, banking, healthcare, and government sectors are among the largest adopters of interactive kiosk solutions.
What are the latest trends shaping the Interactive Kiosk Market?
Key trends include AI-powered personalization, cloud-based kiosk management, biometric authentication, digital signage integration, and contactless payment technologies.
Which region is expected to witness the fastest growth in the Interactive Kiosk Market?
Asia Pacific is projected to register the highest growth rate due to rapid digitalization, smart city initiatives, and expanding retail and transportation infrastructure.
Which companies are leading the Interactive Kiosk Market?
Major players include NCR Voyix Corporation, Diebold Nixdorf, Incorporated, Zebra Technologies Corp., Advantech Co., Ltd., and Glory Ltd..
Which kiosk segment is growing the fastest?
Healthcare service kiosks are expected to witness the highest growth rate among kiosk types due to increasing digitization in healthcare facilities.
How is AI influencing the Interactive Kiosk Industry?
AI enhances kiosk functionality through personalized recommendations, intelligent customer support, predictive analytics, facial recognition, and automated service delivery.
What does an Interactive Kiosk Market report typically analyze?
The report analyzes market size, growth forecasts, technology trends, regional outlook, competitive landscape, company rankings, growth drivers, challenges, opportunities, and industry developments.
Need a Tailored Report?
Customize this report to your needs
Get 10% FREE Customization
Customize This ReportPersonalize This Research
- Triangulate with your Own Data
- Get Data as per your Format and Definition
- Gain a Deeper Dive on a Specific Application, Geography, Customer or Competitor
- Any level of Personalization
Let Us Help You
- What are the Known and Unknown Adjacencies Impacting the Interactive Kiosk Market
- What will your New Revenue Sources be?
- Who will be your Top Customer; what will make them switch?
- Defend your Market Share or Win Competitors
- Get a Scorecard for Target Partners

Custom Market Research Services
We Will Customise The Research For You, In Case The Report Listed Above Does Not Meet With Your Requirements
Get 10% Free CustomisationTESTIMONIALS

Tetsuya Ohhira
Business Development Manager-Technology Business
Nikon Corporation,
Leading Japanese MNC specializing in optics and imaging productswww.nikon.com
MarketsandMarkets™ response
is quick. Their attitude is flexible and positive. Analyst Insights are globally considered and
significant. Client Services quickly respond to our inquiry and demand. Their wide range of global
surveys help us make our strategic plan.
We hope Knowledge Store will be easier to search
for a report.
VP - Marketing & Business Development
Leading Provider of Process Control Solutions
We engaged with MarketsandMarkets on a study to perform an analysis and recommend a Go-To-Market strategy for metrology and process control in the semiconductor market. The study was tailored to our targets and needs with well-defined milestones. Our overall experience with the MarketsandMarkets team was very good throughout the project in all aspects including the analysis methodologies used, the quality and depth of primary and secondary data sets, the professionalism and flexibility of the team and the ability to meet the target schedule and milestones. We want to thank MarketsandMarkets team for a job well done.
Growth opportunities and latent adjacency in Interactive Kiosk Market


Michael
Apr, 2022
looking for Kiosk and SCO market report and information. .