The study involved four major activities in estimating the current size of the retail automation market. Exhaustive secondary research was done to collect information on the market, peer, and parent markets. The next step was to validate these findings, assumptions, and sizing with industry experts across the value chain through primary research. Both top-down and bottom-up approaches were employed to estimate the complete market size. After that, market breakdown and data triangulation were used to estimate the market size of segments and subsegments.
Secondary Research
Various secondary sources have been referred to in the secondary research process for identifying and collecting information important for this study. The secondary sources include annual reports, press releases, and investor presentations of companies; white papers; journals and certified publications; and articles from recognized authors, websites, directories, and databases. Secondary research has been conducted to obtain key information about the industry’s supply chain, the market’s value chain, the total pool of key players, market segmentation according to the industry trends (to the bottom-most level), regional markets, and key developments from market- and technology-oriented perspectives. The secondary data has been collected and analyzed to determine the overall market size, further validated by primary research.
List of major secondary sources
|
Sources
|
Web Link
|
|
Kiosk Association
|
https://kma.global/
|
|
Kiosk Industry
|
https://kioskindustry.org/kiosk-about/
|
|
Kiosk Marketplace
|
https://www.kioskmarketplace.com/
|
|
IEEE
|
https://www.ieee.org/
|
|
RAIN RFID
|
https://rainrfid.org/
|
|
International RFID Business Association
|
https://www.rfidba.org/
|
|
Association of Healthcare Providers
|
https://www.ahpi.in/
|
|
RFID Journal
|
https://www.rfidjournal.com/blog
|
Primary Research
Extensive primary research was conducted after gaining knowledge about the current scenario of the retail automation market through secondary research. Several primary interviews were conducted with experts from both the demand and supply sides across four major regions—North America, Europe, Asia Pacific and RoW. This primary data was collected through questionnaires, emails, and telephonic interviews.

To know about the assumptions considered for the study, download the pdf brochure
Market Size Estimation
In the complete market engineering process, both top-down and bottom-up approaches have been used, along with several data triangulation methods, to perform market estimation and forecasting for the overall market segments and subsegments listed in this report. Key players in the market have been identified through secondary research, and their market shares in the respective regions have been determined through primary and secondary research. This entire procedure includes the study of annual and financial reports of the top market players and extensive interviews for key insights (quantitative and qualitative) with industry experts (CEOs, VPs, directors, and marketing executives).
All percentage shares, splits, and breakdowns have been determined using secondary sources and verified through primary sources. All the parameters affecting the markets covered in this research study have been accounted for, viewed in detail, verified through primary research, and analyzed to obtain the final quantitative and qualitative data. This data has been consolidated and supplemented with detailed inputs and analysis from MarketsandMarkets and presented in this report. The following figure represents this study’s overall market size estimation process.
Bottom-Up Approach
-
Identifying entities by product type in the value chain influencing the entire retail automation industry
-
Analyzing each entity along with related major companies by product type for implementation type
-
Estimating the market for retail automation end users
-
Tracking ongoing and upcoming implementation of retail automation market developments by various companies and forecasting the market based on developments and other critical parameters
-
Arriving at the market size by analyzing retail automation companies based on countries and then combining it to get the market estimate by region
-
Verifying estimates and crosschecking them through a discussion with key opinion leaders, including C-level Executives, directors, and operation managers

Top-Down Approach
-
Focusing initially on topline investments by market players in the retail automation ecosystem
-
Calculating the market size based on the revenue generated by market players through the sales of retail automation products
-
Mapping the use of different product type in different end user and implementation types
-
Building and developing the information related to the revenue generated by market players through key products
-
Estimating the geographic split using secondary sources considering factors, such as the number of players in a specific country and region, the role of major players in the development of innovative products, and adoption and penetration rates in a particular country for various segments

Data Triangulation
After arriving at the overall market size from the market size estimation process explained in the previous section, the total market was split into several segments and subsegments. Data triangulation procedure was employed, wherever applicable, to complete the overall market engineering process and arrive at the exact statistics for all segments and subsegments. The data was triangulated by studying various factors and trends from the demand and supply sides, and the market size was validated using top-down and bottom-up approaches.
Market Definition
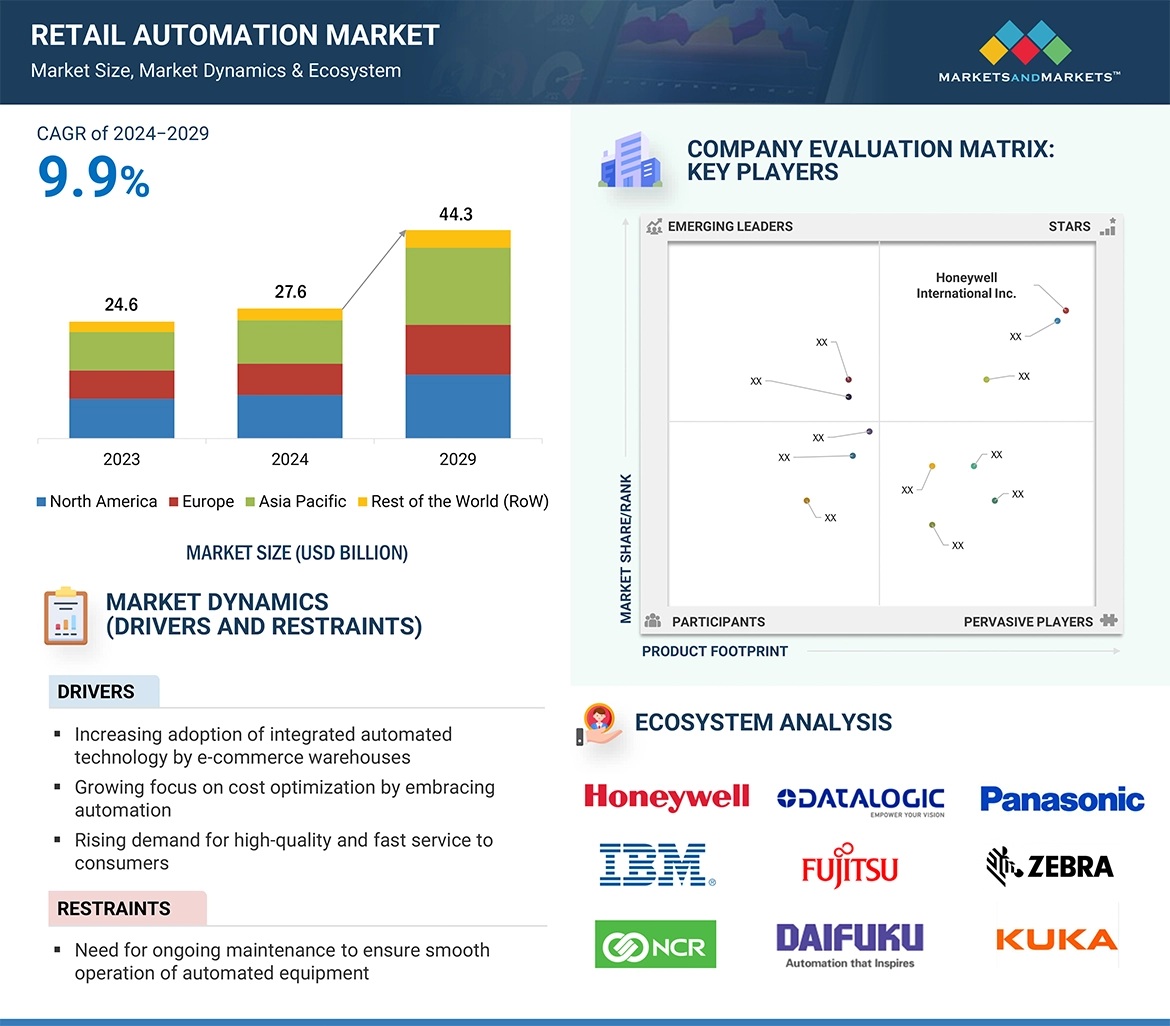
Retail automation refers to the use of automation technologies and processes across various facets of retail operations. The multiple benefits associated with retail automation include real-time information flow across the critical systems that perform traditional transaction functions at point-of-sale (PoS) terminals; improved customer service with interactive kiosks and self-checkout systems; and efficient store management with loss prevention and out-of-stock control, among others. Retail automation solutions are used by various end users, such as hypermarkets, supermarkets, non-food retail stores, and specialty stores.
Key Stakeholders
-
Original equipment manufacturers (OEMs)
-
Semiconductor component manufacturers and distributors
-
Technology consultants and system integrators
-
Equipment distributors and suppliers
-
Related accessories suppliers for retail automation
-
Standard device and technology suppliers to system integrators
-
Research organizations and consulting companies
-
Government bodies such as regulating authorities and policymakers
-
Venture capitalists and private equity firms
-
Associations, organizations, and alliances related to retail automation
Report Objectives
-
To describe and forecast the retail automation market, by product type, implementation type, and end user, in terms of value
-
To forecast the market size for various segments concerning four key regions, namely, North America, Europe, Asia Pacific, and Rest of the World (RoW), in terms of value
-
To provide detailed information regarding the major factors influencing the market growth (drivers, restraints, opportunities, and challenges).
-
To forecast the size of the robots deployed in the retail automation market, by type, in terms of volume
-
To strategically analyze micromarkets1 for individual growth trends, prospects, and contributions to the total market
-
To analyze market opportunities for stakeholders by identifying well-developed segments of the retail automation market
-
To strategically analyze the ecosystem, regulatory landscape, patent landscape, Porter’s five forces, import and export scenarios, tariff analysis, and case studies pertaining to the market under study
-
To strategically profile the key players and comprehensively analyze their market position as per ranking and core competencies2, along with detailing the competitive landscape for market leaders
-
To analyze strategic developments, such as product launches, related developments, acquisitions, expansions, and agreements, in the market
Customization Options
With the given market data, MarketsandMarkets offers customizations according to the company’s specific needs. The following customization options are available for the report:
Company Information
-
Detailed analysis and profiling of additional market players (up to five)
Geographic Analysis
-
Further breakdown of regions into respective countries


Aviv
Apr, 2017
Can we purchase just the oil and gas (section 8,3) in the "Retail Automation Market by Product Type" report?.
Kevin
Apr, 2015
Does the Market sizing by geography of retail automation market include a breakdown by country? We are specifically interested in the market size for USA..
Matt
Apr, 2015
Can you provide a sample for Retail Automation Market by Product Type (Physical Electronic POS and Unattended Terminal), Industry Vertical (Food/Non-food, Oil & Gas, Transport & Logistics, Healthcare & Personal Care, and Hospitality), & Geography - Analysis & Forecast to 2014 - 2020.
Elizabeth
Jul, 2015
Does the Retail Automation report itself cost $4650 or is that a license to view all the reports? We'd likely only be interested in the singular report..
Susheem
Aug, 2014
I am interested in purchasing Retail Automation report. In order to do so, I need a completed W-9 form. Please contact me via e-mail and we can discuss..
Chiyo
Jan, 2016
I am interested in the European and EMEA POS terminal market as well as the electronic cash registers..
Shari
Dec, 2015
What details could one expect to receive for section 7.2.2.1 � Kiosks/Vending Machines? How many pages worth of data are dedicated to this market?.
Nash
Nov, 2013
We are interested in the size of the ESL market, specifically as it relates to the retail markets in Europe and the US. It appears this report classifies ESLs with Supply Chain products rather than POS. We want to confirm we would be able to quantify the market size for the digital price tag used on the shelves of grocery stores/ retail shops / pharmacies..
matt
Oct, 2015
What are 'unattended terminals" in your report? Are these thin client "dumb" terminals? We are may be interested in buying Section 7 Retail Automation by Product Type. If we do, we want more historical data. Is there data for before 2013? How far back can you go?.
G
Sep, 2015
We are looking to buy Retail Automation Market by Product Type (Physical Electronic POS and Unattended Terminal), Industry Vertical (Food/Non-food, Oil & Gas, Transport & Logistics, Healthcare & Personal Care, and Hospitality), & Geography - Analysis & Forecast to 2014 - 2020.
Jane
Jun, 2015
We are looking for POS OEM(terminal and mPOS) market share by Revenue and unit shipments. Do you have it?.