Septic Tanks Market by Material (Precast Concrete, Polymer, Fiberglass), Type (Chambered, Conventional, Drip Distribution), Size (<1000, 1000-5000, 5000-10000, <10000 Liters), Application (Residential, Commercial, Industrial), Region - Global Forecast 2027
Updated on : November 11, 2025
Septic Tanks Market
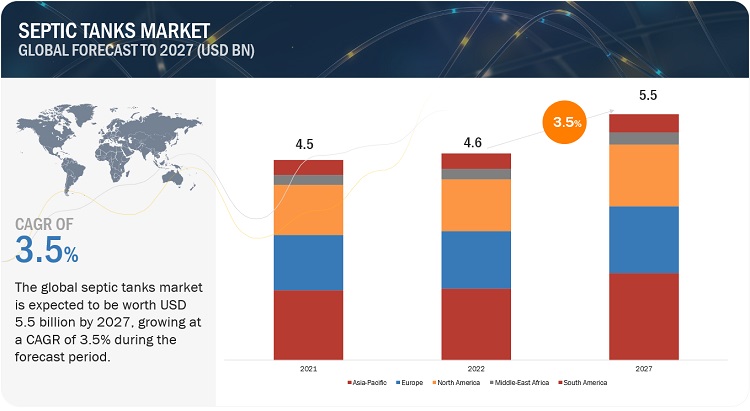
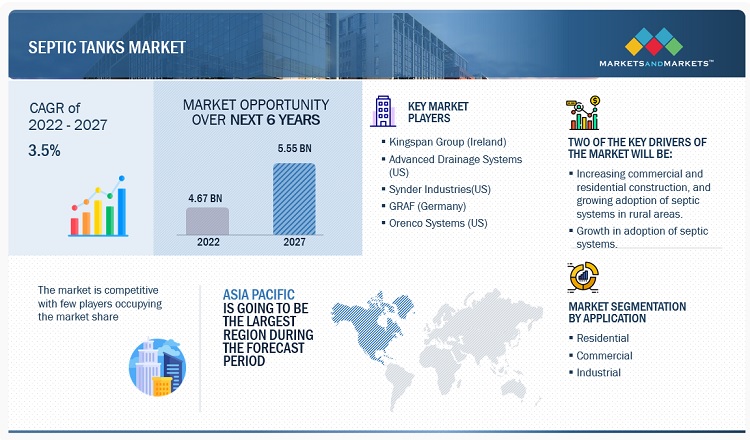
The Septic Tanks Market is projected to grow from USD 4.6 billion in 2022 to USD 5.5 billion by 2027, at a CAGR of 3.5%. Residential is one of the major end-use applications of the market and offers market growth opportunities. The polymer by raw-material segment is experiencing high growth rates in emerging regions such as Asia Pacific and North America.
Septic Tanks Market Forecast & Trends
To know about the assumptions considered for the study, Request for Free Sample Report
Attractive Opportunities in the Septic Tanks Market
Septic Tanks Market Dynamics
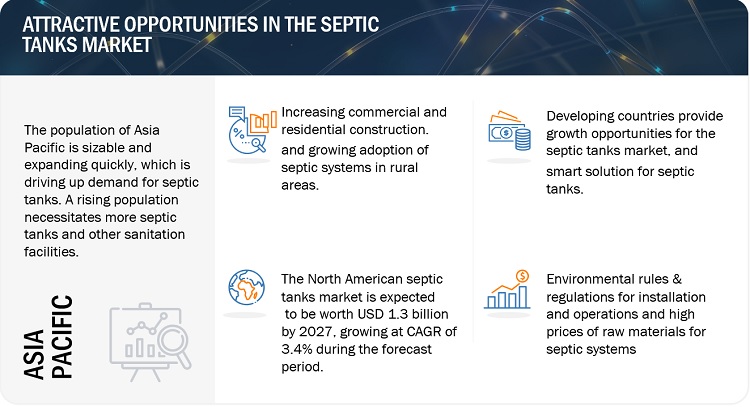
Driver: Growth in the adoption of septic systems in rural areas
Rising population, urbanization, and It is often less costly for people when they treat wastewater closer to where they are collecting it. A blog by Asian Development speaks about how women are key in rural areas when it comes to sanitation. A civil society, ‘The Vietnams Women’s Union,’ conducted campaigns and promoted the use of septic tanks in villages in Vietnam. They found that people were more likely to buy through word of mouth of a neighbor or after talking with the NPO’s women volunteers; therefore, it was found that people living near them influenced them to purchase a septic tank. In addition to that the families with women making the household decisions were shown to be the ones who were more influenced and likely to install a septic tank.
Restraint: High cost of concrete septic tanks
Concrete septic tanks’ lifespan is longer compared to plastic, but lesser than steel. Steel tanks rust quickly and thus are not used now; concrete tanks cost much more during purchase and installation compared to plastic tanks. Concrete septic tanks’ longer life span and more durability make them more expensive. Concrete tanks are bulky and heavy, thus taking longer to install and requiring heavy machinery, which also costs high. It is very important to clean and maintain the septic tank, especially concrete tanks as they form cracks with time which also costs a lot which people in rural areas might be unable to afford.
Opportunities: Smart solutions for septic systems
Septic tanks have been very technologically advanced in recent times. They have many advantages which are not there in traditional tanks. There are also eco-friendly septic tanks available that prevent pollution, which can be caused by traditional tanks. Also, smart septic tanks offer more flexibility and can also withstand natural calamities such as earthquakes. Smart tanks are also compatible with most soil types. Detecting problems was not easy in traditional septic tanks, but smart septic tanks provide real-time data and help detect problems early so repair can be scheduled. There are water level monitors available for septic tanks, which can track whether the water is too high or low in septic tanks.
Challenges: High prices of raw materials for septic systems
Using good quality raw materials is important when it comes to septic tanks. Poor design and installation, along with low-quality materials, can not only decrease the life span of septic tanks but may also cause tank failure. Modernized septic tanks are usually made of concrete, steel, fiberglass, or polyethylene. Concrete tank materials can cost much more compared to polyethylene tanks.
The cost of a concrete septic tank is from USD 700 to USD 2,000; the installation is also very expensive; overall, the total cost of a concrete tank can be much higher than other raw materials.
Septic Tanks Market Ecosystem
Prominent companies in this market include well-established, financially stable manufacturers of lignosulfonates. These companies have been operating in the market for several years and possess a diversified product portfolio and strong global sales and marketing networks. Prominent companies in this market include Kingspan Group(Ireland), Advanced Drainage Systems(US), Synder Industries(US), GRAF(Germany), and Orenco Systems(US).
The conventional septic tank segment, by type, is expected to be the largest market during the forecast period
Based on type, Conventional septic tank accounted for 60.0% market, in terms of value, in 2021. This dominance is attributed to their affordability and durability, conventional septic tanks are a popular option for residential and commercial sites. In comparison to other forms of on-site wastewater treatment systems, they are often less expensive to build and maintain.
Based on application, the residential segment accounts for the largest share of the overall market
Based on application, The majority of the market share for septic tanks industry is held by the residential market, which is also the biggest market segment. This is because more people are looking for effective wastewater treatment options, which has increased demand for septic tanks in domestic properties. However, there are numerous industrial and business uses for septic tanks as well, with commercial uses being the most significant.
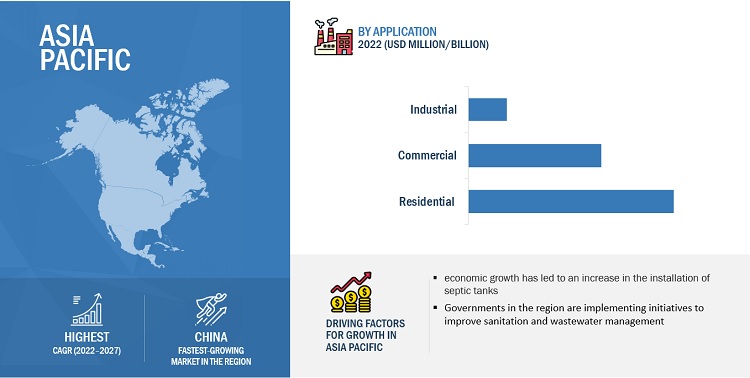
Asia Pacific is expected to account for the largest share of the global market during the forecast period.
Based on the region, Asia Pacific accounts for the largest share. The demand for septic tanks is increasing in various applications in the Asia Pacific such as residential, commercial, and industrial. Asia Pacific is also one of the major exporters of wastewater treatment. China, Japan, and India hold the major share of the Asia-Pacific septic tank market.
To know about the assumptions considered for the study, download the pdf brochure
Septic Tanks Market Players
The Septic tanks market is dominated by a few major players that have a wide regional presence. The key players in the Septic tanks industry are Kingspan Group(Ireland), Advanced Drainage systems(US), Synder Industries(US), GRAF(Germany), Orenco Systems(US), and Norwesco, Inc (US), CHEM-TAINER INDUSTRIES(US), Wieser Concrete(US), SIMOP(France), Oldcastle Infrastructure, Inc.(USA). In the last few years, the companies have adopted growth strategies such as Acquisitions and expansions to capture a larger share of the Septic tanks market.
Read More: Septic Tanks Companies
Septic Tanks Market Report Scope
|
Report Metric |
Details |
|
Market Size Value in 2022 |
USD 4.6 billion |
|
Revenue Forecast in 2027 |
USD 5.5 billion |
|
CAGR |
3.5% |
|
Years considered for the study |
2018-2027 |
|
Base Year |
2021 |
|
Forecast period |
2022–2027 |
|
Units considered |
Value (USD Million/Billion) |
|
Segments |
Type, Size, Material, Application, and Region |
|
Regions |
Asia Pacific, North America, Europe, Middle East & Africa, and South America |
|
Companies |
Kingspan Group (Ireland), Synder Industries(US), Advanced Drainage Systems (US), GRAF (Germany), Orenco Systems (US), Norwesco (US), Chem-Tainer Industries (US), Wieser Concrete Products (US), SIMOP (France), Old Castle Precast (US). |
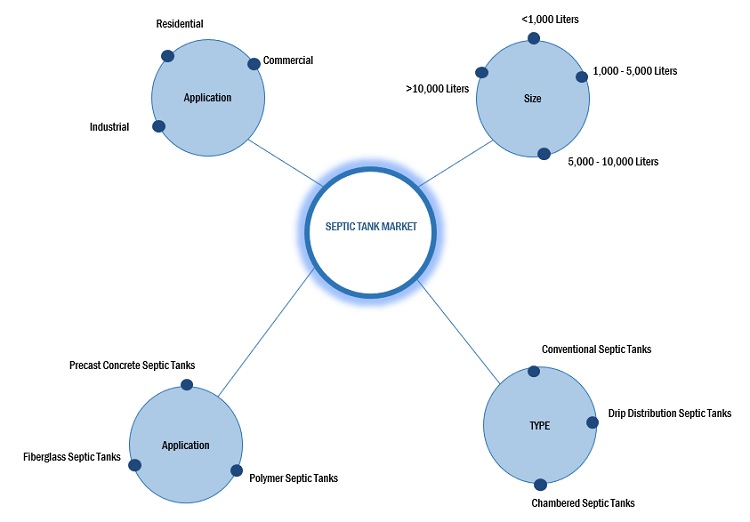
This report categorizes the global septic tanks market based on type, material, size, application, and region.
Based on By Type, the septic tanks market has been segmented as follows:
- Conventional Septic Tanks
- Drip Distribution Septic Tanks
- Chambered Septic Tanks
- Others
Based on By Material, the septic tanks market has been segmented as follows:
Based on Application, the septic tanks market has been segmented as follows:
- Residential
- Commercial
- Industrial
Based on By Size, the septic tanks market has been segmented as follows:
- <1,000 liters
- 1,000 -5,000 liters
- 5,000 – 10,000 liters
- >10,000 liters
Based on the Region, the septic tanks market has been segmented as follows:
- North America
- Asia Pacific
- Europe
- Middle East & Africa
- South America
Recent Developments
- Kingspan Group(Ireland) acquired Ondura group in september 2022 ,which is a business of a global scale focusing on waterproofing solutions with 70% of its refurbishment market.
- In September 2021 Kingspan Group (Ireland) acquired Derbigum, a Belgium-based company with having presence across Europe. It has a patented technology for collecting and recycling cut-offs and production waste, and old roofs, which are then fully recycled.
- In May 2018 GRAF(Germany) acquired Karcher, a German manufracturer of rainwater harvesting systems and wastewater treatment solutions, which expands its water storage and management products.
- In October 2016, GRAF(Germany) announced a partnership with Norwegian company Wavin, a manufracturer of plastic pipes, which focuses on providing sustainable and efficient solutions for rainwater harvesting and stormwater management.
Frequently Asked Questions (FAQ):
What is the current size of the Septic tanks market?
The current market size of the global Septic tanks market is 4.5 Billion in 2021.
What are the major drivers for the Septic tanks market?
Increasing commercial and residential Construction, and growing adoption of septic systems in rural areas.
Which is the fastest-growing region during the forecasted period in the Septic tanks market?
Asia Pacific is expected to be the fastest-growing region for the global Septic tanks market between 2022–2027. increase, urbanization, insufficient centralized sewage infrastructure, government initiatives, and economic growth, are likely to boost the demand for the Septic tanks market. The countries included are China, Japan, India, and South Korea.
Which is the fastest-growing segment, by type during the forecasted period in the Septic tanks market?
By type, the Septic tanks market has been segmented into conventional septic tank, drip distribution septic tank, chamber septic tank, and others. Conventional septic tanks are easily available and cost effective.
Which is the fastest growing segment by raw material during the forecasted period in the septic tanks market?
By raw material septic tanks market has been segmented into polymer, precast concrete, fiberglass. polymer have the highest market share in the septic tanks market. .
To speak to our analyst for a discussion on the above findings, click Speak to Analyst


- 5.1 INTRODUCTION
-
5.2 MARKET DYNAMICSDRIVERS- Increase in commercial and residential construction- Growth in adoption of septic systems in rural areasRESTRAINTS- High cost of precast concrete septic tanksOPPORTUNITIES- Need for safe disposal of wastewater in emerging economies- Smart solutions for septic systemsCHALLENGES- Environmental rules & regulations for installation and operations- High prices of raw materials for septic systems
-
5.3 PORTER’S FIVE FORCES ANALYSISTHREAT OF NEW ENTRANTSTHREATS OF SUBSTITUTESBARGAINING POWER OF SUPPLIERSBARGAINING POWER OF BUYERSINTENSITY OF COMPETITIVE RIVALRY
- 6.1 COVID-19 IMPACT
- 6.2 AVERAGE PRICE ANALYSIS, BY REGION
-
6.3 VALUE CHAIN ANALYSISRAW MATERIAL AND COMPONENT SUPPLIERSSUPPLIERS OF OTHER COMPONENTS- Gravel- Sand- Septic tank risers- Drainfield fabrics- PVC piping- Pump systemsPOLYMER/PRECAST CONCRETE MANUFACTURERSTANK MANUFACTURERSDISTRIBUTORSEND USERS
-
6.4 MACROECONOMIC INDICATORSGDP TRENDS AND FORECASTS OF MAJOR ECONOMIES
-
6.5 SEPTIC TANKS MARKET REGULATIONSREGULATORY BODIES, GOVERNMENT AGENCIES, AND OTHER ORGANIZATIONS
-
6.6 TRADE ANALYSISEXPORT SCENARIOIMPORT SCENARIO
-
6.7 TRENDS/DISRUPTIONS IMPACTING CUSTOMERS’ BUSINESSES
-
6.8 KEY STAKEHOLDERS AND BUYING CRITERIAKEY STAKEHOLDERS IN BUYING PROCESSBUYING CRITERIA
-
7.1 INTRODUCTIONPOLYMER- Polymer to be largest material segmentPRECAST CONCRETE- Precast precast concrete septic tanks commonly used in commercial industryFIBERGLASS- Fiberglass septic tanks mainly used in industrial application segment
- 8.1 INTRODUCTION
-
8.2 <1,000 LITERSMARKET ALIGNMENT WITH WASTEWATER MANAGEMENT
-
8.3 1,000–5,000 LITERSGROWTH OF SMALL-SCALE INDUSTRIES
-
8.4 5,000–10,000 LITERSGROWTH OF COMMERCIAL SECTOR IN EMERGING ECONOMIES
-
8.5 >10,000 LITERSCONSUMER PREFERENCE SHIFT TOWARD MORE WATER STORAGE DUE TO WATER SCARCITY IN MIDDLE EAST
- 9.1 INTRODUCTION
-
9.2 BIODIGESTER/CONVENTIONAL SEPTIC TANKINCREASE IN WASTEWATER TREATMENT IN EMERGING COUNTRIES
-
9.3 CHAMBER SEPTIC TANKSUSED IN VARIOUS SOIL TYPES; IDEAL FOR DIVERSE GEOGRAPHY OF ASIA PACIFIC
-
9.4 DRIP DISTRIBUTION SEPTIC TANKSEFFECTIVE APPROACH TO MEET STRINGENT NORTH AMERICAN ENVIRONMENTAL STANDARDS WITH WASTEWATER TREATMENT
-
9.5 OTHER TYPESMOUND SEPTIC TANKSSAND FILTER SEPTIC TANKSEVAPOTRANSPIRATION SEPTIC TANKSBUILT WETLAND SEPTIC TANKS
- 10.1 INTRODUCTION
-
10.2 RESIDENTIALURBANIZATION AND RESTRICTED ACCESS TO CENTRALIZED SEWAGE SYSTEMS IN RESIDENTIAL SECTOR
-
10.3 COMMERCIALRISE IN DEMAND FOR WASTEWATER TREATMENT AND TIGHTENING ENVIRONMENTAL RESTRICTIONS
-
10.4 INDUSTRIALLARGE VOLUMES OF WASTEWATER GENERATED BY AGROCHEMICAL, CHEMICAL & HEALTH, AND PHARMACEUTICAL INDUSTRIES
- 11.1 INTRODUCTION
-
11.2 ASIA PACIFICRECESSION IMPACT- China- Japan- India- South Korea- Rest of Asia Pacific
-
11.3 NORTH AMERICARECESSION IMPACT- US- Canada- Mexico
-
11.4 MIDDLE EAST & AFRICARECESSION IMPACT- Saudi Arabia- South Africa- Rest of Middle East & Africa
-
11.5 EUROPERECESSION IMPACT- UK- France- Germany- Italy- Spain- Rest of Europe
-
11.6 SOUTH AMERICARECESSION IMPACT- Brazil- Peru- Argentina- Rest of South America

- 12.1 OVERVIEW
- 12.2 MARKET SHARE ANALYSIS
- 12.3 MARKET EVALUATION FRAMEWORK
-
12.4 RECENT DEVELOPMENTSDEALS
-
12.5 KEY COMPANY EVALUATION QUADRANTSTARSEMERGING LEADERSPERVASIVE PLAYERSPARTICIPANTS
-
12.6 STARTUP/SME EVALUATION QUADRANTPROGRESSIVE COMPANIESRESPONSIVE COMPANIESDYNAMIC COMPANIESSTARTING BLOCKS
-
13.1 KEY COMPANIESKINGSPAN GROUP- Business overview- Products/Solutions/Services offered- Recent developments- MnM viewSNYDER INDUSTRIES- Business overview- Products/Solutions/Services offered- Recent developments- MnM viewADVANCED DRAINAGE SYSTEMS- Business overview- Products/Solutions/Services offered- Recent developments- MnM viewGRAF- Business overview- Products/Solutions/Services offered- Recent developments- MnM viewORENCO SYSTEMS- Business overview- Products/Solutions/Services offered- MnM viewNORWESCO- Business overview- Products/Solutions/Services offered- MnM viewCHEM-TAINER INDUSTRIES- Business overview- Products/Solutions/Services offered- MnM viewWIESER PRECAST CONCRETE PRODUCTS- Business overview- Products/Services/Solutions offered- MnM viewSIMOP- Business overview- Products/Services/Solutions offered- MnM viewOLD CASTLE PRECAST- Business overview- Products/Services/Solutions offered- MnM view
-
13.2 STARTUPS/SMESCULTEC INC.APLITECWIEFFERINK B.V.NIJHUIS INDUSTRIESINNOVATIVE WATER SYSTEMSBIOMICROBICS INC.AQUACELLPOLYLOKKLARO GMBHPROTANKBIOMANPREMIER PLASTICSTRUMBULL MANUFACTURINGBIODISK ABAK INDUSTRIES
- 14.1 INSIGHTS OF INDUSTRY EXPERTS
- 14.2 DISCUSSION GUIDE
- 14.3 KNOWLEDGESTORE: MARKETSANDMARKETS SUBSCRIPTION PORTAL
- 14.4 CUSTOMIZATION OPTIONS
- 14.5 RELATED REPORTS
- 14.6 AUTHOR DETAILS
- TABLE 1 SEPTIC TANKS MARKET: SNAPSHOT
- TABLE 2 EXAMPLES OF VARIED REGULATIONS
- TABLE 3 SEPTIC TANKS: PORTER’S FIVE FORCES ANALYSIS
- TABLE 4 SEPTIC TANKS: AVERAGE PRICE TRENDS, BY REGION (USD PER UNIT)
- TABLE 5 GDP TRENDS AND FORECASTS, BY KEY COUNTRY, 2019–2027
- TABLE 6 NORTH AMERICA: LIST OF REGULATORY BODIES, GOVERNMENT AGENCIES, AND OTHER ORGANIZATIONS
- TABLE 7 EUROPE: LIST OF REGULATORY BODIES, GOVERNMENT AGENCIES, AND OTHER ORGANIZATIONS
- TABLE 8 ASIA PACIFIC: LIST OF REGULATORY BODIES, GOVERNMENT AGENCIES, AND OTHER ORGANIZATIONS
- TABLE 9 EXPORT SCENARIO FOR HS CODE: 392510, BY KEY COUNTRY, 2021 (USD MILLION)
- TABLE 10 IMPORT SCENARIO FOR HS CODE: 392510, BY KEY COUNTRY, 2021 (USD MILLION)
- TABLE 11 INFLUENCE OF INSTITUTIONAL BUYERS ON BUYING PROCESS FOR SEPTIC TANKS
- TABLE 12 KEY BUYING CRITERIA FOR THREE APPLICATIONS
- TABLE 13 SEPTIC TANKS MARKET, BY MATERIAL, 2018–2021 (USD MILLION)
- TABLE 14 SEPTIC TANKS MARKET, BY MATERIAL, 2022–2027 (USD MILLION)
- TABLE 15 SEPTIC TANKS MARKET, BY SIZE, 2018–2021 (USD MILLION)
- TABLE 16 SEPTIC TANKS MARKET, BY SIZE, 2022–2027 (USD MILLION)
- TABLE 17 SEPTIC TANKS MARKET, BY TYPE, 2018–2021 (USD MILLION)
- TABLE 18 SEPTIC TANKS MARKET, BY TYPE, 2022–2027 (USD MILLION)
- TABLE 19 SEPTIC TANKS MARKET, BY APPLICATION, 2018–2021 (USD MILLION)
- TABLE 20 SEPTIC TANKS MARKET, BY APPLICATION, 2022–2027 (USD MILLION)
- TABLE 21 SEPTIC TANKS MARKET, BY REGION, 2018–2021 (USD MILLION)
- TABLE 22 SEPTIC TANKS MARKET, BY REGION, 2022–2027 (USD MILLION)
- TABLE 23 ASIA PACIFIC: SEPTIC TANKS MARKET, BY COUNTRY, 2018–2021 (USD MILLION)
- TABLE 24 ASIA PACIFIC: SEPTIC TANKS MARKET, BY COUNTRY, 2022–2027 (USD MILLION)
- TABLE 25 ASIA PACIFIC: SEPTIC TANKS MARKET, BY APPLICATION, 2018–2021 (USD MILLION)
- TABLE 26 ASIA PACIFIC: SEPTIC TANKS MARKET, BY APPLICATION, 2022–2027 (USD MILLION)
- TABLE 27 CHINA: SEPTIC TANKS MARKET, BY APPLICATION, 2018–2021 (USD MILLION)
- TABLE 28 CHINA: SEPTIC TANKS MARKET, BY APPLICATION, 2022–2027 (USD MILLION)
- TABLE 29 JAPAN: SEPTIC TANKS MARKET, BY APPLICATION, 2018–2021 (USD MILLION)
- TABLE 30 JAPAN: SEPTIC TANKS MARKET, BY APPLICATION, 2022–2027 (USD MILLION)
- TABLE 31 INDIA: SEPTIC TANKS MARKET, BY APPLICATION, 2018–2021 (USD MILLION)
- TABLE 32 INDIA: SEPTIC TANKS MARKET, BY APPLICATION, 2022–2027 (USD MILLION)
- TABLE 33 SOUTH KOREA: SEPTIC TANKS MARKET, BY APPLICATION, 2018–2021 (USD MILLION)
- TABLE 34 SOUTH KOREA: SEPTIC TANKS MARKET, BY APPLICATION, 2022–2027 (USD MILLION)
- TABLE 35 REST OF ASIA PACIFIC: SEPTIC TANKS MARKET, BY APPLICATION, 2018–2021 (USD MILLION)
- TABLE 36 REST OF ASIA PACIFIC: SEPTIC TANKS MARKET, BY APPLICATION, 2022–2027 (USD MILLION)
- TABLE 37 NORTH AMERICA: SEPTIC TANKS MARKET, BY COUNTRY, 2018–2021 (USD MILLION)
- TABLE 38 NORTH AMERICA: SEPTIC TANKS MARKET, BY COUNTRY, 2022–2027 (USD MILLION)
- TABLE 39 NORTH AMERICA: SEPTIC TANKS MARKET, BY APPLICATION, 2018–2021 (USD MILLION)
- TABLE 40 NORTH AMERICA: SEPTIC TANKS MARKET, BY APPLICATION, 2022–2027 (USD MILLION)
- TABLE 41 US: SEPTIC TANKS MARKET, BY APPLICATION, 2018–2021 (USD MILLION)
- TABLE 42 US: SEPTIC TANKS MARKET, BY APPLICATION, 2022–2027 (USD MILLION)
- TABLE 43 US: SEPTIC TANKS MARKET, BY REGION, 2018–2021 (USD MILLION)
- TABLE 44 US: SEPTIC TANKS MARKET, BY REGION, 2022–2027 (USD MILLION)
- TABLE 45 CANADA: SEPTIC TANKS MARKET, BY APPLICATION, 2018–2021 (USD MILLION)
- TABLE 46 CANADA: SEPTIC TANKS MARKET, BY APPLICATION, 2022–2027 (USD MILLION)
- TABLE 47 MEXICO: SEPTIC TANKS MARKET, BY APPLICATION, 2018–2021 (USD MILLION)
- TABLE 48 MEXICO: SEPTIC TANKS MARKET, BY APPLICATION, 2022–2027 (USD MILLION)
- TABLE 49 MIDDLE EAST & AFRICA: SEPTIC TANKS MARKET, BY COUNTRY, 2018–2021 (USD MILLION)
- TABLE 50 MIDDLE EAST & AFRICA: SEPTIC TANKS MARKET, BY COUNTRY, 2022–2027 (USD MILLION)
- TABLE 51 MIDDLE EAST & AFRICA: SEPTIC TANKS MARKET, BY APPLICATION, 2018–2021 (USD MILLION)
- TABLE 52 MIDDLE EAST & AFRICA: SEPTIC TANKS MARKET, BY APPLICATION, 2022–2027 (USD MILLION)
- TABLE 53 SAUDI ARABIA: SEPTIC TANKS MARKET, BY APPLICATION, 2018–2021 (USD MILLION)
- TABLE 54 SAUDI ARABIA: SEPTIC TANKS MARKET, BY APPLICATION, 2022–2027 (USD MILLION)
- TABLE 55 SOUTH AFRICA: SEPTIC TANKS MARKET, BY APPLICATION, 2018–2021 (USD MILLION)
- TABLE 56 SOUTH AFRICA: SEPTIC TANKS MARKET, BY APPLICATION, 2022–2027 (USD MILLION)
- TABLE 57 REST OF MIDDLE EAST & AFRICA: SEPTIC TANKS MARKET, BY APPLICATION, 2018–2021 (USD MILLION)
- TABLE 58 REST OF MIDDLE EAST & AFRICA: SEPTIC TANKS MARKET, BY APPLICATION, 2022–2027 (USD MILLION)
- TABLE 59 EUROPE: SEPTIC TANKS MARKET, BY COUNTRY, 2018–2021 (USD MILLION)
- TABLE 60 EUROPE: SEPTIC TANKS MARKET, BY COUNTRY, 2022–2027 (USD MILLION)
- TABLE 61 EUROPE: SEPTIC TANKS MARKET, BY APPLICATION, 2018–2021 (USD MILLION)
- TABLE 62 EUROPE: SEPTIC TANKS MARKET, BY APPLICATION, 2022–2027 (USD MILLION)
- TABLE 63 UK: SEPTIC TANKS MARKET, BY APPLICATION, 2018–2021 (USD MILLION)
- TABLE 64 UK: SEPTIC TANKS MARKET, BY APPLICATION, 2022–2027 (USD MILLION)
- TABLE 65 FRANCE: SEPTIC TANKS MARKET, BY APPLICATION, 2018–2021 (USD MILLION)
- TABLE 66 FRANCE: SEPTIC TANKS MARKET, BY APPLICATION, 2022–2027 (USD MILLION)
- TABLE 67 GERMANY: SEPTIC TANKS MARKET, BY APPLICATION, 2018–2021 (USD MILLION)
- TABLE 68 GERMANY: SEPTIC TANKS MARKET, BY APPLICATION, 2022–2027 (USD MILLION)
- TABLE 69 ITALY: SEPTIC TANKS MARKET, BY APPLICATION, 2018–2021 (USD MILLION)
- TABLE 70 ITALY: SEPTIC TANKS MARKET, BY APPLICATION, 2022–2027 (USD MILLION)
- TABLE 71 SPAIN: SEPTIC TANKS MARKET, BY APPLICATION, 2018–2021 (USD MILLION)
- TABLE 72 SPAIN: SEPTIC TANKS MARKET, BY APPLICATION, 2022–2027 (USD MILLION)
- TABLE 73 REST OF EUROPE: SEPTIC TANKS MARKET, BY APPLICATION, 2018–2021 (USD MILLION)
- TABLE 74 REST OF EUROPE: SEPTIC TANKS MARKET, BY APPLICATION, 2022–2027 (USD MILLION)
- TABLE 75 SOUTH AMERICA: SEPTIC TANKS MARKET, BY COUNTRY, 2018–2021 (USD MILLION)
- TABLE 76 SOUTH AMERICA: SEPTIC TANKS MARKET, BY COUNTRY, 2022–2027 (USD MILLION)
- TABLE 77 SOUTH AMERICA: SEPTIC TANKS MARKET, BY APPLICATION, 2018–2021 (USD MILLION)
- TABLE 78 SOUTH AMERICA: SEPTIC TANKS MARKET, BY APPLICATION, 2022–2027 (USD MILLION)
- TABLE 79 BRAZIL: SEPTIC TANKS MARKET, BY APPLICATION, 2018–2021 (USD MILLION)
- TABLE 80 BRAZIL: SEPTIC TANKS MARKET, BY APPLICATION, 2022–2027 (USD MILLION)
- TABLE 81 PERU: SEPTIC TANKS MARKET, BY APPLICATION, 2018–2021 (USD MILLION)
- TABLE 82 PERU: SEPTIC TANKS MARKET, BY APPLICATION, 2022–2027 (USD MILLION)
- TABLE 83 ARGENTINA: SEPTIC TANKS MARKET, BY APPLICATION, 2018–2021 (USD MILLION)
- TABLE 84 ARGENTINA: SEPTIC TANKS MARKET, BY APPLICATION, 2022–2027 (USD MILLION)
- TABLE 85 REST OF SOUTH AMERICA: SEPTIC TANKS MARKET, BY APPLICATION, 2018–2021 (USD MILLION)
- TABLE 86 REST OF SOUTH AMERICA: SEPTIC TANKS MARKET, BY APPLICATION, 2022–2027 (USD MILLION)
- TABLE 87 REVIEW OF STRATEGIES ADOPTED BY KEY MANUFACTURERS OF SEPTIC TANKS
- TABLE 88 SEPTIC TANKS MARKET: DEGREE OF COMPETITION
- TABLE 89 MARKET EVALUATION FRAMEWORK, 2019–2022
- TABLE 90 SEPTIC TANKS MARKET: DEALS, 2018–2022
- TABLE 91 STARTUP/SME FOOTPRINT, BY TYPE
- TABLE 92 STARTUP/SME FOOTPRINT, BY APPLICATION
- TABLE 93 STARTUP/SME FOOTPRINT, BY MATERIAL
- TABLE 94 STARTUP/SME FOOTPRINT, BY REGION
- TABLE 95 KEY COMPANY FOOTPRINT, BY TYPE
- TABLE 96 KEY COMPANY FOOTPRINT, BY APPLICATION
- TABLE 97 KEY COMPANY FOOTPRINT, BY MATERIAL
- TABLE 98 KEY COMPANY FOOTPRINT, BY REGION
- TABLE 99 KINGSPAN GROUP: COMPANY OVERVIEW
- TABLE 100 KINGSPAN GROUP: PRODUCTS OFFERED
- TABLE 101 KINGSPAN GROUP: DEALS
- TABLE 102 SNYDER INDUSTRIES: COMPANY OVERVIEW
- TABLE 103 SNYDER INDUSTRIES: PRODUCTS OFFERED
- TABLE 104 SNYDER INDUSTRIES: DEALS
- TABLE 105 ADVANCED DRAINAGE SYSTEMS: COMPANY OVERVIEW
- TABLE 106 ADVANCED DRAINAGE SYSTEMS: PRODUCTS OFFERED
- TABLE 107 ADVANCED DRAINAGE SYSTEMS: DEALS
- TABLE 108 GRAF: COMPANY OVERVIEW
- TABLE 109 GRAF: PRODUCTS OFFERED
- TABLE 110 GRAF: DEALS
- TABLE 111 ORENCO SYSTEMS: COMPANY OVERVIEW
- TABLE 112 ORENCO SYSTEMS: PRODUCTS OFFERED
- TABLE 113 NORWESCO: COMPANY OVERVIEW
- TABLE 114 NORWESCO: PRODUCTS OFFERED
- TABLE 115 CHEM-TAINER INDUSTRIES: COMPANY OVERVIEW
- TABLE 116 CHEM-TAINER INDUSTRIES: PRODUCTS OFFERED
- TABLE 117 WIESER PRECAST CONCRETE PRODUCTS: COMPANY OVERVIEW
- TABLE 118 WIESER PRECAST CONCRETE PRODUCTS: PRODUCTS OFFERED
- TABLE 119 SIMOP: COMPANY OVERVIEW
- TABLE 120 SIMOP: PRODUCTS OFFERED
- TABLE 121 OLD CASTLE PRECAST: COMPANY OVERVIEW
- TABLE 122 OLDCASTLE PRECAST: PRODUCTS OFFERED
- FIGURE 1 SEPTIC TANKS MARKET: RESEARCH DESIGN
- FIGURE 2 KEY INDUSTRY INSIGHTS
- FIGURE 3 BREAKDOWN OF PRIMARY INTERVIEWS: BY COMPANY TYPE, DESIGNATION, AND REGION
- FIGURE 4 DATA TRIANGULATION
- FIGURE 5 MARKET SIZE ESTIMATION METHODOLOGY: BOTTOM-UP APPROACH
- FIGURE 6 MARKET SIZE ESTIMATION METHODOLOGY: TOP-DOWN APPROACH
- FIGURE 7 DEMAND-SIDE CALCULATION
- FIGURE 8 METRICS CONSIDERED FOR ANALYZING AND ASSESSING DEMAND FOR SEPTIC TANKS
- FIGURE 9 NORTH AMERICA TO LEAD MARKET IN 2022
- FIGURE 10 CONVENTIONAL SYSTEMS TO ACCOUNT FOR LARGEST SHARE DURING FORECAST PERIOD
- FIGURE 11 RESIDENTIAL APPLICATION TO ACCOUNT FOR LARGEST SHARE DURING FORECAST PERIOD
- FIGURE 12 POLYMER SEPTIC TANKS TO ACCOUNT FOR LARGEST SHARE THROUGH 2027
- FIGURE 13 1,000–5,000-LITER TANKS TO ACCOUNT FOR LARGEST SHARE BY 2027
- FIGURE 14 HIGHER DEMAND FOR STORAGE TANKS DUE TO WATER SHORTAGE TO DRIVE MARKET DURING FORECAST PERIOD
- FIGURE 15 ASIA PACIFIC TO GROW AT HIGHEST CAGR DURING FORECAST PERIOD
- FIGURE 16 CONVENTIONAL SEPTIC SYSTEMS TO ACCOUNT FOR LARGEST SHARE BY 2027
- FIGURE 17 RESIDENTIAL APPLICATIONS ACCOUNTED FOR LARGEST SHARE IN 2021
- FIGURE 18 1,000–5,000-LITER SIZE ACCOUNTED FOR LARGEST SHARE IN 2022
- FIGURE 19 RESIDENTIAL AND CHINA ACCOUNTED FOR SIGNIFICANT SHARES IN 2022
- FIGURE 20 DRIVERS, RESTRAINTS, OPPORTUNITIES, AND CHALLENGES: SEPTIC TANKS MARKET
- FIGURE 21 PORTER’S FIVE FORCES ANALYSIS
- FIGURE 22 VALUE CHAIN FOR SEPTIC TANKS
- FIGURE 23 REVENUE SHIFT OF SEPTIC TANK PROVIDERS
- FIGURE 24 INFLUENCE OF STAKEHOLDERS ON BUYING PROCESS FOR SEPTIC TANKS
- FIGURE 25 KEY BUYING CRITERIA FOR SEPTIC TANKS
- FIGURE 26 POLYMER TANKS TO ACCOUNT FOR LARGEST MARKET SHARE DURING FORECAST PERIOD
- FIGURE 27 1,000–5,000 LITER TANK SIZE TO ACCOUNT FOR LARGEST MARKET SHARE DURING FORECAST PERIOD
- FIGURE 28 CONVENTIONAL SEPTIC TANKS TO ACCOUNT FOR LARGEST MARKET SHARE DURING FORECAST PERIOD
- FIGURE 29 COMMERCIAL APPLICATIONS TO BE LARGEST DURING FORECAST PERIOD
- FIGURE 30 ASIA PACIFIC TO BE FASTEST-GROWING MARKET DURING FORECAST PERIOD
- FIGURE 31 ASIA PACIFIC: SEPTIC TANKS MARKET SNAPSHOT
- FIGURE 32 NORTH AMERICA: SEPTIC TANKS MARKET SNAPSHOT
- FIGURE 33 EUROPE: SEPTIC TANKS MARKET SNAPSHOT
- FIGURE 34 MARKET SHARE ANALYSIS OF TOP FIVE PLAYERS IN SEPTIC TANKS MARKET, 2021
- FIGURE 35 MARKET SHARE ANALYSIS, 2021
- FIGURE 36 EVALUATION QUADRANT FOR KEY PLAYERS, 2021
- FIGURE 37 EVALUATION QUADRANT FOR STARTUPS/SMES, 2021
- FIGURE 38 KINGSPAN GROUP: COMPANY SNAPSHOT
- FIGURE 39 ADVANCED DRAINAGE SYSTEMS: COMPANY SNAPSHOT
The study involved four major activities in estimating the market size of the septic tanks market. Exhaustive secondary research was done to collect information on the market, the peer market, and the parent market. The next step was to validate these findings, assumptions, and sizing with industry experts across the value chain through primary research. Both top-down and bottom-up approaches were employed to estimate the complete market size. Thereafter, the market breakdown and data triangulation procedures were used to estimate the market size of the segments and subsegments.
Secondary Research
In the secondary research process, various secondary sources have been referred to for identifying and collecting information for this study. These secondary sources include annual reports, press releases, investor presentations of companies, white papers, certified publications, trade directories, certified publications, articles from recognized authors, gold standard and silver standard websites, and databases.
Secondary research has been used to obtain key information about the value chain of the industry, monetary chain of the market, the total pool of key players, market classification and segmentation according to industry trends to the bottom-most level, and regional markets. It was also used to obtain information about the key developments from a market-oriented perspective.
Primary Research
The septic tanks market comprises several stakeholders in the value chain, which include raw material suppliers, manufacturers, and end users. Various primary sources from the supply and demand sides of the septic tank industry have been interviewed to obtain qualitative and quantitative information. The primary interviewees from the demand side include key opinion leaders in end-use sectors. The primary sources from the supply side include manufacturers, associations, and institutions involved in the septic tanks industry.
Primary interviews were conducted to gather insights such as market statistics, data of revenue collected from the products and services, market breakdowns, market size estimations, market forecasting, and data triangulation. Primary research also helped in understanding the various trends related to septic tank types, materials, size, applications, and region. Stakeholders from the demand side, such as CIOs, CTOs, and CSOs were interviewed to understand the buyer’s perspective on the suppliers, products, component providers, and their current usage of septic tanks and future outlook of their business which will affect the overall market.
The breakdown of profiles of the primary interviewees is illustrated in the figure below:
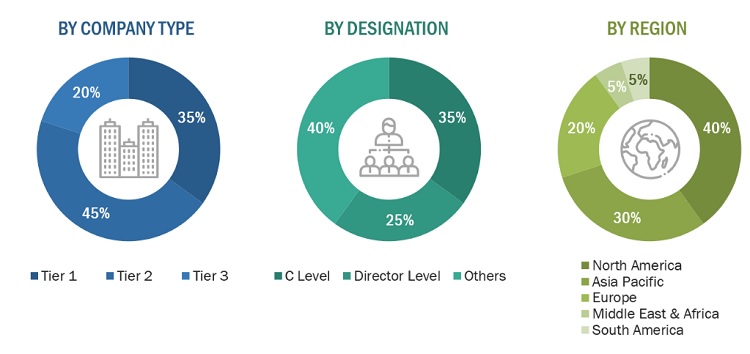
Note: Tier 1, Tier 2, and Tier 3 companies are classified based on their market revenue in 2021 available in the public domain, product portfolios, and geographical presence.
Other designations include consultants and sales, marketing, and procurement managers.
To know about the assumptions considered for the study, download the pdf brochure
|
Company Name |
Designation |
|
Kingspan Group (Ireland) |
Regional Head |
|
Synder Industries(US) |
Sales Manager |
|
Advanced Drainage Systems (US) |
Director |
|
GRAF (Germany) |
Marketing Manager |
|
Orenco Systems (US) |
R&D Manager |
|
|
|
Market Size Estimation
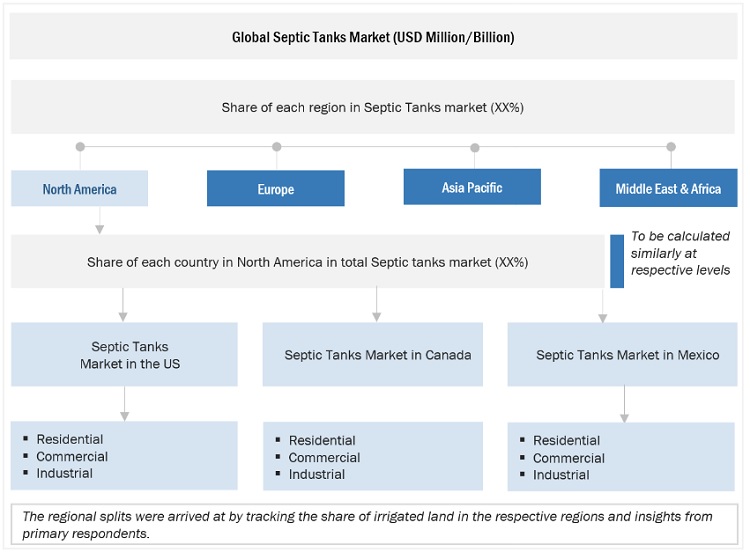
The top-down and bottom-up approaches have been used to estimate and validate the size of the septic tanks market.
- The key players in the industry have been identified through extensive secondary research.
- The supply chain of the industry has been determined through primary and secondary research.
- All percentage shares, splits, and breakdowns have been determined using secondary sources and verified through primary sources.
- All possible parameters that affect the markets covered in this research study have been accounted for, viewed in extensive detail, verified through primary research, and analyzed to obtain the final quantitative and qualitative data.
- The research includes the study of reports, reviews, and newsletters of the key market players, along with extensive interviews for opinions with leaders such as directors and marketing executives.
Tpu Market: Bottum-Up Approach
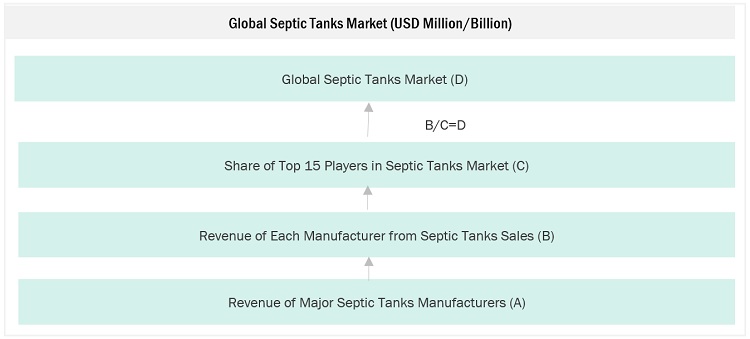
Note: All the shares are based on the global market size.
Source: Secondary Research, Interviews with Experts, and MarketsandMarkets Analysis
To know about the assumptions considered for the study, Request for Free Sample Report
Septic Tanks Market: Top-Down Approach
Data Triangulation
After arriving at the total market size from the estimation process explained above, the overall market has been split into several segments and sub-segments. To complete the overall market engineering process and arrive at the exact statistics for all the segments and sub-segments, the data triangulation and market breakdown procedures have been employed, wherever applicable. The data has been triangulated by studying various factors and trends from both the demand and supply sides. Along with this, the market size has been validated by using both the top-down and bottom-up approaches and primary interviews. Hence, for every data segment, there have been three sources—top-down approach, bottom-up approach, and expert interviews. The data was assumed correct when the values arrived from the three sources matched.
Market Definition
A septic tank is a concrete, fiberglass, or plastic underground container used for the treatment of residential wastewater. It is most common in rural areas or in homes that are not connected to a municipal sewer system. The septic tank is intended to separate solid waste from liquid waste, allowing the liquid to drain into a drain field for further treatment by the soil.
Key Stakeholders
- Senior Management
- End User
- Finance/Procurement Department
- R&D Department
Report Objectives
- To define and describe the septic tanks market based on type, size, material, and application, in terms of value.
- To provide detailed information on the major factors influencing the growth of the market (drivers, restraints, opportunities, and challenges)
- To estimate the market size in terms of value.
- To strategically analyze micromarkets1 with respect to individual growth trends, future expansions, and their contributions to the overall septic tanks market.
- To provide post-pandemic estimation for the septic tanks industry and analyze the impact of the pandemic on market growth.
- To analyze market opportunities for stakeholders and the competitive landscape for market leaders.
- To forecast the growth of the septic tanks market with respect to five key regions: North America, Europe, Asia Pacific, South America, and the Middle East & Africa, along with their key countries.
- To strategically profile the key players and comprehensively analyze their core competencies2.
- To analyze competitive developments, such as investments & expansions, mergers & acquisitions, product launches, contracts & agreements, and joint ventures & collaborations in the septic tanks market
Available Customizations
Along with the given market data, MarketsandMarkets offers customizations according to the company’s specific needs. The following customization options are available for the report:
Regional Analysis
- Further breakdown of a region with respect to a particular country or additional application
Company Information
- Detailed analysis and profiles of additional market players


 Generating Response ...


Growth opportunities and latent adjacency in Septic Tanks Market