Small Gas Engines Market by Equipment (Lawnmower, Chainsaw, String Trimmer, Hedge Trimmer, Portable Generator), Displacement (20-100cc, 101-400cc, 401-650cc), End-User (Gardening, Industrial, Construction), Region - Global Forecast to 2028
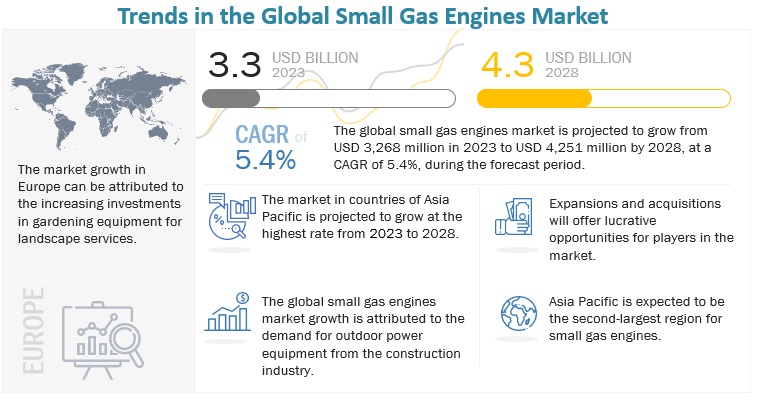
The global small gas engines market in terms of revenue was estimated to be worth USD 3.3 billion in 2023 and is poised to reach USD 4.3 billion by 2028, growing at a CAGR of 5.4% from 2023 to 2028.
The small gas engine market has promising growth potential due to the rising deployment of lawn mowers.
To know about the assumptions considered for the study, Request for Free Sample Report
Small Gas Engines Market Trends
To know about the assumptions considered for the study, download the pdf brochure
Small Gas Engines Market Dynamics
Driver: Rising Demand for outdoor power equipment
Outdoor power equipment is sold to commercial landscapers, rental yards, and institutions such as colleges and hospitals. The small gas engines market is mainly driven by the growing demand for outdoor equipment by homeowners for landscaping services. In the landscape industry, a wide range of outdoor power equipment such as lawn mowers, hedge trimmers, blowers, and saws are used in landscaping activities that include lawn maintenance, hardscaping, tree care lawn renovation, and snow removal. The manufacturing of these equipment has increased the demand for small gas engines.
Restraints: Stricter Co2 emissions regulations
According to the International Energy Agency, the global economy is assumed to grow by about 3% on average by 2050. Economies will require an increasingly higher amount of energy to sustain their economic growth. Energy demand, as a result, is expected to swell. According to the International Energy Agency 2020 World Energy Outlook, the global energy demand will increase by 27% by 2040. This demand, combined with the growing awareness of global warming, has shifted the focus to clean, cost-effective, and efficient energy generation. Governments and environmental agencies have implemented various regulations and limits for greenhouse gas emissions. For instance, the UAE pledged to limit emissions and increase the share of clean energy in the energy mix to 24% by 2021, up from 0.2% in 2014. Canada has also pledged to cut its greenhouse gas emissions by 40–45% by 2028.
Opportunities: Increasing focus on production of standard regulated small gas engines
According to the EPA, small engines will emit about one-third times fewer hydrocarbons under the new standards. The regulations aim to control running losses and permeation losses from fuel systems. Nevertheless, permeation is only one method by which fuel vapors are released. Evaporative emissions occur both when an engine is running and when the engine is not running owing to daily temperature variations. The government is banning small gas engines from 2024, which do not meet the regulation standard set by EPA. Each equipment builder or manufacturer is now focusing on the control of evaporative emissions from fuel systems and equipment certified with the EPA. To limit evaporative emissions, these manufacturers use a variety of technologies, ranging from specific hoses to fuel caps on sealed fuel tanks to carbon canisters and vapor control valves.
Challenges: Frequent maintenance of small gas engines
Frequent maintenance of small gas engines is a major challenge. Avoiding normal engine maintenance can lead to the need for extensive engine repair. Low oil levels can cause an engine seizure, necessitating an engine rebuild or replacement. Failure to change the engine oil and check/clean/replace the air filter regularly can result in rapid engine wear, particularly if the lawn mower is utilized in dusty conditions. Small gas engines are not difficult to maintain but they are time-consuming.
By engine displacement, 101 cc–400 cc segment to witness largest market share during forecast period
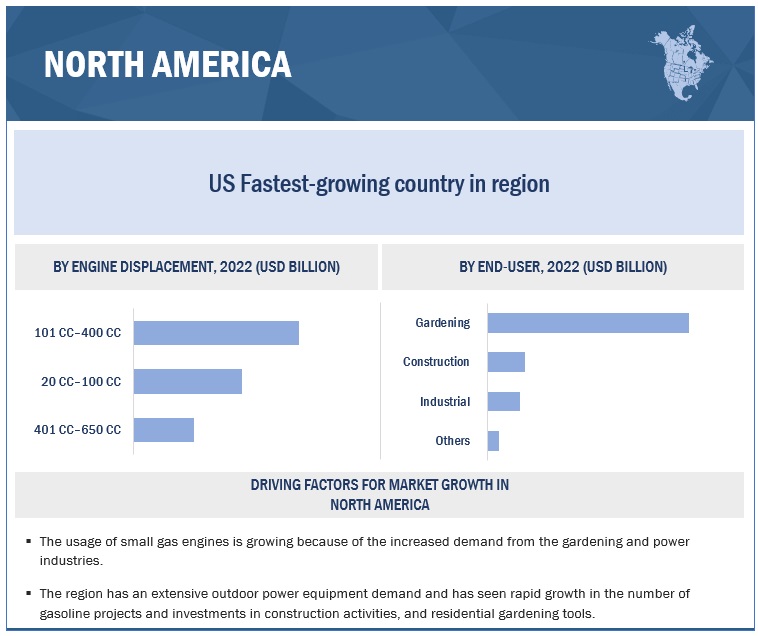
The 101 cc–400 cc segment is expected to witness the largest market share from 2023 to 2028, as it witnesses higher demand for concrete screeds, cement mixer and other construction equipment in the North America, which drives the growth of the 101 cc–400 cc segment during the forecasted period.
By equipment, snow blowers segment to witness fastest CAGR during forecast period
By equipment, snow blowers segment will be the fastest growing segment during the forecast period. The segment's growth is attributed to increasing demand of snow blowers in North American Countries Canada due to heavy snow fall.
By end-user, gardening segment to witness largest market share during forecast period
The gardening segment is expected to witness the largest market share from 2023 to 2028, as it witnesses increasing government initiatives in the clean green gardens in Europe.
North America is expected to be the largest market during the forecast period.
North America is expected to be the largest market share in the small gas engines market during the forecast period. The growth of the North America market is characterized by The growing demand from the gardening industry and large-scale small gas engine projects mainly drive the growth of the small gas engine market in this region.
Key Market Players
The major players in the global small gas engines market are Briggs & Stratton (US), Honda Motor Co., Ltd. (Japan), Kohler Co. (US), Kawasaki Heavy Industries, Ltd. (Japan), Yamaha Motor Corporation (Japan), KUBOTA Corporation, Liquid Combustion Technology, LLC (US).
Scope of the Report
|
Report Metric |
Details |
|
Market size available for years |
2021–2028 |
|
Base year considered |
2022 |
|
Forecast period |
2023–2028 |
|
Forecast units |
Value (USD) |
|
Segments covered |
Engine displacement, equipment and end-user |
|
Geographies covered |
Europe, Asia Pacific, North America, South America and Middle East & Africa |
|
Companies covered |
Briggs & Stratton (US), Honda Motor Co., Ltd. (Japan), Kohler Co. (US), Kawasaki Heavy Industries, Ltd. (Japan), Yamaha Motor Corporation (Japan), KUBOTA Corporation, Liquid Combustion Technology, LLC (US), KIPOR (Japan), Champion Power Equipment (US), Fuzhou Launtop M&E Co., Ltd. (China), Loncin Holdings Co. (China), MARUYAMA MFg., Co.Inc. (Japan), Fujian Jinjiang Sanli Engine Co., Ltd. (China), MITSUBISHI HEAVY INDUSTRIES, LTD. (Japan), CHONGQING RATO HOLDING (GROUP) CO., LTD. (China), Koki Holdings Co., Ltd. (Japan), Generac Power Systems, Inc. (US), Sinoquip Power (China), Lifan Power (US), Chongqing Winyou Power Co., Ltd. (China), Lombardini Srl (Italy)
|
This research report categorizes the small gas engine market by engine displacement, equipment, end-user and regions.
On the basis of engine displacement, the market has been segmented as follows:
- 20 cc–100 cc
- 101 cc– 400 cc
- 401 cc– 650 cc
On the basis of equipment, the market has been segmented as follows:
- Chainsaws
- Tillers
- Hedge Trimmers
- String Trimmers
- Concrete Vibrators
- Concrete Screeds
- Lawn mowers
- Leaf Blowers
- Snow Blowers
- Portable generators
- Pressure Washer
- Edgers
- Others
On the basis of end-user, the market has been segmented as follows:
- Gardening
- Construction
- Industrial
- Others
On the basis of region, the market has been segmented as follows:
- Europe
- Asia Pacific
- North America
- South America
- Middle East & Africa
Recent Developments
- In January 2023, Briggs & Stratton, which is the largest producer of gasoline engines for outdoor power equipment, moved its engine component production to Auburn.
- In June 2022, MITSUBISHI HEAVY INDUSTRIES ENGINEERING, LTD. and Mitsubishi Heavy Industries Engine & Turbocharger, Ltd. (MHIET), the two group companies of MITSUBISHI HEAVY INDUSTRIES, Ltd. (MHI), began the demonstration testing of MHIENG's CO2 capture technology in MHIET's gas engine generating sets. The testing was an essential component of MHI Group's goal of reaching carbon neutrality through its "MISSION NET ZERO" initiative and would play a vital role in achieving decarbonization in any industry.
- In June 2022, Briggs & Stratton partnered with AWEV Solutions Pvt. Ltd., which is an innovative developer of mobility products & solutions. Briggs & Stratton provided its innovative conversions of internal combustion engine vehicles to electric power.
- In April 2021, Alliant Energy partnered with Kohler Co. to develop a 2.25 MW ground-mounted solar system on Kohler's headquarters property in Kohler, Wisconsin. The sustainable energy cooperation will serve 580 houses with clean energy each year. The Kohler Solar Field was scheduled to be completed by the end of 2021.
Frequently Asked Questions (FAQ):
What is the current size of the small gas engines market?
The current market size of the global small gas engines market is estimated at USD 3.3 billion in 2023.
What are the major drivers for the small gas engines market?
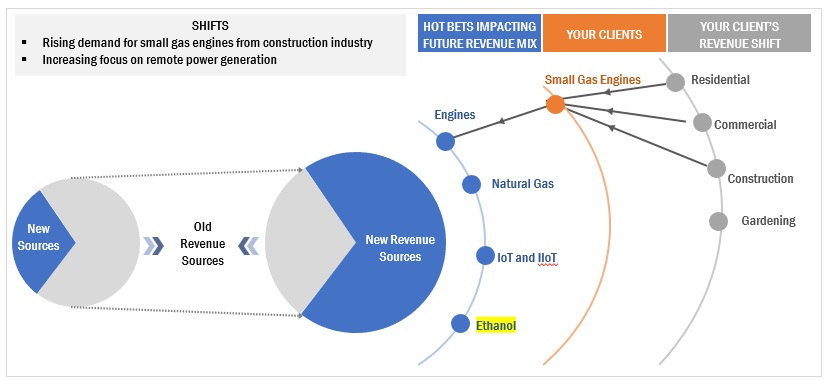
Growing construction industry
Which is the fastest-growing region during the forecasted period in the small gas engines market?
The Asia Pacific small gas engines market is estimated to be the second largest and the fastest-growing region, during the forecast period.
Which is the fastest-growing segment, by equipment during the forecasted period in the small gas engines market?
The snow blowers segment is estimated to be the fastest-growing segment, by equipment.
To know about the assumptions considered for the study, download the pdf brochure


- 5.1 INTRODUCTION
-
5.2 MARKET DYNAMICSDRIVERS- Growing construction industry- Rising demand for outdoor power equipmentRESTRAINTS- Increasing number of eco-friendly alternatives- Stricter CO2 emission regulationsOPPORTUNITIES- Increasing focus on producing standard regulated small gas enginesCHALLENGES- Frequent maintenance of small gas engines- Rise in ethanol prices
-
5.3 TRENDS/DISRUPTIONS IMPACTING CUSTOMER BUSINESSREVENUE SHIFT AND NEW REVENUE POCKETS FOR SMALL GAS ENGINE PROVIDERS
-
5.4 VALUE CHAIN ANALYSISRAW MATERIAL PROVIDERS/SUPPLIERSCOMPONENT MANUFACTURERSGAS ENGINE MANUFACTURERS/ASSEMBLERSDISTRIBUTORS (BUYERS)/END-USERSPOST-SALES SERVICE PROVIDERS
- 5.5 MARKET MAP
- 5.6 TECHNOLOGY ANALYSIS
- 5.7 TRADE ANALYSIS
- 5.8 KEY CONFERENCES AND EVENTS, 2023–2024
-
5.9 PATENT ANALYSISMAJOR PATENTS
- 5.10 PRICING ANALYSIS
- 5.11 TARIFF AND REGULATORY LANDSCAPE
-
5.12 MARKET: REGULATIONSREGULATORY BODIES, GOVERNMENT AGENCIES, AND OTHER ORGANIZATIONS
-
5.13 CASE STUDY ANALYSISKUBOTA PROVIDED TRUCK OR TRAILER WITH REFRIGERATION UNIT IN AFRICA- Problem statement- Solution
-
5.14 PORTER’S FIVE FORCES ANALYSISTHREAT OF NEW ENTRANTSBARGAINING POWER OF BUYERSBARGAINING POWER OF SUPPLIERSTHREAT OF SUBSTITUTESINTENSITY OF COMPETITIVE RIVALRY
-
5.15 KEY STAKEHOLDERS AND BUYING CRITERIAKEY STAKEHOLDERS IN BUYING PROCESSBUYING CRITERIA
- 6.1 INTRODUCTION
-
6.2 LAWN MOWERSINCREASING DEMAND FOR LAWN MOWERS FOR RESIDENTIAL PURPOSES TO DRIVE MARKET
-
6.3 CHAINSAWSRISING DEMAND FOR CHAINSAWS FOR COMMERCIAL APPLICATIONS TO BOOST MARKET
-
6.4 STRING TRIMMERSGROWING NEED FOR MAINTENANCE OF LAWNS IN PUBLIC PLACES TO FUEL MARKET
-
6.5 HEDGE TRIMMERSGROWTH OF TRIMMERS ATTRIBUTED TO URBAN FARMING
-
6.6 PORTABLE GENERATORSRISING INVESTMENTS IN BACKUP POWER SOLUTIONS TO PROPEL MARKET
-
6.7 TILLERSINCREASING DEMAND FOR TILLERS FROM AGRICULTURAL INDUSTRY TO FUEL MARKET
-
6.8 PRESSURE WASHERSGROWING ADOPTION OF PRESSURE WASHERS IN RESIDENTIAL SECTOR TO BOOST MARKET
-
6.9 CONCRETE VIBRATORSMAJOR INVESTMENTS IN CONSTRUCTION TO DRIVE MARKET
-
6.10 CONCRETE SCREEDSRISING USE OF CONCRETE SCREEDS IN CONSTRUCTION TO DRIVE MARKET
-
6.11 EDGERSINCREASING USE OF EDGERS IN COMMERCIAL APPLICATIONS TO FUEL MARKET
-
6.12 LEAF BLOWERSGOVERNMENT INITIATIVES IN LEAF BLOWERS TO PROPEL MARKET
-
6.13 SNOW BLOWERSADVANCEMENTS IN SNOW BLOWERS TO PROPEL MARKET GROWTH
- 6.14 OTHERS
- 7.1 INTRODUCTION
-
7.2 20 CC–100 CCRISING DEMAND FOR OUTDOOR POWER EQUIPMENT TO BOOST MARKET
-
7.3 101 CC–400 CCINCREASING USE OF PORTABLE GENERATORS AT CONSTRUCTION SITES TO PROPEL MARKET
-
7.4 401 CC–650 CCGROWING ADOPTION OF PRESSURE WASHERS TO FUEL MARKET GROWTH
- 8.1 INTRODUCTION
-
8.2 GARDENINGGROWING MANUFACTURE OF GARDENING EQUIPMENT TO FUEL MARKET
-
8.3 CONSTRUCTIONINCREASING DEMAND FOR CONSTRUCTION EQUIPMENT TO DRIVE MARKET
-
8.4 INDUSTRIALVAST PRODUCTION OF WATER PUMPS FOR INDUSTRIAL SECTOR TO BOOST MARKET
- 8.5 OTHERS
- 9.1 INTRODUCTION
-
9.2 NORTH AMERICARECESSION IMPACT: NORTH AMERICAUS- Growing demand for lawnmowers to drive marketCANADA- Increasing manufacture of snow blowers to boost marketMEXICO- Rising export of trimmers to propel market
-
9.3 ASIA PACIFICRECESSION IMPACT: ASIA PACIFICAUSTRALIA- Increasing investments in small gas engines to drive marketJAPAN- Adoption of new technologies for advancement of small gas engines to boost marketNEW ZEALAND- Increase in demand for construction equipment to boost marketINDIA- Government policies and initiatives to fuel marketCHINA- Growth in infrastructure activities to drive marketREST OF ASIA PACIFIC
-
9.4 EUROPERECESSION IMPACT: EUROPEUK- Development of gardens to enhance market growthGERMANY- Growing demand for landscaping services to stimulate market growthSWEDEN- Product expansion by key players to boost marketNETHERLANDS- Rising agricultural activities to accelerate market growthITALY- Increasing number of government initiatives to fuel market growthSPAIN- Rising use of lawn mowers in golf court maintenance to drive marketFRANCE- Growing consumption of small gas engines to propel demandBELGIUM- Increasing adoption of pressure washers to boost marketREST OF EUROPE
-
9.5 SOUTH AMERICARECESSION IMPACT: SOUTH AMERICABRAZIL- Growing demand for gardening equipment to drive marketARGENTINA- Lucrative opportunities for lawn mowers to enhance market growthREST OF SOUTH AMERICA
-
9.6 MIDDLE EAST & AFRICARECESSION IMPACT: MIDDLE EAST & AFRICAUAE- Increasing infrastructural development activities to drive marketSOUTH AFRICA- Rising adoption of tillers to boost marketISRAEL- Growing export of mowers to fuel market growthREST OF MIDDLE EAST & AFRICA

- 10.1 OVERVIEW
- 10.2 MARKET SHARE ANALYSIS
- 10.3 MARKET EVALUATION FRAMEWORK
- 10.4 ANALYSIS OF SEGMENTAL REVENUE OF TOP MARKET PLAYERS
-
10.5 RECENT DEVELOPMENTSDEALSOTHERS
-
10.6 COMPANY EVALUATION QUADRANTSTARSEMERGING LEADERSPERVASIVE PLAYERSPARTICIPANTS
-
10.7 START-UPS/SMES EVALUATION QUADRANT, 2021PROGRESSIVE COMPANIESRESPONSIVE COMPANIESDYNAMIC COMPANIESSTARTING BLOCKS
- 10.8 COMPETITIVE BENCHMARKING
-
11.1 KEY PLAYERSBRIGGS & STRATTON- Business overview- Products/Services/Solutions offered- Recent developments- MnM viewHONDA MOTOR CO., LTD.- Business overview- Products/Services/Solutions offered- Recent developments- MnM viewMITSUBISHI HEAVY INDUSTRIES, LTD. (MHI)- Business overview- Products/Services/Solutions offered- Recent developments- MnM viewKOHLER CO.- Business overview- Products/Services/Solutions offered- Recent developments- MnM viewKAWASAKI HEAVY INDUSTRIES, LTD.- Business overview- Products/Services/Solutions offered- MnM viewYAMAHA MOTOR CORPORATION- Business overview- Products/Services/Solutions offeredKUBOTA CORPORATION- Business overview- Products/Services/Solutions offeredMARUYAMA MFG. CO., INC.- Business overview- Products/Services/Solutions offeredKOKI HOLDINGS CO., LTD.- Business overview- Products/Services/Solutions offeredLIQUID COMBUSTION TECHNOLOGY, LLC- Business overview- Products/Services/Solutions offeredKIPOR POWER- Business overview- Products/Services/Solutions offeredGENERAC POWER SYSTEMS, INC.- Business overview- Products/Services/Solutions offeredLIFAN POWER- Business overview- Products/Services/Solutions offeredLONCIN INDUSTRIES- Business overview- Products/Services/Solutions offeredCHONGQING RATO HOLDING (GROUP) CO., LTD.- Business overview- Products/Services/Solutions offered
-
11.2 OTHER PLAYERSCHAMPION POWER EQUIPMENTFUZHOU LAUNTOP M&E CO., LTD.LOMBARDINI SRLSINOQUIP POWER
- 12.1 INSIGHTS FROM INDUSTRY EXPERTS
- 12.2 DISCUSSION GUIDE
- 12.3 KNOWLEDGESTORE: MARKETSANDMARKETS’ SUBSCRIPTION PORTAL
- 12.4 CUSTOMIZATION OPTIONS
- 12.5 RELATED REPORTS
- 12.6 AUTHOR DETAILS
- TABLE 1 SMALL GAS ENGINES MARKET: SNAPSHOT
- TABLE 2 MARKET: ROLE IN ECOSYSTEM
- TABLE 3 IMPORT SCENARIO FOR HS CODE 840790, BY COUNTRY, 2019–2021 (USD)
- TABLE 4 EXPORT SCENARIO FOR HS CODE: 840790, BY COUNTRY, 2019–2021 (USD)
- TABLE 5 MARKET: CONFERENCES AND EVENTS
- TABLE 6 SMALL GAS ENGINES: INNOVATIONS AND PATENT REGISTRATIONS, OCTOBER 2019–JANUARY 2022
- TABLE 7 AVERAGE SELLING PRICE OF SMALL GAS ENGINES, BY ENGINE DISPLACEMENT, 2022 (USD/UNIT)
- TABLE 8 AVERAGE SELLING PRICE OF SMALL GAS ENGINES, BY REGION, 2022 (USD/UNIT)
- TABLE 9 NORTH AMERICA: REGULATORY BODIES, GOVERNMENT AGENCIES, AND OTHER ORGANIZATIONS
- TABLE 10 EUROPE: REGULATORY BODIES, GOVERNMENT AGENCIES, AND OTHER ORGANIZATIONS
- TABLE 11 ASIA PACIFIC: REGULATORY BODIES, GOVERNMENT AGENCIES, AND OTHER ORGANIZATIONS
- TABLE 12 GLOBAL: REGULATORY BODIES, GOVERNMENT AGENCIES, AND OTHER ORGANIZATIONS
- TABLE 14 SMALL GAS ENGINE MARKET: PORTER’S FIVE FORCES ANALYSIS
- TABLE 15 INFLUENCE OF STAKEHOLDERS ON BUYING PROCESS FOR SMALL GAS ENGINE DISPLACEMENT SEGMENTS (%)
- TABLE 16 KEY BUYING CRITERIA, BY ENGINE DISPLACEMENT
- TABLE 17 SMALL GAS ENGINES MARKET, BY EQUIPMENT, 2021–2028 (USD MILLION)
- TABLE 18 LAWN MOWERS: MARKET, BY REGION, 2021–2028 (USD MILLION)
- TABLE 19 CHAINSAWS: MARKET, BY REGION, 2021–2028 (USD MILLION)
- TABLE 20 STRING TRIMMERS: MARKET, BY REGION, 2021–2028 (USD MILLION)
- TABLE 21 HEDGE TRIMMERS: MARKET, BY REGION, 2021–2028 (USD MILLION)
- TABLE 22 PORTABLE GENERATORS: MARKET, BY REGION, 2021–2028 (USD MILLION)
- TABLE 23 TILLERS: MARKET, BY REGION, 2021–2028 (USD MILLION)
- TABLE 24 PRESSURE WASHERS: MARKET, BY REGION, 2021–2028 (USD MILLION)
- TABLE 25 CONCRETE VIBRATORS: MARKET, BY REGION, 2021–2028 (USD MILLION)
- TABLE 26 CONCRETE SCREEDS: MARKET, BY REGION, 2021–2028 (USD MILLION)
- TABLE 27 EDGERS: MARKET, BY REGION, 2021–2028 (USD MILLION)
- TABLE 28 LEAF BLOWERS: MARKET, BY REGION, 2021–2028 (USD MILLION)
- TABLE 29 SNOW BLOWERS: MARKET, BY REGION, 2021–2028 (USD MILLION)
- TABLE 30 OTHERS: MARKET, BY REGION, 2021–2028 (USD MILLION)
- TABLE 31 SMALL GAS ENGINES MARKET, BY ENGINE DISPLACEMENT, 2021–2028 (USD MILLION)
- TABLE 32 MARKET, BY ENGINE DISPLACEMENT, 2021–2028 (THOUSAND UNITS)
- TABLE 33 20 CC–100 CC: MARKET, BY REGION, 2021–2028 (USD MILLION)
- TABLE 34 20 CC–100 CC: MARKET, BY EQUIPMENT, 2021–2028 (USD MILLION)
- TABLE 35 101 CC–400 CC: MARKET, BY REGION, 2021–2028 (USD MILLION)
- TABLE 36 101 CC–400 CC: MARKET, BY EQUIPMENT, 2021–2028 (USD MILLION)
- TABLE 37 401 CC–650 CC: MARKET, BY REGION, 2021–2028 (USD MILLION)
- TABLE 38 401 CC–650 CC: MARKET, BY EQUIPMENT, 2021–2028 (USD MILLION)
- TABLE 39 SMALL GAS ENGINES MARKET, BY END-USER, 2021–2028 (USD MILLION)
- TABLE 40 GARDENING: MARKET, BY REGION, 2021–2028 (USD MILLION)
- TABLE 41 CONSTRUCTION: MARKET, BY REGION, 2021–2028 (USD MILLION)
- TABLE 42 INDUSTRIAL: MARKET, BY REGION, 2021–2028 (USD MILLION)
- TABLE 43 OTHERS: MARKET, BY REGION, 2021–2028 (USD MILLION)
- TABLE 44 SMALL GAS ENGINE MARKET, BY REGION, 2021–2028 (USD MILLION)
- TABLE 45 MARKET, BY REGION, 2021–2028 (THOUSAND UNITS)
- TABLE 46 NORTH AMERICA: SMALL GAS ENGINES MARKET, BY EQUIPMENT, 2021–2028 (USD MILLION)
- TABLE 47 NORTH AMERICA: MARKET, BY ENGINE DISPLACEMENT, 2021–2028 (USD MILLION)
- TABLE 48 NORTH AMERICA: MARKET, BY END-USER, 2021–2028 (USD MILLION)
- TABLE 49 NORTH AMERICA: MARKET, BY COUNTRY, 2021–2028 (USD MILLION)
- TABLE 50 US: SMALL GAS ENGINE MARKET, BY END-USER, 2021–2028 (USD MILLION)
- TABLE 51 CANADA: MARKET, BY END-USER, 2021–2028 (USD MILLION)
- TABLE 52 MEXICO: MARKET, BY END-USER, 2021–2028 (USD MILLION)
- TABLE 53 ASIA PACIFIC: SMALL GAS ENGINE MARKET, BY EQUIPMENT, 2021–2028 (USD MILLION)
- TABLE 54 ASIA PACIFIC: MARKET, BY ENGINE DISPLACEMENT, 2021–2028 (USD MILLION)
- TABLE 55 ASIA PACIFIC: MARKET, BY END-USER, 2021–2028 (USD MILLION)
- TABLE 56 ASIA PACIFIC: MARKET, BY COUNTRY, 2021–2028 (USD MILLION)
- TABLE 57 AUSTRALIA: MARKET, BY END-USER, 2021–2028 (USD MILLION)
- TABLE 58 JAPAN: MARKET, BY END-USER, 2021–2028 (USD MILLION)
- TABLE 59 NEW ZEALAND: MARKET, BY END-USER, 2021–2028 (USD MILLION)
- TABLE 60 INDIA: MARKET, BY END-USER, 2021–2028 (USD MILLION)
- TABLE 61 CHINA: MARKET, BY END-USER, 2021–2028 (USD MILLION)
- TABLE 62 REST OF ASIA PACIFIC: MARKET, BY END-USER, 2021–2028 (USD MILLION)
- TABLE 63 EUROPE: SMALL GAS ENGINES MARKET, BY EQUIPMENT, 2021–2028 (USD MILLION)
- TABLE 64 EUROPE: MARKET, BY ENGINE DISPLACEMENT, 2021–2028 (USD MILLION)
- TABLE 65 EUROPE: MARKET, BY END-USER, 2021–2028 (USD MILLION)
- TABLE 66 EUROPE: MARKET, BY COUNTRY, 2021–2028 (USD MILLION)
- TABLE 67 UK: SMALL GAS ENGINE MARKET, BY END-USER, 2021–2028 (USD MILLION)
- TABLE 68 GERMANY: MARKET, BY END-USER, 2021–2028 (USD MILLION)
- TABLE 69 SWEDEN: MARKET, BY END-USER, 2021–2028 (USD MILLION)
- TABLE 70 NETHERLANDS: MARKET, BY END-USER, 2021–2028 (USD MILLION)
- TABLE 71 ITALY: MARKET, BY END-USER, 2021–2028 (USD MILLION)
- TABLE 72 SPAIN: MARKET, BY END-USER, 2021–2028 (USD MILLION)
- TABLE 73 FRANCE: MARKET, BY END-USER, 2021–2028 (USD MILLION)
- TABLE 74 BELGIUM: MARKET, BY END-USER, 2021–2028 (USD MILLION)
- TABLE 75 REST OF EUROPE: MARKET, BY END-USER, 2021–2028 (USD MILLION)
- TABLE 76 SOUTH AMERICA: SMALL GAS ENGINES MARKET, BY EQUIPMENT, 2021–2028 (USD MILLION)
- TABLE 77 SOUTH AMERICA: MARKET, BY ENGINE DISPLACEMENT, 2021–2028 (USD MILLION)
- TABLE 78 SOUTH AMERICA: MARKET, BY END-USER, 2021–2028 (USD MILLION)
- TABLE 79 SOUTH AMERICA: MARKET, BY COUNTRY, 2021–2028 (USD MILLION)
- TABLE 80 BRAZIL: SMALL GAS ENGINE MARKET, BY END-USER, 2021–2028 (USD MILLION)
- TABLE 81 ARGENTINA: MARKET, BY END-USER, 2021–2028 (USD MILLION)
- TABLE 82 REST OF SOUTH AMERICA: MARKET, BY END-USER, 2021–2028 (USD MILLION)
- TABLE 83 MIDDLE EAST & AFRICA: SMALL GAS ENGINE MARKET, BY EQUIPMENT, 2021–2028 (USD MILLION)
- TABLE 84 MIDDLE EAST & AFRICA: MARKET, BY ENGINE DISPLACEMENT, 2021–2028 (USD MILLION)
- TABLE 85 MIDDLE EAST & AFRICA: MARKET, BY END-USER, 2021–2028 (USD MILLION)
- TABLE 86 MIDDLE EAST & AFRICA: MARKET, BY COUNTRY, 2021–2028 (USD MILLION)
- TABLE 87 UAE: MARKET, BY END-USER, 2021–2028 (USD MILLION)
- TABLE 88 SOUTH AFRICA: MARKET, BY END-USER, 2021–2028 (USD MILLION)
- TABLE 89 ISRAEL: MARKET, BY END-USER, 2021–2028 (USD MILLION)
- TABLE 90 REST OF MIDDLE EAST & AFRICA: MARKET, BY END-USER, 2021–2028 (USD MILLION)
- TABLE 91 MARKET EVALUATION FRAMEWORK, 2018–2022
- TABLE 92 MARKET: DEALS, 2021–2022
- TABLE 93 MARKET: OTHERS, 2022–2023
- TABLE 94 COMPANY ENGINE DISPLACEMENT FOOTPRINT
- TABLE 95 COMPANY END-USER FOOTPRINT
- TABLE 96 COMPANY EQUIPMENT FOOTPRINT
- TABLE 97 COMPANY REGION FOOTPRINT
- TABLE 98 MARKET: DETAILED LIST OF KEY START-UPS/SMES
- TABLE 99 COMPANY ENGINE DISPLACEMENT FOOTPRINT: (START-UPS)
- TABLE 100 COMPANY EQUIPMENT APPLICATION FOOTPRINT: (START-UPS)
- TABLE 101 COMPANY END-USER APPLICATION FOOTPRINT: (START-UPS)
- TABLE 102 COMPANY REGION FOOTPRINT: (START-UPS)
- TABLE 103 BRIGGS & STRATTON: BUSINESS OVERVIEW
- TABLE 104 BRIGGS & STRATTON: PRODUCT LAUNCHES
- TABLE 105 BRIGGS & STRATTON: DEALS
- TABLE 106 BRIGGS & STRATTON: OTHERS
- TABLE 107 HONDA MOTOR CO., LTD.: BUSINESS OVERVIEW
- TABLE 108 HONDA MOTOR CO.: PRODUCT LAUNCHES
- TABLE 109 MITSUBISHI HEAVY INDUSTRIES, LTD. (MHI): BUSINESS OVERVIEW
- TABLE 110 MITSUBISHI HEAVY INDUSTRIES, LTD. (MHI): DEALS
- TABLE 111 KOHLER CO.: BUSINESS OVERVIEW
- TABLE 112 KOHLER CO.: DEALS
- TABLE 113 KOHLER CO.: OTHERS
- TABLE 114 KAWASAKI HEAVY INDUSTRIES, LTD.: BUSINESS OVERVIEW
- TABLE 115 YAMAHA MOTOR CORPORATION: BUSINESS OVERVIEW
- TABLE 116 KUBOTA CORPORATION: BUSINESS OVERVIEW
- TABLE 117 MARUYAMA MFG. CO., INC.: BUSINESS OVERVIEW
- TABLE 118 KOKI HOLDINGS CO., LTD.: BUSINESS OVERVIEW
- TABLE 119 LIQUID COMBUSTION TECHNOLOGY, LLC: BUSINESS OVERVIEW
- TABLE 120 KIPOR POWER: BUSINESS OVERVIEW
- TABLE 121 GENERAC POWER SYSTEMS, INC.: BUSINESS OVERVIEW
- TABLE 122 LIFAN POWER: BUSINESS OVERVIEW
- TABLE 123 LONCIN INDUSTRIES: BUSINESS OVERVIEW
- TABLE 124 CHONGQING RATO HOLDING (GROUP) CO., LTD.: BUSINESS OVERVIEW
- FIGURE 1 SMALL GAS ENGINES MARKET: RESEARCH DESIGN
- FIGURE 2 BREAKDOWN OF PRIMARIES
- FIGURE 3 MARKET: BOTTOM-UP APPROACH
- FIGURE 4 MARKET: TOP-DOWN APPROACH
- FIGURE 5 METRICS CONSIDERED FOR ANALYZING DEMAND FOR SMALL GAS ENGINES
- FIGURE 6 KEY STEPS CONSIDERED FOR ASSESSING SUPPLY OF SMALL GAS ENGINES
- FIGURE 7 MARKET: SUPPLY-SIDE ANALYSIS
- FIGURE 8 NORTH AMERICA HELD LARGEST SHARE OF MARKET IN 2022
- FIGURE 9 101 CC–400 CC SEGMENT TO CONTINUE TO HOLD LARGEST SIZE OF MARKET, BY ENGINE DISPLACEMENT, DURING FORECAST PERIOD
- FIGURE 10 GARDENING END-USER TO HOLD LARGEST SIZE IN MARKET IN 2028
- FIGURE 11 LAWNMOWERS TO HOLD LARGEST SIZE IN MARKET IN 2028
- FIGURE 12 HIGH DEMAND FOR OUTDOOR POWER EQUIPMENT TO FUEL MARKET GROWTH
- FIGURE 13 SMALL GAS ENGINE MARKET IN ASIA PACIFIC TO WITNESS HIGHEST CAGR DURING FORECAST PERIOD
- FIGURE 14 CONSTRUCTION AND US WERE LARGEST SHAREHOLDERS IN MARKET IN NORTH AMERICA IN 2022
- FIGURE 15 20 CC–100 CC SEGMENT TO RECORD HIGHEST CAGR FROM 2022 TO 2028
- FIGURE 16 LAWNMOWERS TO ACCOUNT FOR LARGEST SHARE OF MARKET IN 2022
- FIGURE 17 SMALL GAS ENGINES MARKET: DRIVERS, RESTRAINTS, OPPORTUNITIES, AND CHALLENGES
- FIGURE 18 GLOBAL CARBON DIOXIDE EMISSIONS, 2015–2020
- FIGURE 19 GLOBAL ETHANOL PRICES, 2022
- FIGURE 20 REVENUE SHIFT FOR GAS ENGINE PROVIDERS
- FIGURE 21 VALUE CHAIN ANALYSIS: MARKET
- FIGURE 22 SMALL GAS ENGINES: MARKET MAP
- FIGURE 23 IMPORT DATA FOR TOP FIVE COUNTRIES, 2019–2021 (USD)
- FIGURE 24 EXPORT DATA FOR TOP FIVE COUNTRIES, 2019–2021 (USD)
- FIGURE 25 SMALL GAS ENGINE MARKET: PORTER’S FIVE FORCES ANALYSIS
- FIGURE 26 INFLUENCE OF STAKEHOLDERS ON BUYING PROCESS, BY ENGINE DISPLACEMENT
- FIGURE 27 KEY BUYING CRITERIA FOR TOP ENGINE DISPLACEMENT SEGMENTS OF SMALL GAS ENGINES
- FIGURE 28 MARKET, BY EQUIPMENT, 2022
- FIGURE 29 MARKET, BY ENGINE DISPLACEMENT, 2022
- FIGURE 30 MARKET, BY END-USER, 2022
- FIGURE 31 NORTH AMERICA ACCOUNTED FOR LARGEST SHARE OF MARKET IN 2022
- FIGURE 32 NORTH AMERICA: SNAPSHOT OF MARKET
- FIGURE 33 ASIA PACIFIC: SNAPSHOT OF MARKET
- FIGURE 34 KEY DEVELOPMENTS IN MARKET, 2018–2023
- FIGURE 35 SMALL GAS ENGINES MARKET SHARE ANALYSIS IN MARKET, 2022
- FIGURE 36 SEGMENTAL REVENUE ANALYSIS OF KEY COMPANIES OFFERING SMALL GAS ENGINES, 2017–2021
- FIGURE 37 SMALL GAS ENGINE MARKET: COMPETITIVE LEADERSHIP MAPPING, 2021
- FIGURE 38 MARKET: START-UPS/SMES EVALUATION QUADRANT, 2021
- FIGURE 41 KAWASAKI HEAVY INDUSTRIES, LTD.: COMPANY SNAPSHOT
- FIGURE 42 YAMAHA MOTOR CORPORATION: COMPANY SNAPSHOT
- FIGURE 43 KUBOTA CORPORATION: COMPANY SNAPSHOT
This study involved four major activities in estimating the current size of the small gas engines market. Exhaustive secondary research was done to collect information on the market, the peer market, and the parent market. The next step was to validate these findings, assumptions, and market sizing with industry experts across the value chain through rigorous primary research. Both top-down and bottom-up approaches were used to estimate the total market size. The market breakdown and data triangulation techniques were employed to estimate the market size of the segments and the corresponding subsegments.
Secondary Research
1This research study involved the use of extensive secondary sources, directories, and databases such as industry publications, several newspaper articles, Statista Industry Journal, and UNESCO Institute of Statistics to identify and collect information useful for a technical, market-oriented, and commercial study of the utility communication market. The other secondary sources included annual reports, press releases & investor presentations of companies, white papers, certified publications, articles by recognized authors, manufacturer associations, trade directories, and databases.
Primary Research
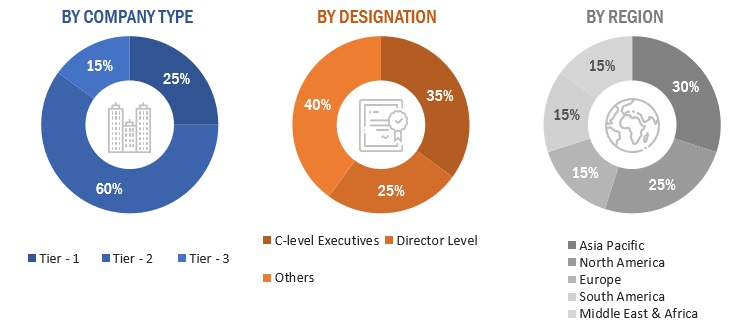
Primary sources included several industry experts from core and related industries, preferred suppliers, manufacturers, service providers, technology developers, and organizations related to all the segments of the nuclear industry. In-depth interviews were conducted with various primary respondents, including key industry participants, subject matter experts (SME), C-level executives of the key market players, and industry consultants, among other experts, to obtain and verify qualitative and quantitative information, as well as to assess the prospects of the market. The breakdown of primary respondents is given below:
To know about the assumptions considered for the study, download the pdf brochure
Market Size Estimation
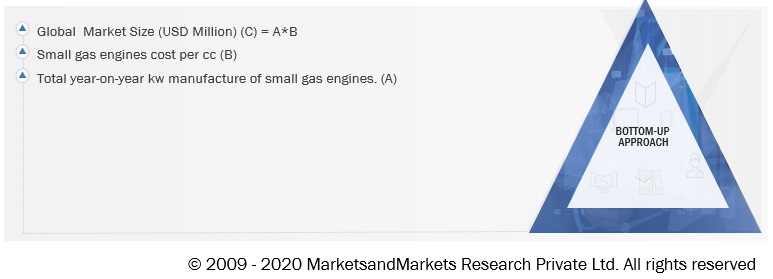
Both top-down and bottom-up approaches have been used to estimate and validate the size of the global small gas engine market and its dependent submarkets. These methods were also extensively used to estimate the size of various subsegments in the market. The research methodology used to estimate the market size includes the following:
- The key players in the industry and market have been identified through extensive secondary research, and their market shares in the respective regions have been determined through both primary and secondary research.
- The industry’s supply chain and market size, in terms of value, have been determined through primary and secondary research processes.
- All percentage shares, splits, and breakdowns have been determined using secondary sources and verified through primary sources.
Global Small Gas Engines Market Size: Bottom-Up Approach
To know about the assumptions considered for the study, Request for Free Sample Report
Data Triangulation
After arriving at the overall market size—using the market size estimation processes as explained above—the market was split into several segments and subsegments. To complete the entire market engineering process and arrive at the exact statistics of each market segment and subsegment, the data triangulation, and market breakdown procedures were employed, wherever applicable. The data was triangulated by studying various factors and trends from both the demand and supply sides in the small gas engine market.
Objectives of the Study
- To forecast and describe the small gas engine market size, by engine displacement, equipment, end-user, and region, in terms of value
- To provide detailed information regarding the major drivers, restraints, opportunities, and challenges influencing the growth of the market
- To estimate the size of the market in terms of value
- To strategically analyze micro markets with respect to individual growth trends, prospects, future expansions, and contributions to the overall market
- To provide post-pandemic estimation for the market and analyze the impact of the pandemic on the overall market and value chain
- To forecast the growth of the small gas engine market with respect to five major regions, namely, North America, Europe, Asia Pacific, South America and Middle East & Africa
- To analyze market opportunities for stakeholders and the competitive landscape for market leaders
- To strategically profile key players and comprehensively analyze their respective market shares and core competencies
- To analyze competitive developments such as investments & expansions, contracts & agreements, and joint ventures & collaborations in the market
Available Customizations:
With the given market data, MarketsandMarkets offers customizations according to your specific needs. The following customization options are available for the report:
Company Information
- Product Matrix, which provides a detailed comparison of the product portfolio of each company
Company Information
- Detailed analysis and profiling of additional market players


 Generating Response ...


Growth opportunities and latent adjacency in Small Gas Engines Market