Outdoor Power Equipment Market

Outdoor Power Equipment Market by Equipment Type (Lawn Mowers, Saws, Trimmers & Edgers), Power Source (Fuel-based, Electric), Functionality (Connected/Smart Products, Conventional Products), Application and Region - Global Forecast to 2029

Report Code: SE 7109 Feb, 2024, by marketsandmarkets.com

[260 Pages Report] The outdoor power equipment market is expected to grow from USD 31.0 billion in 2024 to USD 36.5 billion by 2029, at a CAGR of 3.3% during the forecast period. The rising interest in gardening activities and increasing demand for landscaping services, increasing use of battery-powered outdoor power equipment for lawn maintenance, and rapid growth in construction sector all significantly influence the dynamics of the outdoor power equipment market. In addition, growing inclination toward rental services and increasing popularity of connected outdoor power equipment are all factors that generate opportunities within the outdoor power equipment market.

Attractive Opportunities in the Outdoor Power Equipment Market

Outdoor Power Equipment Market

Outdoor Power Equipment Market

Outdoor Power Equipment Market Forecast to 2029

To know about the assumptions considered for the study, Request for Free Sample Report

Outdoor Power Equipment Market Dynamics

DRIVERS: Rising interest in gardening activities and increasing demand for landscaping services

The outdoor power equipment market experiences significant growth driven primarily by increasing demand from both residential and commercial customers seeking landscaping services to enhance property aesthetics. Within the landscaping sector, a diverse range of outdoor power tools such as lawn mowers, hedge trimmers, blowers, and saws are employed for tasks including lawn maintenance, hardscaping, tree care, and snow removal. According to the 2023 National Gardening Survey in the US, approximately 80% of households engaged in lawn and garden activities in 2022, with an average expenditure of USD 616 per household. This reflects a growing trend among homeowners in developed nations to allocate more resources to outdoor and gardening activities, thus driving demand for outdoor power equipment.

Outdoor power equipment also plays a pivotal role across various professional sectors including landscaping services, ground maintenance, sports field upkeep, commercial nurseries and greenhouses, as well as forestry and logging operations. The 2023 report from the National Golf Foundation indicates significant growth in the US golf industry, with 15,945 golf courses, five times more than any other country. This growth underscores an increased demand for outdoor power equipment to maintain these golf courses effectively.

RESTRAINTS: High maintenance costs

Outdoor power equipment, such as lawn mowers and trimmers, is recognized for its precision engineering. These tools comprise various components, including motors, air filters, and fuel filters, which demand regular upkeep. Recalibration of outdoor power equipment is necessary at consistent intervals to ensure optimal functionality. As time passes, components like motors, batteries, and cables gradually degrade and require routine oiling, sharpening, and repairs. The maintenance expenses for outdoor power equipment are relatively steep. Especially in developing regions where labor costs are lower, consumers hesitate to invest significant sums in equipment upkeep. This elevated maintenance cost has thus acted as a barrier to the expansion of the outdoor power equipment market. Furthermore, consumers in developing countries are increasingly favoring the leasing of outdoor power equipment, exacerbating the market's growth challenges.

OPPORTUNITIES: Increasing popularity of connected outdoor power equipment

With the increasing integration of IoT devices and other technological advancements, manufacturers are directing their efforts towards providing smart and interconnected outdoor power equipment. For example, John Deere has introduced JDLink to its customers at no extra cost; this digital platform collects real-time equipment data and sends it to John Deere service centers, while also allowing customers to monitor and manage their equipment using smartphones. Similarly, Husqvarna Group, based in Sweden, offers residential robotics lawn mowers like the Automower 450X and 435X AWD, which feature smartphone connectivity for remote control and monitoring. These connected and intelligent products are gaining popularity among consumers and present a lucrative opportunity for the growth of the outdoor power equipment market.

CHALLENGES: Stringent trade policies and safety regulations

Safety and regulatory compliance are top priorities for manufacturers in the global outdoor power equipment industry. Domestic and international distribution channels, as well as end-users, demand reliability and strict adherence to both current and evolving safety standards. In addition to meeting mandatory regulations, it's crucial for manufacturers to address significant concerns raised by retailers and consumers regarding product quality and environmental sustainability. Furthermore, depending on the type of equipment, manufacturers must also navigate additional regulations covering aspects such as physical safety requirements, electromagnetic interference, operational noise levels, and product recycling. These regulatory demands not only increase the overall cost of owning outdoor power equipment but also pose significant challenges for manufacturers, particularly concerning product testing mandates.

Outdoor Power Equipment Market Ecosystem

Outdoor Power Equipment Market by Ecosystem

Lawn Mowers to hold the largest share of the outdoor power equipment market during 2024–2029.

The lawn mowers segment is expected to account for the largest share of the outdoor power equipment market during the forecast period, primarly due to its essential function in lawn maintenance and garden care. With an increasing focus on outdoor activities and gardening, there is a growing demand for outdoor power equipment. Furthermore, the rise in residential and commercial construction projects has intensified the need for such equipment. As a result, the lawn mowers segment continues to thrive, catering to the evolving needs of consumers and businesses seeking efficient solutions for landscaping and property maintenance.

Commerical segment is expected to grow at the higher CAGR in the outdoor power equipment market during the forecast period.

The commercial segment is expected to register the highest CAGR in the outdoor power equipment market during the forecast period, driven primarily by increased demand across various sectors including landscaping, construction, and agriculture. Businesses are placing a greater emphasis on improving efficiency and productivity, leading to a rise in the adoption of advanced outdoor equipment for a wide range of maintenance and operational tasks. Additionally, the ongoing global trend of urbanization and continual infrastructure development projects is further fueling this upward trend. As cities expand and infrastructure projects progress, commercial entities are investing more in high-performance equipment to meet the evolving demands of these projects. This increased investment in cutting-edge equipment is expected to significantly contribute to the projected growth of the commercial segment.

Fuel-based equipment will dominate the market during the forecast period.

The fuel-based equipment is expected to account for the largest share of the outdoor power equipment market during the forecast period. Professional landscapers and turf-care providers, show a strong preference for fuel-based equipment due to its effectiveness in handling demanding tasks like maintaining large lawns, yards, and stadiums. Additionally, the growing popularity of turf sports and the increasing demand for landscaping services further contribute to the widespread use of fuel-based outdoor power equipment. This underscores the vital role that fuel-based equipment plays in meeting the rigorous demands of commercial and professional outdoor maintenance operations.

Asia Pacific is expected to grow at the higher CAGR in the outdoor power equipment market during 2024–2029.

Asia Pacific is expected to grow at the higher CAGR in the outdoor power equipment market throughout the forecast period. This surge is fueled by strong economic growth, rapid urbanization trends, and increasing disposable incomes across key markets such as China, India, Japan, and South Korea. Additionally, government initiatives focusing on infrastructure development and sustainability are driving market demand. Moreover, a growing emphasis on environmental awareness is encouraging the adoption of energy-efficient and environmentally friendly outdoor power equipment options. These combined factors position the Asia-Pacific region as a significant driver of growth in the outdoor power equipment market.

Outdoor Power Equipment Market
 by Region

Outdoor Power Equipment Market by Region

To know about the assumptions considered for the study, download the pdf brochure

Key Market Players

The outdoor power equipment companies have /implemented various types of organic and inorganic growth strategies, such as product launches, product developments, partnerships, and collaborations, to strengthen their offerings in the market. The major players are Husqvarna Group (Sweden), The Toro Company (US), Deere & Company (US), Stanley Black & Decker, Inc. (US), ANDREAS STIHL AG & Co. KG (Germany), Techtronic Industries Co. Ltd. (Hong Kong), Honda Motor Co., Ltd. (Japan), YAMABIKO Corporation (Japan), Makita Corporation (Japan), Robert Bosch GmbH (Germany),Honda (Japan), and others. The study includes an in-depth competitive analysis of these key players in the outdoor power equipment market with their company profiles, recent developments, and key market strategies.

Get online access to the report on the World's First Market Intelligence Cloud

  • Easy to Download Historical Data & Forecast Numbers
  • Company Analysis Dashboard for high growth potential opportunities
  • Research Analyst Access for customization & queries
  • Competitor Analysis with Interactive dashboard
  • Latest News, Updates & Trend analysis
Request Sample

Scope of the Report

Report Metric

Details

Market Size Available for Years

2020–2029

Base Year

2023

Forecast Period

2024–2029

Units

Value (USD Million/Billion)

Segments Covered

Equipment type, Application, and Power Source

Geographic Regions Covered

North America, Europe, Asia Pacific, and RoW

Companies Covered

Major Players: Husqvarna Group (Sweden), The Toro Company (US), Deere & Company (US), Stanley Black & Decker, Inc. (US), ANDREAS STIHL AG & Co. KG (STIHL) (Germany), Techtronic Industries Co. Ltd. (Hong Kong), Honda Motor Co., Ltd. (Japan), YAMABIKO Corporation (Japan), Makita Corporation (Japan), Robert Bosch GmbH (Germany) among other – Total 25 players have been covered.

Fire Protection System Market Highlights

This research report categorizes the global Outdoor Power Equipment Market based on Equipment Type, Applications, Power Source, and Region.

Segment

Subsegment

By Equipment Type:

  • Lawn Mowers
  • Saws
  • Trimmers & Edgers
  • Blowers
  • Snow Throwers
  • Tillers & Cultivators
  • Others

By Applications:

  • Residential/DIY
  • Commercial

By Power Source:

  • Fuel-based
  • Electric

By Region:

  • North America
  • Europe
  • Asia Pacific
  • Rest of the World (RoW)

Recent Developments

  • In October 2023, The Toro Company introduced the TimeCutter MAX and TITAN Zero-Turn Mowers, designed to provide exceptional performance, maximum comfort, and sleek design. These zero-turn mowers are fully equipped to overcome various challenges, from extensive acreage to rugged terrains.
  • In October 2023, Stanley Black & Decker, Inc. and its brands Cub Cadet, DEWALT, and Hustler Turf showcased their professional grade electric and gas-outdoor power equipment at Equip Expo 2023. Cub Cadet featured the PRO Z Series and PRO X Series of stand movers. The DEWALT brand showcased the 60V MAX 14" Top Handle Chainsaw and 21 in. 60V MAX* Single-Stage Snow Blower. Hustler displayed its new line-up of X-RIDE mowers.
  • In September 2023, Deere & Company introduced six new models (Q810E, Q820E, Q820M, Q850M, Q850R and Q865R EFI machines) of QuikTrak Stand-On Mowers, designed for commercial use. With increased speed, enhanced power, and larger fuel capacity, this 2024 line-up offers an optimal solution for customers.
  • In March 2023, Husqvarna Group introduced the Husqvarna Aspire series, a comprehensive lineup that supports the Power for All battery system, enabling consumers to employ a single 18V battery across an array of devices in their home and garden, irrespective of the manufacturer. The Husqvarna Aspire series includes a robotic mower, walk-behind mower, grass trimmer, pruner, hedge trimmer, and blower.
  • In March 2023, STIHL has obtained a majority stake of 75.1% in Mogatec GmbH, a leading expert in advanced garden technology. The plan is for STIHL to progressively acquire the remaining shares of Mogatec GmbH in the coming years. This strategic move is underpinned by the longstanding and close collaboration between the two companies, particularly in engineering and the customized production of specific power tools.

Frequently Asked Questions(FAQs):

To speak to our analyst for a discussion on the above findings, click Speak to Analyst

TABLE OF CONTENTS
 
1 INTRODUCTION (Page No. - 33)
    1.1 STUDY OBJECTIVES 
    1.2 MARKET DEFINITION 
           1.2.1 INCLUSIONS & EXCLUSIONS
                    TABLE 1 OUTDOOR POWER EQUIPMENT MARKET: INCLUSIONS & EXCLUSIONS
    1.3 STUDY SCOPE 
           1.3.1 SEGMENTS COVERED
                    FIGURE 1 OUTDOOR POWER EQUIPMENT MARKET SEGMENTATION
                    FIGURE 2 OUTDOOR POWER EQUIPMENT MARKET, BY REGION
           1.3.2 YEARS CONSIDERED
    1.4 CURRENCY CONSIDERED 
    1.5 LIMITATIONS 
    1.6 STAKEHOLDERS 
    1.7 SUMMARY OF CHANGES 
           1.7.1 IMPACT OF RECESSION
 
2 RESEARCH METHODOLOGY (Page No. - 37)
    2.1 RESEARCH DATA 
           FIGURE 3 OUTDOOR POWER EQUIPMENT MARKET: RESEARCH DESIGN
           2.1.1 SECONDARY DATA
                    2.1.1.1 Major secondary sources
                    2.1.1.2 Key data from secondary sources
           2.1.2 PRIMARY DATA
                    2.1.2.1 Breakdown of primaries
                    2.1.2.2 Key data from primary sources
           2.1.3 SECONDARY & PRIMARY RESEARCH
                    2.1.3.1 Key industry insights
    2.2 MARKET SIZE ESTIMATION 
           FIGURE 4 MARKET SIZE ESTIMATION METHODOLOGY: (SUPPLY SIDE): REVENUE FROM OUTDOOR POWER EQUIPMENT MARKET
           2.2.1 BOTTOM-UP APPROACH
                    2.2.1.1 Approach used to arrive at market share through bottom-up analysis (demand side)
                               FIGURE 5 OUTDOOR POWER EQUIPMENT MARKET: BOTTOM-UP APPROACH
           2.2.2 TOP-DOWN APPROACH
                    2.2.2.1 Approach used to arrive at market share through top-down analysis (supply side)
                               FIGURE 6 OUTDOOR POWER EQUIPMENT MARKET: TOP-DOWN APPROACH
    2.3 MARKET BREAKDOWN & DATA TRIANGULATION 
           FIGURE 7 DATA TRIANGULATION
    2.4 RESEARCH ASSUMPTIONS 
    2.5 PARAMETERS CONSIDERED TO STUDY RECESSION IMPACT ON OUTDOOR POWER EQUIPMENT MARKET 
    2.6 RISK ASSESSMENT 
           TABLE 2 LIMITATIONS & ASSOCIATED RISKS
 
3 EXECUTIVE SUMMARY (Page No. - 47)
    FIGURE 8 LAWN MOWERS TO ACCOUNT FOR LARGEST MARKET SHARE DURING FORECAST PERIOD
    FIGURE 9 RESIDENTIAL/DIY APPLICATION TO LEAD MARKET DURING FORECAST PERIOD
    FIGURE 10 FUEL-BASED EQUIPMENT TO HOLD LARGER MARKET SHARE DURING FORECAST PERIOD
    FIGURE 11 ASIA PACIFIC MARKET TO REGISTER HIGHEST CAGR DURING FORECAST PERIOD
 
4 PREMIUM INSIGHTS (Page No. - 51)
    4.1 ATTRACTIVE GROWTH OPPORTUNITIES FOR PLAYERS IN OUTDOOR POWER EQUIPMENT MARKET 
           FIGURE 12 ASIA PACIFIC MARKET TO REGISTER SIGNIFICANT GROWTH DURING FORECAST PERIOD
    4.2 OUTDOOR POWER EQUIPMENT MARKET, BY EQUIPMENT TYPE 
           FIGURE 13 LAWN MOWERS TO HOLD LARGEST MARKET SHARE DURING FORECAST PERIOD
    4.3 OUTDOOR POWER EQUIPMENT MARKET, BY APPLICATION 
           FIGURE 14 RESIDENTIAL/DIY APPLICATION TO DOMINATE MARKET DURING FORECAST PERIOD
    4.4 OUTDOOR POWER EQUIPMENT MARKET, BY POWER SOURCE 
           FIGURE 15 FUEL-BASED SEGMENT TO LEAD DURING FORECAST PERIOD
    4.5 OUTDOOR POWER EQUIPMENT MARKET, BY REGION 
           FIGURE 16 INDIAN MARKET TO RECORD HIGHEST CAGR DURING FORECAST PERIOD
 
5 MARKET OVERVIEW (Page No. - 54)
    5.1 INTRODUCTION 
    5.2 MARKET DYNAMICS 
           FIGURE 17 OUTDOOR POWER EQUIPMENT MARKET: DRIVERS, RESTRAINTS, OPPORTUNITIES, AND CHALLENGES
           5.2.1 DRIVERS
                    5.2.1.1 Rising interest in gardening activities and increasing demand for landscaping services
                    5.2.1.2 Increasing use of battery-powered equipment for lawn maintenance
                    5.2.1.3 Rapid growth in construction sector
                               FIGURE 18 OUTDOOR POWER EQUIPMENT MARKET: IMPACT OF DRIVERS
           5.2.2 RESTRAINTS
                    5.2.2.1 High maintenance costs
                               FIGURE 19 OUTDOOR POWER EQUIPMENT MARKET: IMPACT OF RESTRAINTS
           5.2.3 OPPORTUNITIES
                    5.2.3.1 Increasing popularity of connected outdoor power equipment
                    5.2.3.2 Growing inclination toward rental services
                               FIGURE 20 OUTDOOR POWER EQUIPMENT MARKET: IMPACT OF OPPORTUNITIES
           5.2.4 CHALLENGES
                    5.2.4.1 Stringent trade policies and safety regulations
                    5.2.4.2 Difficulties in designing ergonomic and lightweight equipment
                               FIGURE 21 OUTDOOR POWER EQUIPMENT MARKET: IMPACT OF CHALLENGES
    5.3 TRENDS/DISRUPTIONS IMPACTING CUSTOMER BUSINESS 
           FIGURE 22 REVENUE SHIFT FOR OUTDOOR POWER EQUIPMENT MARKET
    5.4 PRICING ANALYSIS 
           5.4.1 AVERAGE SELLING PRICE OF OUTDOOR POWER EQUIPMENT OFFERED BY TOP PLAYERS
                    FIGURE 23 AVERAGE SELLING PRICE OF OUTDOOR POWER EQUIPMENT OFFERED BY TOP PLAYERS
                    FIGURE 24 AVERAGE SELLING PRICE OF OUTDOOR POWER EQUIPMENT, 2024–2029 (USD)
                    TABLE 3 AVERAGE SELLING PRICE OF OUTDOOR POWER EQUIPMENT OFFERED BY TOP PLAYERS
                    TABLE 4 AVERAGE SELLING PRICE OF OUTDOOR POWER EQUIPMENT, BY REGION
    5.5 VALUE CHAIN ANALYSIS 
           FIGURE 25 OUTDOOR POWER EQUIPMENT MARKET: VALUE CHAIN ANALYSIS
           5.5.1 COMPONENT SUPPLIERS
           5.5.2 OUTDOOR POWER EQUIPMENT MANUFACTURERS
           5.5.3 DISTRIBUTORS AND RETAILERS
           5.5.4 END USERS
           5.5.5 POST-SALES SERVICE PROVIDERS
    5.6 ECOSYSTEM ANALYSIS 
           FIGURE 26 OUTDOOR POWER EQUIPMENT MARKET: ECOSYSTEM ANALYSIS
           TABLE 5 OUTDOOR POWER EQUIPMENT MARKET: ROLE OF COMPANIES IN ECOSYSTEM
    5.7 INVESTMENT AND FUNDING SCENARIO 
           FIGURE 27 INVESTOR DEALS AND FUNDING IN OUTDOOR POWER EQUIPMENT MARKET FROM 2018 TO 2023
    5.8 TECHNOLOGY ANALYSIS 
           5.8.1 KEY TECHNOLOGIES
                    5.8.1.1 Brushless DC motors
                    5.8.1.2 Smart and connected outdoor power equipment
           5.8.2 COMPLEMENTARY TECHNOLOGIES
                    5.8.2.1 Hydrostatic transmission systems
                    5.8.2.2 40V MAX & 80V MAX lithium-ion batteries
           5.8.3 ADJACENT TECHNOLOGIES
                    5.8.3.1 IoT sensors
    5.9 PATENT ANALYSIS 
           FIGURE 28 COMPANIES WITH HIGHEST NUMBER OF PATENT APPLICATIONS PERTAINING TO OUTDOOR POWER EQUIPMENT MARKET, 2014–2023
           TABLE 6 TOP 20 OWNERS OF PATENTS RELATED TO OUTDOOR POWER EQUIPMENT MARKET (2014–2023)
           FIGURE 29 NUMBER OF OUTDOOR POWER EQUIPMENT-RELATED PATENTS GRANTED (2014–2023)
           5.9.1 PATENTS RELATED TO OUTDOOR POWER EQUIPMENT MARKET, 2022–2023
    5.10 TRADE ANALYSIS 
           FIGURE 30 OUTDOOR POWER EQUIPMENT IMPORTS, BY KEY COUNTRY, 2018–2022 (USD MILLION)
           FIGURE 31 OUTDOOR POWER EQUIPMENT EXPORTS, BY KEY COUNTRY, 2018–2022 (USD MILLION)
    5.11 KEY CONFERENCES AND EVENTS, 2023–2024 
           TABLE 7 OUTDOOR POWER EQUIPMENT MARKET: CONFERENCES AND EVENTS
    5.12 CASE STUDY ANALYSIS 
           TABLE 8 FLORIDA LANDSCAPE CONSULTANTS USES HUSQVARNA LAWN MOWERS TO STREAMLINE WORKFLOW
           TABLE 9 RC MOWERS' ROBOTIC MOWER HELPS CITY OF PORTLAND REDUCE RISK OF FLOODING
           TABLE 10 BRIGHT HOUSE NETWORKS STADIUM USES JOHN DEERE MOWERS TO MAINTAIN TURF
           TABLE 11 O’CONNELL LANDSCAPE MAINTENANCE OPTIMIZES EFFICIENCY AND SAFETY WITH RC MOWERS
    5.13 REGULATORY LANDSCAPE AND STANDARDS 
           5.13.1 REGULATORY BODIES, GOVERNMENT AGENCIES, AND OTHER ORGANIZATIONS
                    TABLE 12 NORTH AMERICA: REGULATORY BODIES, GOVERNMENT AGENCIES, AND OTHER ORGANIZATIONS
                    TABLE 13 EUROPE: REGULATORY BODIES, GOVERNMENT AGENCIES, AND OTHER ORGANIZATIONS
                    TABLE 14 ASIA PACIFIC: REGULATORY BODIES, GOVERNMENT AGENCIES, AND OTHER ORGANIZATIONS
                    TABLE 15 REST OF THE WORLD: REGULATORY BODIES, GOVERNMENT AGENCIES, AND OTHER ORGANIZATIONS
           5.13.2 STANDARDS RELATED TO OUTDOOR POWER EQUIPMENT MARKET
                    TABLE 16 OUTDOOR POWER EQUIPMENT MARKET: STANDARDS
    5.14 PORTER’S FIVE FORCES ANALYSIS 
           FIGURE 32 OUTDOOR POWER EQUIPMENT MARKET: PORTER’S FIVE FORCES ANALYSIS
           5.14.1 THREAT OF NEW ENTRANTS
           5.14.2 THREAT OF SUBSTITUTES
           5.14.3 BARGAINING POWER OF SUPPLIERS
           5.14.4 BARGAINING POWER OF BUYERS
           5.14.5 INTENSITY OF COMPETITIVE RIVALRY
    5.15 KEY STAKEHOLDERS AND BUYING CRITERIA 
           5.15.1 KEY STAKEHOLDERS IN BUYING PROCESS
                    FIGURE 33 INFLUENCE OF STAKEHOLDERS ON BUYING PROCESS FOR END USERS
                    TABLE 17 INFLUENCE OF STAKEHOLDERS ON BUYING PROCESS FOR END USERS (%)
           5.15.2 BUYING CRITERIA
                    FIGURE 34 KEY BUYING CRITERIA FOR END USERS
                    TABLE 18 KEY BUYING CRITERIA FOR END USERS
 
6 BATTERY ANALYSIS (Page No. - 85)
    6.1 INTRODUCTION 
    6.2 BATTERY-POWERED EQUIPMENT: CHARACTERISTICS AND TRENDS 
           6.2.1 INCREASING MANUFACTURER FOCUS ON R&D
    6.3 BATTERY-POWERED EQUIPMENT: MARKET ANALYSIS 
           6.3.1 GROWING EFFORTS BY MANUFACTURERS TO DEVELOP NEW BATTERY TECHNOLOGIES
           FIGURE 35 PRICING DIFFERENCE FOR OUTDOOR POWER EQUIPMENT MANUFACTURER MANUFACTURING BATTERIES
           FIGURE 36 PRICING DIFFERENCE FOR OUTDOOR POWER EQUIPMENT MANUFACTURER OUTSOURCING BATTERIES
 
7 OUTDOOR POWER EQUIPMENT MARKET, BY EQUIPMENT TYPE (Page No. - 88)
    7.1 INTRODUCTION 
           FIGURE 37 OUTDOOR POWER EQUIPMENT MARKET, BY EQUIPMENT TYPE
           FIGURE 38 LAWN MOWERS TO DOMINATE MARKET DURING FORECAST PERIOD
           TABLE 19 OUTDOOR POWER EQUIPMENT MARKET, BY EQUIPMENT TYPE, 2020–2023 (USD MILLION)
           TABLE 20 OUTDOOR POWER EQUIPMENT MARKET, BY EQUIPMENT TYPE, 2024–2029 (USD MILLION)
           TABLE 21 OUTDOOR POWER EQUIPMENT MARKET, BY EQUIPMENT TYPE, 2020–2023 (MILLION UNITS)
           TABLE 22 OUTDOOR POWER EQUIPMENT MARKET, BY EQUIPMENT TYPE, 2024–2029 (MILLION UNITS)
    7.2 LAWN MOWERS 
           TABLE 23 LAWN MOWERS: OUTDOOR POWER EQUIPMENT MARKET, BY TYPE, 2020–2023 (USD MILLION)
           TABLE 24 LAWN MOWERS: OUTDOOR POWER EQUIPMENT MARKET, BY TYPE, 2024–2029 (USD MILLION)
           TABLE 25 LAWN MOWERS: OUTDOOR POWER EQUIPMENT MARKET, BY APPLICATION, 2020–2023 (USD MILLION)
           TABLE 26 LAWN MOWERS: OUTDOOR POWER EQUIPMENT MARKET, BY APPLICATION, 2024–2029 (USD MILLION)
           TABLE 27 LAWN MOWERS: OUTDOOR POWER EQUIPMENT MARKET, BY POWER SOURCE, 2020–2023 (USD MILLION)
           TABLE 28 OUTDOOR POWER EQUIPMENT MARKET FOR LAWN MOWERS, BY POWER SOURCE, 2024–2029 (USD MILLION)
           TABLE 29 LAWN MOWERS: OUTDOOR POWER EQUIPMENT MARKET, BY REGION, 2020–2023 (USD MILLION)
           TABLE 30 LAWN MOWERS: OUTDOOR POWER EQUIPMENT MARKET, BY REGION, 2024–2029 (USD MILLION)
           7.2.1 RIDING LAWN MOWERS
                    TABLE 31 RIDING LAWN MOWERS: OUTDOOR POWER EQUIPMENT MARKET, BY TYPE, 2020–2023 (USD MILLION)
                    TABLE 32 RIDING LAWN MOWERS: OUTDOOR POWER EQUIPMENT MARKET, BY TYPE, 2024–2029 (USD MILLION)
                    TABLE 33 RIDING LAWN MOWERS: OUTDOOR POWER EQUIPMENT MARKET, BY POWER SOURCE, 2020–2023 (USD MILLION)
                    TABLE 34 RIDING LAWN MOWERS: OUTDOOR POWER EQUIPMENT MARKET, BY POWER SOURCE, 2024–2029 (USD MILLION)
                    TABLE 35 RIDING LAWN MOWERS: OUTDOOR POWER EQUIPMENT MARKET, BY APPLICATION, 2020–2023 (USD MILLION)
                    TABLE 36 RIDING LAWN MOWERS: OUTDOOR POWER EQUIPMENT MARKET, BY APPLICATION, 2024–2029 (USD MILLION)
                    7.2.1.1 Rear engine riding mowers
                               7.2.1.1.1 Equipped with less powerful engines
                    7.2.1.2 Lawn tractors and garden tractors
                               7.2.1.2.1 Most common type of lawn mowers
                    7.2.1.3 Zero-turn Radius Mowers (ZTRs)
                               7.2.1.3.1 Easy to maneuver around obstacles
           7.2.2 NON-RIDING LAWN MOWERS
                    TABLE 37 NON-RIDING LAWN MOWERS: OUTDOOR POWER EQUIPMENT MARKET, BY TYPE, 2020–2023 (USD MILLION)
                    TABLE 38 NON-RIDING LAWN MOWERS: OUTDOOR POWER EQUIPMENT MARKET, BY TYPE, 2024–2029 (USD MILLION)
                    TABLE 39 NON-RIDING LAWN MOWERS: OUTDOOR POWER EQUIPMENT MARKET, BY POWER SOURCE, 2020–2023 (USD MILLION)
                    TABLE 40 NON-RIDING LAWN MOWERS: OUTDOOR POWER EQUIPMENT MARKET, BY POWER SOURCE, 2024–2029 (USD MILLION)
                    TABLE 41 NON-RIDING LAWN MOWERS: OUTDOOR POWER EQUIPMENT MARKET, BY APPLICATION, 2020–2023 (USD MILLION)
                    TABLE 42 NON-RIDING LAWN MOWERS: OUTDOOR POWER EQUIPMENT MARKET, BY APPLICATION, 2024–2029 (USD MILLION)
                    7.2.2.1 Walk-behind lawn mowers
                               7.2.2.1.1 Push mowers
                                             7.2.2.1.1.1 Designed for flat yards
                               7.2.2.1.2 Self-propelled mowers
                                             7.2.2.1.2.1 Ideal for maintenance of large yards
                    7.2.2.2 Robotic lawn mowers
                               7.2.2.2.1 Function without human intervention
                                            TABLE 43 ROBOTIC LAWN MOWERS: OUTDOOR POWER EQUIPMENT MARKET, BY APPLICATION, 2020–2023 (USD MILLION)
                                            TABLE 44 ROBOTIC LAWN MOWERS: OUTDOOR POWER EQUIPMENT MARKET, BY APPLICATION, 2024–2029 (USD MILLION)
                                            TABLE 45 ROBOTIC LAWN MOWERS: OUTDOOR POWER EQUIPMENT MARKET, BY REGION, 2020–2023 (USD MILLION)
                                            TABLE 46 OUTDOOR POWER EQUIPMENT MARKET FOR ROBOTIC LAWN MOWERS, BY REGION, 2024–2029 (USD MILLION)
    7.3 SAWS 
           7.3.1 CHAINSAWS
                    7.3.1.1 Widespread use in forestry sector
                               TABLE 47 SAWS: OUTDOOR POWER EQUIPMENT MARKET, BY APPLICATION, 2020–2023 (USD MILLION)
                               TABLE 48 SAWS: OUTDOOR POWER EQUIPMENT MARKET, BY APPLICATION, 2024–2029 (USD MILLION)
                               TABLE 49 SAWS: OUTDOOR POWER EQUIPMENT MARKET, BY POWER SOURCE, 2020–2023 (USD MILLION)
                               TABLE 50 SAWS: OUTDOOR POWER EQUIPMENT MARKET, BY POWER SOURCE, 2024–2029 (USD MILLION)
                               TABLE 51 SAWS: OUTDOOR POWER EQUIPMENT MARKET, BY REGION, 2020–2023 (USD MILLION)
                               TABLE 52 SAWS: OUTDOOR POWER EQUIPMENT MARKET, BY REGION, 2024–2029 (USD MILLION)
    7.4 TRIMMERS & EDGERS 
           TABLE 53 TRIMMERS & EDGERS: OUTDOOR POWER EQUIPMENT MARKET, BY APPLICATION, 2020–2023 (USD MILLION)
           TABLE 54 TRIMMERS & EDGERS: OUTDOOR POWER EQUIPMENT MARKET, BY APPLICATION, 2024–2029 (USD MILLION)
           TABLE 55 TRIMMERS & EDGERS: OUTDOOR POWER EQUIPMENT MARKET, BY POWER SOURCE, 2020–2023 (USD MILLION)
           TABLE 56 TRIMMERS & EDGERS: OUTDOOR POWER EQUIPMENT MARKET, BY POWER SOURCE, 2024–2029 (USD MILLION)
           TABLE 57 TRIMMERS & EDGERS: OUTDOOR POWER EQUIPMENT MARKET, BY REGION, 2020–2023 (USD MILLION)
           TABLE 58 TRIMMERS & EDGERS: OUTDOOR POWER EQUIPMENT MARKET, BY REGION, 2024–2029 (USD MILLION)
           7.4.1 TRIMMERS & BRUSH CUTTERS
                    7.4.1.1 Growing demand by homeowners for garden maintenance
           7.4.2 HEDGE TRIMMERS
                    7.4.2.1 Gas-powered hedge trimmers favored by residential users
           7.4.3 WALK-BEHIND EDGERS & TRIMMERS
                    7.4.3.1 Rising demand for fuel-based walk-behind trimmers
    7.5 BLOWERS 
           TABLE 59 BLOWERS: OUTDOOR POWER EQUIPMENT MARKET, BY APPLICATION, 2020–2023 (USD MILLION)
           TABLE 60 BLOWERS: OUTDOOR POWER EQUIPMENT MARKET, BY APPLICATION, 2024–2029 (USD MILLION)
           TABLE 61 BLOWERS: OUTDOOR POWER EQUIPMENT MARKET, BY POWER SOURCE, 2020–2023 (USD MILLION)
           TABLE 62 BLOWERS: OUTDOOR POWER EQUIPMENT MARKET, BY POWER SOURCE, 2024–2029 (USD MILLION)
           TABLE 63 BLOWERS: OUTDOOR POWER EQUIPMENT MARKET, BY REGION, 2020–2023 (USD MILLION)
           TABLE 64 BLOWERS: OUTDOOR POWER EQUIPMENT MARKET, BY REGION, 2024–2029 (USD MILLION)
           7.5.1 BACKPACK
                    7.5.1.1 Increasingly preferred by professional users
           7.5.2 HANDHELD
                    7.5.2.1 Battery-powered handheld blowers see high demand
    7.6 TILLERS & CULTIVATORS 
           7.6.1 RISING DEMAND FOR USE IN RESIDENTIAL APPLICATIONS
                    TABLE 65 TILLERS & CULTIVATORS: OUTDOOR POWER EQUIPMENT MARKET, BY APPLICATION, 2020–2023 (USD MILLION)
                    TABLE 66 TILLERS & CULTIVATORS: OUTDOOR POWER EQUIPMENT MARKET, BY APPLICATION, 2024–2029 (USD MILLION)
                    TABLE 67 TILLERS & CULTIVATORS: OUTDOOR POWER EQUIPMENT MARKET, BY POWER SOURCE, 2020–2023 (USD MILLION)
                    TABLE 68 TILLERS & CULTIVATORS: OUTDOOR POWER EQUIPMENT MARKET, BY POWER SOURCE, 2024–2029 (USD MILLION)
                    TABLE 69 TILLERS & CULTIVATORS: OUTDOOR POWER EQUIPMENT MARKET, BY REGION, 2020–2023 (USD MILLION)
                    TABLE 70 TILLERS & CULTIVATORS: OUTDOOR POWER EQUIPMENT MARKET, BY REGION, 2024–2029 (USD MILLION)
    7.7 SNOW THROWERS 
           7.7.1 SIGNIFICANT DEMAND IN EUROPE AND NORTH AMERICA
                    TABLE 71 SNOW THROWERS: OUTDOOR POWER EQUIPMENT MARKET, BY APPLICATION, 2020–2023 (USD MILLION)
                    TABLE 72 SNOW THROWERS: OUTDOOR POWER EQUIPMENT MARKET, BY APPLICATION, 2024–2029 (USD MILLION)
                    TABLE 73 SNOW THROWERS: OUTDOOR POWER EQUIPMENT MARKET, BY POWER SOURCE, 2020–2023 (USD MILLION)
                    TABLE 74 SNOW THROWERS: OUTDOOR POWER EQUIPMENT MARKET, BY POWER SOURCE, 2024–2029 (USD MILLION)
                    TABLE 75 SNOW THROWERS: OUTDOOR POWER EQUIPMENT MARKET, BY REGION, 2020–2023 (USD MILLION)
                    TABLE 76 SNOW THROWERS: OUTDOOR POWER EQUIPMENT MARKET, BY REGION, 2024–2029 (USD MILLION)
    7.8 OTHERS 
           TABLE 77 OTHERS: OUTDOOR POWER EQUIPMENT MARKET, BY APPLICATION, 2020–2023 (USD MILLION)
           TABLE 78 OTHERS: OUTDOOR POWER EQUIPMENT MARKET, BY APPLICATION, 2024–2029 (USD MILLION)
           TABLE 79 OTHERS: OUTDOOR POWER EQUIPMENT MARKET, BY POWER SOURCE, 2020–2023 (USD MILLION)
           TABLE 80 OTHERS: OUTDOOR POWER EQUIPMENT MARKET, BY POWER SOURCE, 2024–2029 (USD MILLION)
           TABLE 81 OTHERS: OUTDOOR POWER EQUIPMENT MARKET, BY REGION, 2020–2023 (USD MILLION)
           TABLE 82 OTHERS: OUTDOOR POWER EQUIPMENT MARKET, BY REGION, 2024–2029 (USD MILLION)
 
8 OUTDOOR POWER EQUIPMENT MARKET, BY APPLICATION (Page No. - 117)
    8.1 INTRODUCTION 
           FIGURE 39 OUTDOOR POWER EQUIPMENT MARKET, BY APPLICATION
           FIGURE 40 RESIDENTIAL/DIY APPLICATION TO LEAD MARKET DURING FORECAST PERIOD
           TABLE 83 OUTDOOR POWER EQUIPMENT MARKET, BY APPLICATION, 2020–2023 (USD MILLION)
           TABLE 84 OUTDOOR POWER EQUIPMENT MARKET, BY APPLICATION, 2024–2029 (USD MILLION)
    8.2 COMMERCIAL 
           8.2.1 INCREASING CONSTRUCTION ACTIVITIES TO PROPEL MARKET GROWTH
                    TABLE 85 COMMERCIAL: OUTDOOR POWER EQUIPMENT MARKET, BY EQUIPMENT TYPE, 2020–2023 (USD MILLION)
                    TABLE 86 COMMERCIAL: OUTDOOR POWER EQUIPMENT MARKET, BY EQUIPMENT TYPE, 2024–2029 (USD MILLION)
                    TABLE 87 COMMERCIAL: OUTDOOR POWER EQUIPMENT MARKET, BY REGION, 2020–2023 (USD MILLION)
                    TABLE 88 COMMERCIAL: OUTDOOR POWER EQUIPMENT MARKET, BY REGION, 2024–2029 (USD MILLION)
    8.3 RESIDENTIAL/DIY 
           8.3.1 GROWING POPULARITY OF DIY GARDENING CULTURE TO DRIVE MARKET
                    TABLE 89 RESIDENTIAL/DIY: OUTDOOR POWER EQUIPMENT MARKET, BY EQUIPMENT TYPE, 2020–2023 (USD MILLION)
                    TABLE 90 RESIDENTIAL/DIY: OUTDOOR POWER EQUIPMENT MARKET, BY EQUIPMENT TYPE, 2024–2029 (USD MILLION)
                    TABLE 91 RESIDENTIAL/DIY: OUTDOOR POWER EQUIPMENT MARKET, BY REGION, 2020–2023 (USD MILLION)
                    TABLE 92 RESIDENTIAL/DIY: OUTDOOR POWER EQUIPMENT MARKET, BY REGION, 2024–2029 (USD MILLION)
 
9 OUTDOOR POWER EQUIPMENT MARKET, BY POWER SOURCE (Page No. - 124)
    9.1 INTRODUCTION 
           FIGURE 41 OUTDOOR POWER EQUIPMENT MARKET, BY POWER SOURCE
           FIGURE 42 FUEL-BASED SEGMENT TO DOMINATE MARKET DURING FORECAST PERIOD
           TABLE 93 OUTDOOR POWER EQUIPMENT MARKET, BY POWER SOURCE, 2020–2023 (USD MILLION)
           TABLE 94 OUTDOOR POWER EQUIPMENT MARKET, BY POWER SOURCE, 2024–2029 (USD MILLION)
    9.2 FUEL-BASED 
           9.2.1 POPULARITY OF GAS-POWERED EQUIPMENT TO DRIVE MARKET
                    TABLE 95 FUEL-BASED: OUTDOOR POWER EQUIPMENT MARKET, BY EQUIPMENT TYPE, 2020–2023 (USD MILLION)
                    TABLE 96 FUEL-BASED: OUTDOOR POWER EQUIPMENT MARKET, BY EQUIPMENT TYPE, 2024–2029 (USD MILLION)
                    TABLE 97 FUEL-BASED: OUTDOOR POWER EQUIPMENT MARKET, BY REGION, 2020–2023 (USD MILLION)
                    TABLE 98 FUEL-BASED: OUTDOOR POWER EQUIPMENT MARKET, BY REGION, 2024–2029 (USD MILLION)
    9.3 ELECTRIC 
           TABLE 99 ELECTRIC: OUTDOOR POWER EQUIPMENT MARKET, BY EQUIPMENT TYPE, 2020–2023 (USD MILLION)
           TABLE 100 ELECTRIC: OUTDOOR POWER EQUIPMENT MARKET, BY EQUIPMENT TYPE, 2024–2029 (USD MILLION)
           TABLE 101 ELECTRIC: OUTDOOR POWER EQUIPMENT MARKET, BY REGION, 2020–2023 (USD MILLION)
           TABLE 102 ELECTRIC: OUTDOOR POWER EQUIPMENT MARKET, BY REGION, 2024–2029 (USD MILLION)
           TABLE 103 ELECTRIC: OUTDOOR POWER EQUIPMENT MARKET, BY TYPE, 2020–2023 (USD MILLION)
           TABLE 104 ELECTRIC: OUTDOOR POWER EQUIPMENT MARKET, BY TYPE, 2024–2029 (USD MILLION)
           9.3.1 CORDED
                    9.3.1.1 Offers more torque than cordless counterparts
           9.3.2 CORDLESS
                    9.3.2.1 Lightweight and easy to use
 
10 OUTDOOR POWER EQUIPMENT MARKET, BY FUNCTIONALITY (Page No. - 132)
     10.1 INTRODUCTION 
             FIGURE 43 OUTDOOR POWER EQUIPMENT MARKET, BY FUNCTIONALITY
             FIGURE 44 CONVENTIONAL PRODUCTS HOLD LARGER SHARE OF OUTDOOR POWER EQUIPMENT MARKET
     10.2 CONVENTIONAL PRODUCTS 
             10.2.1 GREATER RANGE AND VERSATILITY TO BOOST MARKET
     10.3 CONNECTED/SMART PRODUCTS 
             10.3.1 INCORPORATION OF ARTIFICIAL INTELLIGENCE AND ROBOTICS TO DRIVE DEMAND
 
11 OUTDOOR POWER EQUIPMENT MARKET, BY REGION (Page No. - 134)
     11.1 INTRODUCTION 
             FIGURE 45 INDIAN MARKET TO RECORD HIGHEST GROWTH DURING FORECAST PERIOD
             FIGURE 46 NORTH AMERICA TO LEAD MARKET DURING FORECAST PERIOD
             TABLE 105 OUTDOOR POWER EQUIPMENT MARKET, BY REGION, 2020–2023 (USD MILLION)
             TABLE 106 OUTDOOR POWER EQUIPMENT MARKET, BY REGION, 2024–2029 (USD MILLION)
     11.2 NORTH AMERICA 
             11.2.1 IMPACT OF RECESSION ON NORTH AMERICA
                        FIGURE 47 NORTH AMERICA: OUTDOOR POWER EQUIPMENT MARKET SNAPSHOT
                        TABLE 107 NORTH AMERICA: OUTDOOR POWER EQUIPMENT MARKET, BY COUNTRY, 2020–2023 (USD MILLION)
                        TABLE 108 NORTH AMERICA: OUTDOOR POWER EQUIPMENT MARKET, BY COUNTRY, 2024–2029 (USD MILLION)
                        TABLE 109 NORTH AMERICA: OUTDOOR POWER EQUIPMENT MARKET, BY EQUIPMENT TYPE, 2020–2023 (USD MILLION)
                        TABLE 110 NORTH AMERICA: OUTDOOR POWER EQUIPMENT MARKET, BY EQUIPMENT TYPE, 2024–2029 (USD MILLION)
                        TABLE 111 NORTH AMERICA: OUTDOOR POWER EQUIPMENT MARKET, BY APPLICATION, 2020–2023 (USD MILLION)
                        TABLE 112 NORTH AMERICA: OUTDOOR POWER EQUIPMENT MARKET, BY APPLICATION, 2024–2029 (USD MILLION)
                        TABLE 113 NORTH AMERICA: OUTDOOR POWER EQUIPMENT MARKET, BY POWER SOURCE, 2020–2023 (USD MILLION)
                        TABLE 114 NORTH AMERICA: OUTDOOR POWER EQUIPMENT MARKET, BY POWER SOURCE, 2024–2029 (USD MILLION)
             11.2.2 US
                        11.2.2.1 Growing popularity of DIY projects to drive market
             11.2.3 CANADA
                        11.2.3.1 Technological advancements to aid market growth
             11.2.4 MEXICO
                        11.2.4.1 Growth in residential construction to drive demand
     11.3 EUROPE 
             11.3.1 IMPACT OF RECESSION ON EUROPE
                        FIGURE 48 EUROPE: OUTDOOR POWER EQUIPMENT MARKET SNAPSHOT
                        TABLE 115 EUROPE: OUTDOOR POWER EQUIPMENT MARKET, BY COUNTRY, 2020–2023 (USD MILLION)
                        TABLE 116 EUROPE: OUTDOOR POWER EQUIPMENT MARKET, BY COUNTRY, 2024–2029 (USD MILLION)
                        TABLE 117 EUROPE: OUTDOOR POWER EQUIPMENT MARKET, BY EQUIPMENT TYPE, 2020–2023 (USD MILLION)
                        TABLE 118 OUTDOOR POWER EQUIPMENT MARKET IN EUROPE, BY EQUIPMENT TYPE, 2024–2029 (USD MILLION)
                        TABLE 119 EUROPE: OUTDOOR POWER EQUIPMENT MARKET, BY APPLICATION, 2020–2023 (USD MILLION)
                        TABLE 120 EUROPE: OUTDOOR POWER EQUIPMENT MARKET, BY APPLICATION, 2024–2029 (USD MILLION)
                        TABLE 121 EUROPE: OUTDOOR POWER EQUIPMENT MARKET, BY POWER SOURCE, 2020–2023 (USD MILLION)
                        TABLE 122 EUROPE: OUTDOOR POWER EQUIPMENT MARKET, BY POWER SOURCE, 2024–2029 (USD MILLION)
             11.3.2 GERMANY
                        11.3.2.1 Rising demand for battery-powered solutions to drive market
             11.3.3 FRANCE
                        11.3.3.1 Large number of parks and outdoor tourist attractions to drive demand
             11.3.4 UK
                        11.3.4.1 High demand in construction industry to fuel market
             11.3.5 REST OF EUROPE
     11.4 ASIA PACIFIC 
             11.4.1 IMPACT OF RECESSION ON ASIA PACIFIC
                        FIGURE 49 SNAPSHOT: OUTDOOR POWER EQUIPMENT MARKET IN ASIA PACIFIC
                        TABLE 123 ASIA PACIFIC: OUTDOOR POWER EQUIPMENT MARKET, BY COUNTRY, 2020–2023 (USD MILLION)
                        TABLE 124 ASIA PACIFIC: OUTDOOR POWER EQUIPMENT MARKET, BY COUNTRY, 2024–2029 (USD MILLION)
                        TABLE 125 ASIA PACIFIC: OUTDOOR POWER EQUIPMENT MARKET, BY EQUIPMENT TYPE, 2020–2023 (USD MILLION)
                        TABLE 126 ASIA PACIFIC: OUTDOOR POWER EQUIPMENT MARKET, BY EQUIPMENT TYPE, 2024–2029 (USD MILLION)
                        TABLE 127 ASIA PACIFIC: OUTDOOR POWER EQUIPMENT MARKET, BY APPLICATION, 2020–2023 (USD MILLION)
                        TABLE 128 ASIA PACIFIC: OUTDOOR POWER EQUIPMENT MARKET, BY APPLICATION, 2024–2029 (USD MILLION)
                        TABLE 129 ASIA PACIFIC: OUTDOOR POWER EQUIPMENT MARKET, BY POWER SOURCE, 2020–2023 (USD MILLION)
                        TABLE 130 ASIA PACIFIC: OUTDOOR POWER EQUIPMENT MARKET, BY POWER SOURCE, 2024–2029 (USD MILLION)
             11.4.2 JAPAN
                        11.4.2.1 Presence of major manufacturers to support market
             11.4.3 CHINA
                        11.4.3.1 Growing construction sector to offer significant opportunities for market
             11.4.4 SOUTH KOREA
                        11.4.4.1 Well-established gardening and lawn culture to propel demand
             11.4.5 INDIA
                        11.4.5.1 Rising disposable income to drive market
             11.4.6 REST OF ASIA PACIFIC
     11.5 REST OF THE WORLD (ROW) 
             11.5.1 IMPACT OF RECESSION ON REST OF THE WORLD
                        TABLE 131 ROW: OUTDOOR POWER EQUIPMENT MARKET, BY COUNTRY, 2020–2023 (USD MILLION)
                        TABLE 132 ROW: OUTDOOR POWER EQUIPMENT MARKET, BY COUNTRY, 2024–2029 (USD MILLION)
                        TABLE 133 ROW: OUTDOOR POWER EQUIPMENT MARKET, BY EQUIPMENT TYPE, 2020–2023 (USD MILLION)
                        TABLE 134 ROW: OUTDOOR POWER EQUIPMENT MARKET, BY EQUIPMENT TYPE, 2024–2029 (USD MILLION)
                        TABLE 135 ROW: OUTDOOR POWER EQUIPMENT MARKET, BY APPLICATION, 2020–2023 (USD MILLION)
                        TABLE 136 ROW: OUTDOOR POWER EQUIPMENT MARKET, BY APPLICATION, 2024–2029 (USD MILLION)
                        TABLE 137 ROW: OUTDOOR POWER EQUIPMENT MARKET, BY POWER SOURCE, 2020–2023 (USD MILLION)
                        TABLE 138 ROW: OUTDOOR POWER EQUIPMENT MARKET, BY POWER SOURCE, 2024–2029 (USD MILLION)
             11.5.2 SOUTH AMERICA
                        11.5.2.1 Government initiatives to drive market
             11.5.3 GULF COOPERATION COUNCIL (GCC) COUNTRIES
                        11.5.3.1 Increasing construction activities to boost demand
             11.5.4 AFRICA & REST OF MIDDLE EAST
                        11.5.4.1 Rising investments in infrastructure development to drive market
 
12 COMPETITIVE LANDSCAPE (Page No. - 158)
     12.1 INTRODUCTION 
     12.2 STRATEGIES ADOPTED BY KEY PLAYERS/RIGHT TO WIN 
             TABLE 139 OVERVIEW OF STRATEGIES DEPLOYED BY KEY PLAYERS IN OUTDOOR POWER EQUIPMENT MARKET (2021–2023)
     12.3 REVENUE ANALYSIS OF TOP MARKET PLAYERS 
             FIGURE 50 FIVE-YEAR REVENUE ANALYSIS OF KEY MARKET PLAYERS
     12.4 MARKET SHARE ANALYSIS 
             TABLE 140 OUTDOOR POWER EQUIPMENT MARKET: DEGREE OF COMPETITION
             FIGURE 51 MARKET SHARE ANALYSIS OF TOP PLAYERS, 2023
     12.5 COMPANY VALUATION AND FINANCIAL METRICS 
             FIGURE 52 COMPANY VALUATION (USD BILLION), 2022
             FIGURE 53 FINANCIAL METRICS (EV/EBITDA), 2022
     12.6 BRAND/PRODUCT COMPARISON 
             FIGURE 54 BRAND/PRODUCT COMPARISON
     12.7 COMPETITIVE EVALUATION MATRIX, 2023 
             12.7.1 STARS
             12.7.2 EMERGING LEADERS
             12.7.3 PERVASIVE PLAYERS
             12.7.4 PARTICIPANTS
                        FIGURE 55 OUTDOOR POWER EQUIPMENT MARKET: COMPANY EVALUATION MATRIX, 2023
             12.7.5 OUTDOOR POWER EQUIPMENT MARKET: COMPANY FOOTPRINT
                        TABLE 141 COMPANY PRODUCT FOOTPRINT
                        TABLE 142 POWER SOURCE FOOTPRINT
                        TABLE 143 COMPANY APPLICATION FOOTPRINT
                        TABLE 144 COMPANY REGION FOOTPRINT
                        FIGURE 56 COMPANY FOOTPRINT
     12.8 SMALL AND MEDIUM-SIZED ENTERPRISES (SME) EVALUATION MATRIX, 2023 
             12.8.1 PROGRESSIVE COMPANIES
             12.8.2 RESPONSIVE COMPANIES
             12.8.3 DYNAMIC COMPANIES
             12.8.4 STARTING BLOCKS
                        FIGURE 57 OUTDOOR POWER EQUIPMENT MARKET: SME EVALUATION MATRIX, 2023
             12.8.5 COMPETITIVE BENCHMARKING
                        TABLE 145 OUTDOOR POWER EQUIPMENT: KEY STARTUPS/SMES
                        TABLE 146 COMPETITIVE BENCHMARKING OF KEY STARTUPS/SMES
     12.9 COMPETITIVE SITUATIONS AND TRENDS 
             12.9.1 PRODUCT LAUNCHES
                        TABLE 147 OUTDOOR POWER EQUIPMENT MARKET: PRODUCT LAUNCHES, 2022–2023
             12.9.2 DEALS
                        TABLE 148 OUTDOOR POWER EQUIPMENT MARKET: DEALS, 2022–2023
 
13 COMPANY PROFILES (Page No. - 180)
(Business Overview, Products/Services/Solutions Offered, Recent Developments, and MnM View (Key strengths/Right to Win, Strategic Choices Made, and Weaknesses and Competitive Threats))*  
     13.1 KEY PLAYERS 
             13.1.1 HUSQVARNA GROUP
                        TABLE 149 HUSQVARNA GROUP: COMPANY OVERVIEW
                        FIGURE 58 HUSQVARNA GROUP: COMPANY SNAPSHOT
                        TABLE 150 HUSQVARNA GROUP: PRODUCTS/SERVICES/SOLUTIONS OFFERED
                        TABLE 151 HUSQVARNA GROUP: PRODUCT LAUNCHES
                        TABLE 152 HUSQVARNA GROUP: DEALS
             13.1.2 THE TORO COMPANY
                        TABLE 153 THE TORO COMPANY: COMPANY OVERVIEW
                        FIGURE 59 THE TORO COMPANY: COMPANY SNAPSHOT
                        TABLE 154 THE TORO COMPANY: PRODUCTS/SERVICES/SOLUTIONS OFFERED
                        TABLE 155 THE TORO COMPANY: PRODUCT LAUNCHES
                        TABLE 156 THE TORO COMPANY: DEALS
             13.1.3 DEERE & COMPANY
                        TABLE 157 DEERE & COMPANY: COMPANY OVERVIEW
                        FIGURE 60 DEERE & COMPANY: COMPANY SNAPSHOT
                        TABLE 158 DEERE & COMPANY: PRODUCTS/SERVICES/SOLUTIONS OFFERED
                        TABLE 159 DEERE & COMPANY: PRODUCT LAUNCHES
                        TABLE 160 DEERE & COMPANY: DEALS
             13.1.4 STANLEY BLACK & DECKER, INC.
                        TABLE 161 STANLEY BLACK & DECKER, INC.: COMPANY OVERVIEW
                        FIGURE 61 STANLEY BLACK & DECKER, INC.: COMPANY SNAPSHOT
                        TABLE 162 STANLEY BLACK & DECKER, INC.: PRODUCTS/SERVICES/SOLUTIONS OFFERED
                        TABLE 163 STANLEY BLACK & DECKER, INC.: PRODUCT LAUNCHES
                        TABLE 164 STANLEY BLACK & DECKER, INC.: DEALS
             13.1.5 ANDREAS STIHL AG & CO. KG
                        TABLE 165 ANDREAS STIHL AG & CO. KG: COMPANY OVERVIEW
                        TABLE 166 ANDREAS STIHL AG & CO. KG: PRODUCTS/SERVICES/SOLUTIONS OFFERED
                        TABLE 167 ANDREAS STIHL AG & CO. KG: DEALS
             13.1.6 TECHTRONIC INDUSTRIES CO. LTD.
                        TABLE 168 TECHTRONIC INDUSTRIES CO. LTD.: COMPANY OVERVIEW
                        FIGURE 62 TECHTRONIC INDUSTRIES CO. LTD.: COMPANY SNAPSHOT
                        TABLE 169 TECHTRONIC INDUSTRIES CO. LTD.: PRODUCTS/SERVICES/SOLUTIONS OFFERED
                        TABLE 170 TECHTRONIC INDUSTRIES CO. LTD.: PRODUCT LAUNCHES AND DEVELOPMENTS
             13.1.7 HONDA MOTOR CO., LTD.
                        TABLE 171 HONDA MOTOR CO., LTD.: COMPANY OVERVIEW
                        FIGURE 63 HONDA MOTOR CO., LTD.: COMPANY SNAPSHOT
                        TABLE 172 HONDA MOTOR CO., LTD.: PRODUCTS/SERVICES/SOLUTIONS OFFERED
             13.1.8 YAMABIKO CORPORATION
                        TABLE 173 YAMABIKO CORPORATION: COMPANY OVERVIEW
                        FIGURE 64 YAMABIKO CORPORATION: COMPANY SNAPSHOT
                        TABLE 174 YAMABIKO CORPORATION: PRODUCTS/SERVICES/SOLUTIONS OFFERED
                        TABLE 175 YAMABIKO CORPORATION: PRODUCT LAUNCHES AND DEVELOPMENTS
             13.1.9 MAKITA CORPORATION
                        TABLE 176 MAKITA CORPORATION: COMPANY OVERVIEW
                        FIGURE 65 MAKITA CORPORATION: COMPANY SNAPSHOT
                        TABLE 177 MAKITA CORPORATION: PRODUCTS/SERVICES/SOLUTIONS OFFERED
                        TABLE 178 MAKITA CORPORATION: PRODUCT LAUNCHES AND DEVELOPMENTS
             13.1.10 ROBERT BOSCH GMBH
                        TABLE 179 ROBERT BOSCH GMBH: COMPANY OVERVIEW
                        FIGURE 66 ROBERT BOSCH GMBH: COMPANY SNAPSHOT
                        TABLE 180 ROBERT BOSCH GMBH: PRODUCTS/SERVICES/SOLUTIONS OFFERED
                        TABLE 181 ROBERT BOSCH: PRODUCT LAUNCHES AND DEVELOPMENTS
                        TABLE 182 ROBERT BOSCH GMBH: DEALS
     13.2 OTHER PLAYERS 
             13.2.1 BRIGGS & STRATTON
                        TABLE 183 BRIGGS & STRATTON: COMPANY OVERVIEW
             13.2.2 EMAK S.P.A.
                        TABLE 184 EMAK S.P.A.: COMPANY OVERVIEW
             13.2.3 AL-KO GMBH
                        TABLE 185 AL-KO GMBH: COMPANY OVERVIEW
             13.2.4 ARIENS
                        TABLE 186 ARIENS: COMPANY OVERVIEW
             13.2.5 STIGA S.P.A.
                        TABLE 187 STIGA S.P.A.: COMPANY OVERVIEW
             13.2.6 KOKI HOLDINGS CO., LTD.
                        TABLE 188 KOKI HOLDINGS CO., LTD.: COMPANY OVERVIEW
             13.2.7 ALFRED KÄRCHER SE & CO. KG
                        TABLE 189 ALFRED KÄRCHER SE & CO. KG: COMPANY OVERVIEW
             13.2.8 SCHILLER GROUNDS CARE, INC.
                        TABLE 190 SCHILLER GROUNDS CARE, INC.: COMPANY OVERVIEW
             13.2.9 EXCEL INDUSTRIES INC.
                        TABLE 191 EXCEL INDUSTRIES INC.: COMPANY OVERVIEW
             13.2.10 CHERVON (CHINA) TRADING CO., LTD.
                        TABLE 192 CHERVON (CHINA) TRADING CO., LTD.: COMPANY OVERVIEW
             13.2.11 JACOBSEN
                        TABLE 193 JACOBSEN: COMPANY OVERVIEW
             13.2.12 SNOW JOE, LLC.
                        TABLE 194 ALL SEASON POWER LLC. (SNOW JOE): COMPANY OVERVIEW
             13.2.13 NINGBO DAYE GARDEN MACHINERY CO., LTD
                        TABLE 195 NINGBO DAYE GARDEN MACHINERY CO., LTD: COMPANY OVERVIEW
             13.2.14 GREENWORKSTOOLS
                        TABLE 196 GREENWORKSTOOLS: COMPANY OVERVIEW
             13.2.15 CHAMPION POWER EQUIPMENT
                        TABLE 197 CHAMPION POWER EQUIPMENT: COMPANY OVERVIEW
 *Details on Business Overview, Products/Services/Solutions Offered, Recent Developments, and MnM View (Key strengths/Right to Win, Strategic Choices Made, and Weaknesses and Competitive Threats) might not be captured in case of unlisted companies.  
 
14 ADJACENT AND RELATED MARKETS (Page No. - 240)
     14.1 INTRODUCTION 
     14.2 POWER TOOLS MARKET, BY TYPE 
             14.2.1 INTRODUCTION
                        TABLE 198 POWER TOOLS MARKET, BY TOOL TYPE, 2018–2021 (USD MILLION)
                        TABLE 199 POWER TOOLS MARKET, BY TOOL TYPE, 2022–2027 (USD MILLION)
                        TABLE 200 POWER TOOLS MARKET SHIPMENT, 2018–2021 (MILLION UNITS)
                        TABLE 201 POWER TOOLS MARKET SHIPMENT, 2022–2027 (MILLION UNITS)
             14.2.2 DRILLING & FASTENING TOOLS
                        14.2.2.1 Drills
                                     14.2.2.1.1 Growing demand for cordless drills to drive market
                        14.2.2.2 Impact drivers
                                     14.2.2.2.1 Rising adoption of impact drivers to boost market
                        14.2.2.3 Impact wrenches
                                     14.2.2.3.1 Increasing use in automotive industry to drive demand
                        14.2.2.4 Screwdrivers and nutrunners
                                     14.2.2.4.1 Rising adoption in aerospace and automotive assembly operations to fuel market
                                                    TABLE 202 DRILLING & FASTENING TOOLS: POWER TOOLS MARKET, BY MODE OF OPERATION, 2018–2021 (USD MILLION)
                                                    TABLE 203 DRILLING & FASTENING TOOLS: POWER TOOLS MARKET, BY MODE OF OPERATION, 2022–2027 (USD MILLION)
             14.2.3 DEMOLITION TOOLS
                        14.2.3.1 Rotary hammers/hammer drills/demolition hammers
                                     14.2.3.1.1 Rising demand for demolition tools in construction industry
                                                    TABLE 204 DEMOLITION TOOLS: POWER TOOLS MARKET, BY MODE OF OPERATION, 2018–2021 (USD MILLION)
                                                    TABLE 205 DEMOLITION TOOLS: POWER TOOLS MARKET, BY MODE OF OPERATION, 2022–2027 (USD MILLION)
             14.2.4 SAWING & CUTTING TOOLS
                        14.2.4.1 Jigsaws
                                     14.2.4.1.1 Provision of greater accuracy and safety to drive demand
                        14.2.4.2 Reciprocating saws
                                     14.2.4.2.1 Suited to wide range of applications
                        14.2.4.3 Circular saws
                                     14.2.4.3.1 Increasing adoption by DIY users
                        14.2.4.4 Band saws
                                     14.2.4.4.1 Preferred for stationary cutting applications
                        14.2.4.5 Shears & nibblers
                                     14.2.4.5.1 Suitable for complex shape-cutting applications
                                                    TABLE 206 SAWING & CUTTING TOOLS: POWER TOOLS MARKET, BY MODE OF OPERATION, 2018–2021 (USD MILLION)
                                                    TABLE 207 SAWING & CUTTING TOOLS: POWER TOOLS MARKET, BY MODE OF OPERATION, 2022–2027 (USD MILLION)
             14.2.5 MATERIAL REMOVAL TOOLS
                        14.2.5.1 Sanders/polishers/buffers
                                     14.2.5.1.1 Used to remove surface imperfections
                        14.2.5.2 Air scalers
                                     14.2.5.2.1 Widely used to clean metal surfaces
                        14.2.5.3 Grinders
                                     14.2.5.3.1 Angle grinders
                                                    14.2.5.3.1.1 Suited to abrasive cutting and polishing applications
                                     14.2.5.3.2 Die and straight grinders
                                                    14.2.5.3.2.1 Widespread use at construction sites and in metalworking shops
                                                                     TABLE 208 MATERIAL REMOVAL TOOLS: POWER TOOLS MARKET, BY MODE OF OPERATION, 2018–2021 (USD MILLION)
                                                                     TABLE 209 MATERIAL REMOVAL TOOLS: POWER TOOLS MARKET, BY MODE OF OPERATION, 2022–2027 (USD MILLION)
             14.2.6 ROUTING TOOLS
                        14.2.6.1 Routers/planers/joiners
                                     14.2.6.1.1 Palm routers and laminate trimmers
                                                    14.2.6.1.1.1 Rising use for woodworking projects
                                                                     TABLE 210 ROUTING TOOLS: POWER TOOLS MARKET, BY MODE OF OPERATION, 2018–2021 (USD MILLION)
                                                                     TABLE 211 ROUTING TOOLS: POWER TOOLS MARKET, BY MODE OF OPERATION, 2022–2027 (USD MILLION)
             14.2.7 OTHERS
                        TABLE 212 OTHER TOOLS: POWER TOOLS MARKET, BY MODE OF OPERATION, 2018–2021 (USD MILLION)
                        TABLE 213 OTHER TOOLS: POWER TOOLS MARKET, BY MODE OF OPERATION, 2022–2027 (USD MILLION)
 
15 APPENDIX (Page No. - 253)
     15.1 INSIGHTS FROM INDUSTRY EXPERTS 
     15.2 DISCUSSION GUIDE 
     15.3 KNOWLEDGESTORE: MARKETSANDMARKETS’ SUBSCRIPTION PORTAL 
     15.4 CUSTOMIZATION OPTIONS 
     15.5 RELATED REPORTS 
     15.6 AUTHOR DETAILS 


The study involved four major activities in estimating the current size of the outdoor power equipment market. Exhaustive secondary research has been done to collect information on the market, peer market, and parent market. To validate these findings, assumptions, and sizing with industry experts across the value chain through primary research has been the next step. Finally, both top-down and bottom-up approaches have been employed to estimate the complete market size. After that, market breakdown and data triangulation methods have been used to estimate the market size of segments and subsegments.

Secondary Research

In the secondary research process, various secondary sources have been referred to identify and collect information relevant to this study. The secondary sources include annual reports, press releases, and investor presentations of companies; white papers, certified publications, and articles from recognized authors; directories; and databases. Secondary research has been mainly conducted to obtain key information about the industry’s supply chain, value chain of the market, total pool of key players, market classification and segmentation according to industry trends, geographic markets, and key developments from both market- and technology-oriented perspectives.

Primary Research

In the primary research process, various primary sources from both supply and demand sides have been interviewed to obtain the qualitative and quantitative information relevant to this report. Primary sources from the supply side include experts such as CEOs, VPs, marketing directors, technology and innovation directors, application developers, application users, and related executives from various key companies and organizations operating in the outdoor power equipment ecosystem. Following is the breakdown of primary respondents:

Outdoor Power Equipment Market
 Size, and Share

To know about the assumptions considered for the study, download the pdf brochure

Market Size Estimation

Both the top-down and bottom-up approaches have been used to estimate and validate the size of the overall outdoor power equipment market and the market based on segments. The research methodology used to estimate the market size has been given below:

  • Major players operating in the outdoor power equipment market have been identified and considered for the report through extensive secondary research.
  • The supply chain and market size of the outdoor power equipment market, both in terms of value and units, have been estimated/determined through secondary and primary research processes.
  • All estimations and calculations, including percentage share, revenue mix, splits, and breakdowns have been determined through use of secondary sources which are further verified through primary sources.

Global outdoor power equipment market Size: Bottom-Up Approach

Outdoor Power Equipment Market
 Size, and Bottom-Up Approach

Global Outdoor Power Equipment Market Size: Top-Down Approach

Outdoor Power Equipment Market
 Size, and Top-Down Approach

Market Definition

Outdoor power equipment allows the alteration, building, maintenance, and improvement of green spaces in residential, as well as public and commercial spaces. Such equipment is used for a variety of applications, including home refurbishment, backyard beautification, do-it-yourself (DIY) projects. Professional landscaping, and turf care. Various types of outdoor power equipment, including lawnmowers, and trimmers & edgers, are used for basic yard and garden maintenance. Other equipment such as saws and tillers & cultivators are used in forestry, and agricultural applications.
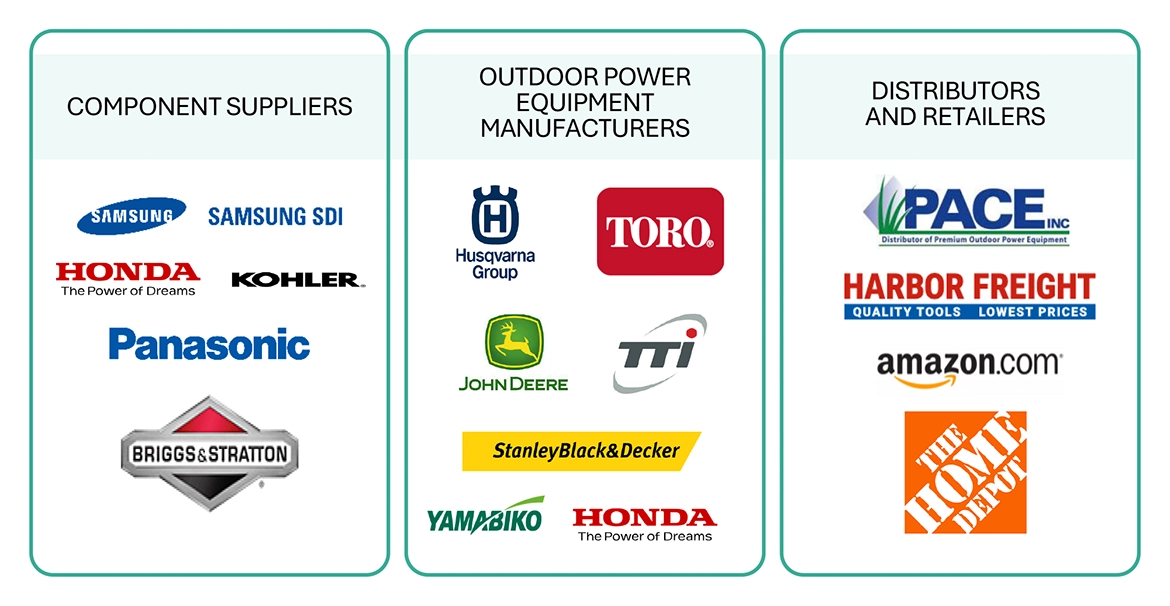
Key Stakeholders

  • Outdoor power equipment manufacturers
  • Associations and industrial bodies
  • Government bodies, such as regulatory authorities and policymakers
  • Financial institutions and investment communities
  • Market research and consulting firms
  • Raw material suppliers and distributors
  • Research institutes and organizations
  • Outdoor power equipment traders and suppliers
  • End-user industries

Data Triangulation

After arriving at the overall market size from the market size estimation process explained above, the total market has been split into several segments and subsegments. To complete the overall market engineering process and arrive at the exact statistics for all segments and subsegments, the data triangulation and market breakdown procedures have been employed, wherever applicable. The data has been triangulated by studying various factors and trends from both the demand and supply sides of the outdoor power equipment market.

Report Objectives:

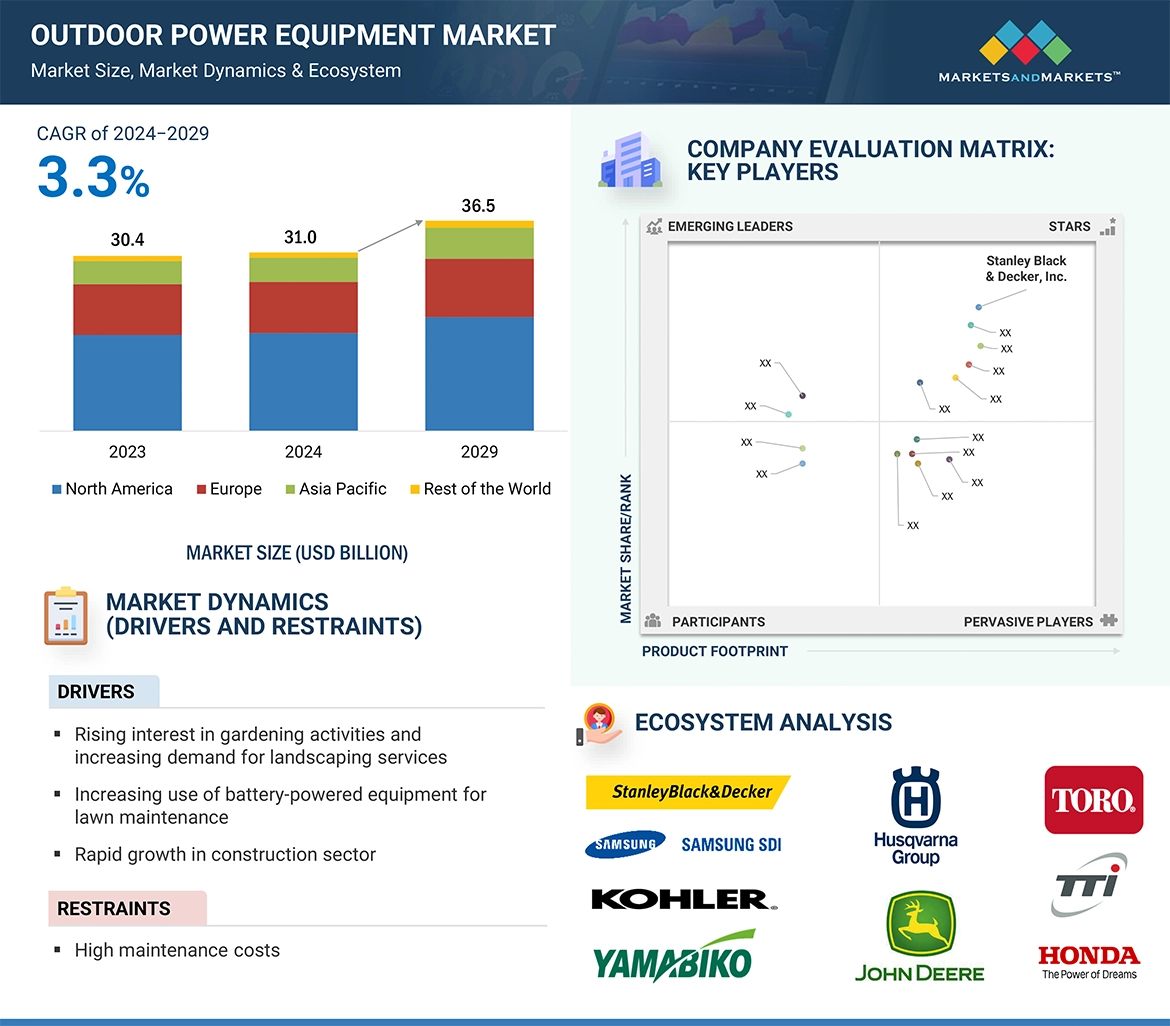
  • To define, describe, and forecast the global outdoor power equipment market, in terms of value, based on equipment type, application, power source, and region
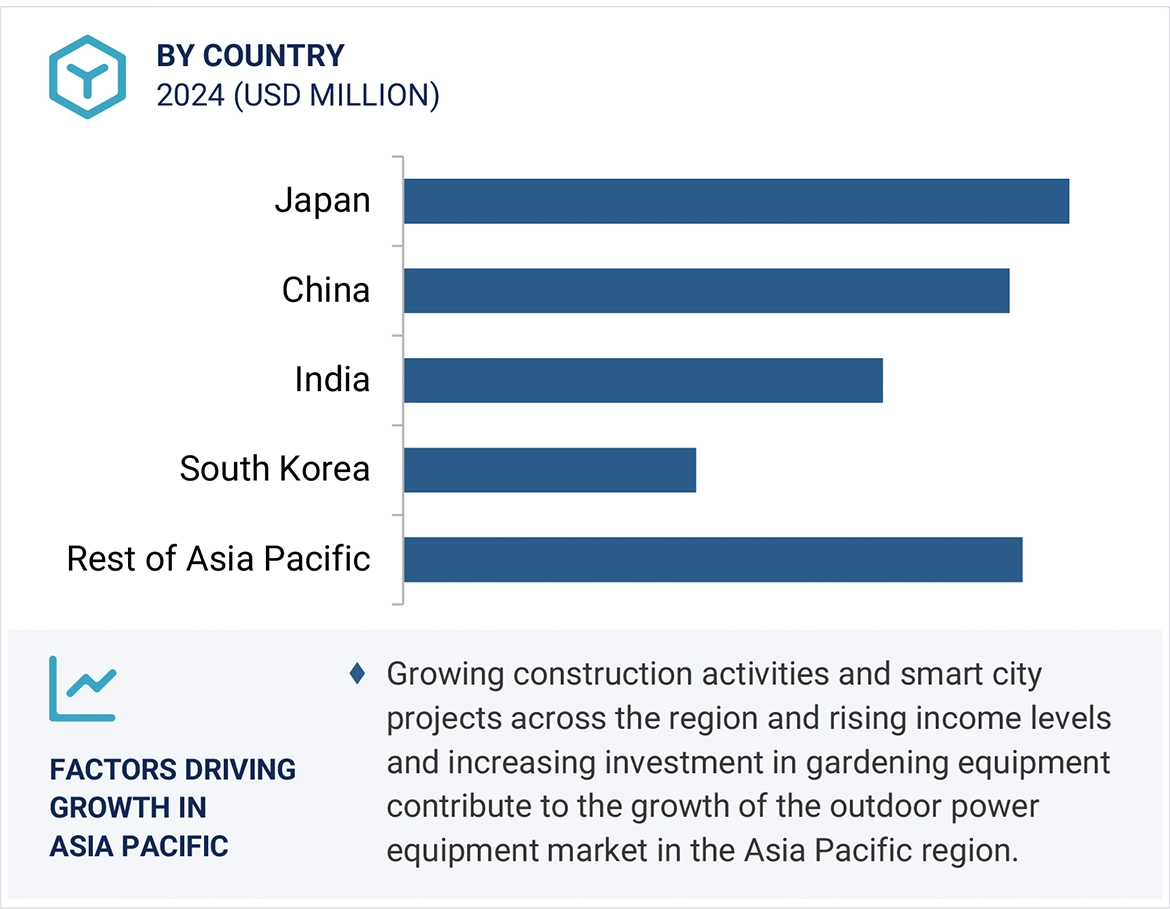
  • To describe and forecast the market size, in terms of value, across four main regions: North America, Europe, Asia Pacific, and the Rest of the World (RoW)
  • To provide detailed information regarding the drivers, restraints, opportunities, and challenges influencing market growth
  • To provide a detailed overview of the process flow of the outdoor power equipment market
  • To analyze opportunities for stakeholders in the outdoor power equipment market by identifying the high-growth segments
  • To strategically analyze micromarkets1 with respect to individual growth trends, prospects, and contributions to the overall market
  • To strategically profile the key players and comprehensively analyze their market positions in terms of their ranking and core competencies
  • To analyze the major growth strategies adopted by key market players, such as contracts, agreements, acquisitions, product launches, expansions, and partnerships

Available Customizations:

Based on the given market data, MarketsandMarkets offers customizations in the reports according to the client’s specific requirements. The available customization options are as follows:

Product Analysis

  • Product matrix that gives a detailed comparison of the product portfolio of each company

Company Information

  • Detailed analysis and profiling of 25 key players
Custom Market Research Services

We will customize the research for you, in case the report listed above does not meet with your exact requirements. Our custom research will comprehensively cover the business information you require to help you arrive at strategic and profitable business decisions.

Request Customization

Instant Answers with GPT - Ask Now!

Ask real questions. Get complete answers !
Report Code
SE 7109
Published ON
Feb, 2024
Choose License Type
BUY NOW
  • SHARE
X
Request Customization
Speak to Analyst
Speak to Analyst
OR FACE-TO-FACE MEETING
PERSONALIZE THIS RESEARCH
  • Triangulate with your Own Data
  • Get Data as per your Format and Definition
  • Gain a Deeper Dive on a Specific Application, Geography, Customer or Competitor
  • Any level of Personalization
REQUEST A FREE CUSTOMIZATION
LET US HELP YOU!
  • What are the Known and Unknown Adjacencies Impacting the Outdoor Power Equipment Market
  • What will your New Revenue Sources be?
  • Who will be your Top Customer; what will make them switch?
  • Defend your Market Share or Win Competitors
  • Get a Scorecard for Target Partners
CUSTOMIZED WORKSHOP REQUEST
+1-888-600-6441
  • Call Us
  • +1-888-600-6441 (Corporate office hours)
  • +1-888-600-6441 (US/Can toll free)
  • +44-800-368-9399 (UK office hours)
CONNECT WITH US
ABOUT TRUST ONLINE
©2024 MarketsandMarkets Research Private Ltd. All rights reserved
DMCA.com Protection Status Website Feedback