Smart Connected Assets and Operations Market by Module (Hardware-Sensors, Processors, Network Connectivity- Wired & Wireless; APM Software & Platform, and Services- Professional & Managed), Industry, and Geography - Global Forecast to 2035


Smart Connected Assets and Operations Market Summary
The global Smart Connected Assets and Operations Market is undergoing rapid transformation as enterprises connect physical assets, industrial equipment, vehicles, infrastructure, and operational processes with IoT sensors, cloud platforms, AI analytics, edge computing, and automation technologies. The market is estimated at approximately USD 320–330 billion in 2025 and is projected to reach USD 580–600 billion by 2035, registering a CAGR of 6%–7% during the forecast period. Recent market estimates vary according to the scope of hardware, software, services, asset performance management, and operations platforms included; for example, one 2026 study estimates the market at USD 317.3 billion in 2026 and USD 647.3 billion by 2034 at an 8.4% CAGR, while another estimates USD 321.65 billion in 2025 and projects USD 581.89 billion by 2030.
Smart connected assets and operations solutions enable organizations to monitor asset health, optimize utilization, automate workflows, improve maintenance, and make faster operational decisions. The market is benefiting from the increasing deployment of IoT sensors, connected industrial equipment, predictive maintenance platforms, digital twins, AI-powered analytics, cloud-based asset management, and edge computing. Manufacturers, energy companies, transportation operators, utilities, healthcare organizations, mining companies, and logistics providers are increasingly using connected asset data to reduce downtime, improve safety, increase productivity, and control operating costs.
AI is becoming a particularly important growth catalyst. Instead of simply collecting asset data, enterprises are using machine learning and generative AI technologies to identify abnormal operating conditions, predict equipment failures, recommend maintenance actions, optimize energy consumption, and support operational decision-making. At the same time, digital transformation and Industry 4.0 initiatives are pushing organizations toward integrated environments in which physical assets and operational processes are continuously connected and analyzed.
Key Market Trends & Insights
North America remains the leading regional market. North America accounted for approximately 37.6% of market demand in 2025 in one recent assessment, supported by strong investments in industrial digitization, asset management, grid modernization, manufacturing automation, and cloud technologies. The region also benefits from a mature ecosystem of industrial technology and software providers.
Asia Pacific is the fastest-growing region. China, Japan, India, South Korea, and Southeast Asian economies are accelerating smart-factory deployment, industrial IoT adoption, connected transportation, energy modernization, and automated production. Manufacturing investments and government-backed digitalization programs are creating a large opportunity for smart connected assets.
Software is gaining strategic importance. Hardware remains a substantial part of market spending, but software platforms and services are growing rapidly as enterprises seek asset-performance management, predictive analytics, remote monitoring, and outcome-based operational solutions. Recent market research indicates that software and services are expanding faster than hardware.
Cloud and wireless connectivity are transforming deployment models. Cloud deployment enables organizations to aggregate asset information across multiple plants, facilities, and geographic locations. Meanwhile, 5G private networks, industrial Wi-Fi, LPWAN, and other wireless technologies are extending connectivity to mobile and remote assets.
AI and predictive operations are becoming central to market growth. AI-enabled predictive maintenance can identify potential failures before they result in unplanned downtime. Digital twins, edge analytics, and AI-powered operational recommendations are further shifting the market from reactive asset management toward predictive and prescriptive operations.
Market Size & Forecast
-
Base year market size: USD 320–330 billion in 2025
-
Forecast value by 2035: USD 580–600 billion
-
CAGR: 6%–7% during 2025–2035
-
Key growth factors: Industrial IoT, AI-powered predictive maintenance, cloud computing, edge analytics, digital twins, automation, connected infrastructure, and demand for real-time operational visibility.
-
Growth outlook: Increasing investment in smart factories, connected energy systems, transportation infrastructure, and digitally managed assets will continue expanding the addressable market. Recent estimates place the market between roughly USD 279 billion and USD 322 billion in 2025, depending on market scope and methodology.
Smart Connected Assets and Operations Market Top 10 key takeaway
-
The global Smart Connected Assets and Operations Market is estimated at USD 320–330 billion in 2025.
-
The market is projected to reach approximately USD 580–600 billion by 2035.
-
The market is expected to expand at a CAGR of 6%–7% through 2035.
-
North America remains the leading regional market.
-
Asia Pacific is expected to register the fastest growth.
-
Hardware currently represents a significant portion of market spending, while software and services are gaining momentum.
-
Manufacturing is a leading industry vertical because of Industry 4.0 and predictive maintenance adoption.
-
Cloud platforms, edge computing, IoT, and wireless connectivity are transforming asset-management architectures.
-
AI is enabling predictive maintenance, anomaly detection, prescriptive analytics, and automated decision-making.
-
Digital twins, automation, and real-time asset intelligence will create significant long-term opportunities.
Product Insights
The hardware segment remains a major component of the Smart Connected Assets and Operations Market because physical assets require sensors, gateways, controllers, industrial networking equipment, condition-monitoring devices, and connected control systems before their operational data can be captured. Hardware includes smart sensors, industrial gateways, edge devices, connected controllers, tracking equipment, monitoring devices, and other infrastructure that forms the physical foundation of connected operations.
However, the competitive center of gravity is gradually shifting toward software. Asset performance management platforms, enterprise asset management applications, IoT platforms, analytics tools, digital-twin environments, and operations-management software allow enterprises to turn raw asset data into actionable intelligence. One recent market assessment estimates hardware represented approximately 49% of market share in 2025, while software and services are projected to grow faster through 2031.
Asset-performance-management software is particularly important because it combines equipment data, maintenance history, operating conditions, and analytical models to determine asset health. When integrated with AI, these systems can identify early indicators of failure and recommend optimized maintenance schedules.
Connected sensors are also becoming more sophisticated. Modern sensors can monitor vibration, temperature, pressure, current, humidity, flow, acoustic signatures, and other parameters. Edge computing allows this information to be processed close to the asset, reducing latency and limiting the amount of raw data that must be transmitted to the cloud.
Emerging product categories include AI-enabled industrial gateways, autonomous inspection devices, digital-twin platforms, connected robotics, smart energy-management systems, remote asset-monitoring solutions, and integrated field-service platforms. These products are increasingly designed as components of broader connected operational ecosystems rather than isolated devices.
Technology / Component Insights
The technology foundation of the Smart Connected Assets and Operations Market consists of IoT sensors, industrial connectivity, cloud computing, edge computing, AI, machine learning, digital twins, big data analytics, automation, cybersecurity, and asset-management software. Together, these technologies create a continuous data loop between physical assets and digital operational systems.
IoT is the basic connectivity layer. Sensors installed on machines and infrastructure collect real-time information that can be transmitted through wired Ethernet, industrial networks, Wi-Fi, cellular connectivity, LPWAN, or satellite systems. Recent market research identifies Ethernet as a dominant connectivity technology while wireless connectivity is expanding as private 5G and other wireless technologies mature.
Cloud computing provides centralized storage, analytics, visualization, and application management. It enables companies with geographically distributed facilities to manage assets through common platforms. Cloud-based architectures are particularly useful for multinational manufacturers, energy companies, logistics operators, and infrastructure owners.
Edge computing is becoming increasingly important where low latency, bandwidth efficiency, and operational continuity are critical. Instead of sending all sensor information to a remote cloud, edge devices can analyze data locally and immediately identify abnormal behavior. This approach is particularly relevant for robotics, industrial machinery, autonomous systems, and safety-critical applications.
AI is transforming the market from monitoring to intelligent operations. Machine learning models can analyze historical and real-time asset data to identify patterns associated with equipment degradation. Generative AI can provide natural-language interfaces to asset information, maintenance documentation, operating procedures, and performance dashboards. The next generation of systems is expected to combine AI agents with asset-management platforms to automate routine operational decisions.
Digital twins represent another major innovation area. A digital twin can create a virtual representation of an asset, machine, facility, or process and continuously update it using real-world data. This allows organizations to simulate operating conditions, test maintenance strategies, optimize production, and evaluate potential failures before making physical changes.
Application Insights
Manufacturing represents one of the largest application segments in the Smart Connected Assets and Operations Market. Manufacturing companies are connecting production equipment, robots, sensors, conveyors, motors, compressors, CNC machines, and other assets to improve production visibility and minimize downtime. One recent market assessment estimates manufacturing accounted for more than 41% of market revenue in 2025.
Predictive maintenance is a particularly important use case. Instead of performing maintenance at fixed intervals or waiting for failures, organizations can use equipment data and AI models to estimate when maintenance is required. This can improve equipment availability while reducing unnecessary maintenance expenditure.
Energy and utilities represent another significant application area. Connected assets can monitor transformers, turbines, generators, substations, pipelines, renewable-energy installations, and distribution equipment. Smart connected operations help utilities improve reliability, manage distributed energy resources, and respond to changing demand.
In oil and gas and mining, connected assets support remote monitoring, predictive maintenance, worker safety, and operational optimization. These industries frequently operate equipment in difficult or remote environments, making remote diagnostics particularly valuable.
Transportation and logistics are also adopting connected asset technologies for fleet monitoring, vehicle health, route optimization, warehouse automation, and supply-chain visibility. Healthcare organizations can use connected equipment monitoring for medical devices, facility infrastructure, and critical systems.
Future applications will increasingly combine AI, robotics, digital twins, and autonomous operations. Smart connected assets will not merely report their condition; they will increasingly participate in automated workflows and operational decision-making.
Regional Insights
North America is the leading regional market because of its strong industrial technology ecosystem, mature cloud infrastructure, high enterprise software adoption, and significant investments in manufacturing modernization. The United States is particularly important due to spending on industrial automation, energy infrastructure, logistics, aerospace, defense, and data-driven asset management. Recent estimates place North America's 2025 market share at approximately 37.6%.
Europe is another important market, supported by Industry 4.0 programs, industrial automation, sustainability objectives, energy-efficiency requirements, and advanced manufacturing. Germany is a particularly strong market because of its large industrial and automotive sectors. European enterprises are increasingly using connected assets to reduce energy consumption, improve production efficiency, and support environmental targets.
Asia Pacific is expected to experience the fastest growth through 2035. Rapid industrialization, manufacturing expansion, smart-city investments, digital infrastructure development, and government-supported Industry 4.0 initiatives are increasing adoption. China is a major contributor, while Japan and South Korea are strong markets for robotics, automation, and advanced manufacturing. India and Southeast Asia are also becoming important growth centers.
-
North America: Largest regional market with strong industrial digitalization.
-
Europe: Industry 4.0, sustainability, and energy efficiency support adoption.
-
Asia Pacific: Fastest-growing region due to manufacturing and infrastructure investments.
-
China: Smart manufacturing and industrial IoT are major market catalysts.
-
Japan and India: Robotics, automation, and digital transformation create significant opportunities.
Country-Specific Market Trends
In China, the Smart Connected Assets and Operations Market is expected to grow at approximately 10%–11% CAGR through 2035. The country is investing heavily in smart factories, industrial robotics, connected infrastructure, EV production, energy systems, and industrial IoT. Government-backed manufacturing modernization programs are supporting broader adoption of intelligent asset-management technologies.
Japan is projected to record approximately 8%–9% CAGR, supported by robotics, advanced manufacturing, automotive production, and aging infrastructure. Japanese companies are increasingly using predictive maintenance and connected operations to improve productivity and compensate for workforce constraints.
In North America, the United States is expected to grow at approximately 7%–8% CAGR, supported by industrial reshoring, infrastructure modernization, cloud adoption, energy investments, and automation. Canada is expected to achieve around 6%–7% CAGR, with mining, energy, transportation, utilities, and manufacturing providing important opportunities. Mexico could register approximately 8%–9% CAGR, supported by nearshoring, automotive manufacturing, electronics production, and industrial automation.
In Europe, Germany is expected to expand at approximately 7%–8% CAGR, driven by Industry 4.0, automotive production, robotics, and industrial digitization. France is projected to grow at approximately 6%–7% CAGR, supported by aerospace, energy, transportation, manufacturing, and smart infrastructure investments.
-
China: Industrial IoT and smart manufacturing are accelerating adoption.
-
Japan: Robotics and predictive maintenance are important demand drivers.
-
United States: Reshoring, infrastructure modernization, and AI support growth.
-
Germany: Industry 4.0 remains a central market catalyst.
-
France: Energy, aerospace, transportation, and smart manufacturing create opportunities.
Key Smart Connected Assets and Operations Market Company Insights
The competitive landscape includes major industrial technology, enterprise software, automation, cloud, and asset-management providers. Key companies include IBM, Siemens, Schneider Electric, Honeywell, ABB, AVEVA, GE Vernova, Hitachi, Oracle, SAP, PTC, Rockwell Automation, Cisco, Microsoft, Emerson, Bentley Systems, AspenTech, and ServiceNow. Recent market research identifies many of these companies as leading participants in the broader Smart Connected Assets and Operations ecosystem.
Siemens is emphasizing industrial digitalization through automation, industrial IoT, digital twins, and software. Its strategy centers on connecting industrial assets with engineering and operational data.
Schneider Electric focuses on connected energy management, industrial automation, and software platforms that combine operational technology with digital intelligence. Its strategy increasingly links asset data with energy optimization and sustainability.
IBM combines AI, cloud, data analytics, and asset-management technologies to support predictive maintenance and operational intelligence. Honeywell and ABB emphasize industrial automation, process optimization, connected equipment, and asset performance.
AVEVA, PTC, SAP, and Oracle focus heavily on enterprise software, asset performance, digital twins, industrial data, and operational workflows. Meanwhile, Rockwell Automation, Emerson, and GE Vernova leverage their industrial installed bases to integrate connected technologies with automation and asset-management solutions. The competitive landscape is increasingly defined by the ability to combine hardware, software, AI, cloud, cybersecurity, and industrial domain expertise.
-
Vendors are integrating AI into predictive and prescriptive maintenance platforms.
-
Cloud-native asset-management solutions are gaining strategic importance.
-
Industrial digital twins are becoming key differentiation technologies.
-
Companies are combining automation, IoT, analytics, and cybersecurity.
-
Partnerships and ecosystem integration are increasingly important for enterprise-scale deployments.
Recent Developments
A major recent development is the accelerating integration of AI into asset-performance management and industrial operations platforms. Vendors are moving beyond predictive analytics toward prescriptive recommendations that can identify operational issues and suggest specific maintenance or optimization actions. The Business Research Company identifies AI-driven prescriptive maintenance, edge analytics, digital twins, and cybersecurity as important growth factors through 2030.
Another major development is the expansion of cloud and wireless connected-asset architectures. Private 5G, industrial wireless, and low-power connectivity are enabling organizations to connect mobile and remote assets that were previously difficult or expensive to integrate. Cloud deployment is already a major component of the market, with one recent assessment estimating cloud deployment accounted for more than 62% of 2025 market size.
The market is also seeing deeper integration between digital twins, industrial automation, and AI. Organizations are increasingly using virtual asset models to simulate operational conditions, predict performance, optimize maintenance, and improve production planning.
Market Segmentation
The Smart Connected Assets and Operations Market can be segmented by Product, Technology/Component, Application, and Region. By product or component, the market includes hardware, asset-performance-management software and platforms, and services. Hardware covers sensors, gateways, controllers, connected monitoring equipment, and edge devices, while software includes asset-management, analytics, digital-twin, monitoring, and operations-management platforms. Services encompass implementation, integration, consulting, managed services, maintenance, and support. Recent market studies use these categories to assess the global market.
By technology, the market includes IoT, AI, machine learning, big data analytics, cloud computing, edge computing, digital twins, industrial connectivity, and cybersecurity. Connectivity can be categorized into wired, wireless, and satellite/remote technologies. By deployment, organizations can use on-premise, cloud, or hybrid architectures. By application and industry vertical, the market spans manufacturing, energy and utilities, oil and gas, mining, transportation and logistics, healthcare, agriculture, automotive, and other industrial sectors.
Regionally, North America remains the leading market, Europe maintains a strong position in industrial applications, and Asia Pacific represents the fastest-growing regional opportunity. The increasing integration of operational technology with enterprise IT will continue to blur traditional boundaries between asset management, industrial automation, and business intelligence.
-
By Component: Hardware remains substantial, while software and services are growing rapidly.
-
By Connectivity: Wired systems dominate established industrial environments, while wireless adoption is accelerating.
-
By Deployment: Cloud and hybrid architectures are gaining importance for scalable asset management.
-
By Application: Manufacturing, energy, utilities, transportation, and logistics are major demand centers.
-
By Region: North America leads, while Asia Pacific is expected to record the fastest growth.
The global Smart Connected Assets and Operations Market is entering a new phase in which connected physical assets are becoming intelligent participants in enterprise operations. With an estimated market size of USD 320–330 billion in 2025, the market is projected to reach approximately USD 580–600 billion by 2035, representing a CAGR of 6%–7%. The growth trajectory will be shaped by industrial IoT, AI, automation, cloud computing, edge intelligence, digital twins, and the increasing need for real-time operational visibility.
AI will be one of the most significant forces influencing the market. Predictive analytics will increasingly evolve into prescriptive and autonomous operations, allowing organizations to identify potential failures, recommend corrective actions, optimize production schedules, and reduce energy consumption. Generative AI will also make asset data more accessible by enabling engineers and operators to interact with complex operational information through natural-language interfaces.
The combination of IoT and AI will allow enterprises to move from reactive maintenance toward predictive and ultimately autonomous asset management. Edge computing will enable rapid decisions close to machines, while cloud platforms will provide enterprise-wide visibility across facilities and geographic locations.
By 2035, smart connected assets will become strategically important for companies seeking higher productivity, lower operating costs, improved safety, and stronger sustainability performance. Organizations that integrate connected assets with AI, digital twins, cybersecurity, automation, and enterprise software will be better positioned to create resilient and data-driven operations. The market therefore represents not only an opportunity for technology suppliers but also a critical transformation pathway for asset-intensive industries.
FAQs - Smart Connected Assets and Operations Market
1. What is the estimated size of the Smart Connected Assets and Operations Market?
The global Smart Connected Assets and Operations Market is estimated at approximately USD 320–330 billion in 2025. Recent published estimates vary based on market scope, with reported 2025 values ranging from approximately USD 279 billion to USD 322 billion.
2. What is the expected growth rate of the Smart Connected Assets and Operations Market?
The market is projected to grow at approximately 6%–7% CAGR from 2025 to 2035 under the defined market scope. Other research methodologies produce higher growth estimates; for example, one recent study forecasts an 8.4% CAGR through 2034.
3. What are the key drivers of the Smart Connected Assets and Operations Market?
Major drivers include industrial IoT adoption, predictive maintenance, AI-powered analytics, Industry 4.0, digital twins, cloud computing, edge computing, automation, connected infrastructure, and the need to reduce unplanned downtime and operational costs.
4. Which region is leading the Smart Connected Assets and Operations Market?
North America is the leading regional market, supported by advanced industrial infrastructure, enterprise technology adoption, automation, and asset-management investments. Asia Pacific is expected to be the fastest-growing region through the forecast period.
5. Who are the key companies in the Smart Connected Assets and Operations Market?
Major companies include IBM, Siemens, Schneider Electric, Honeywell, ABB, AVEVA, GE Vernova, Hitachi, Oracle, SAP, PTC, Rockwell Automation, Cisco, Microsoft, Emerson, Bentley Systems, AspenTech, and ServiceNow.
 Exclusive indicates content/data unique to MarketsandMarkets and not available with any competitors.
Table of Contents
1 Introduction (Page No. - 17)
1.1 Objectives of the Study
1.2 Market Definition
1.3 Study Scope
1.3.1 Markets Covered
1.3.2 Years Considered for the Study
1.4 Currency & Pricing
1.5 Limitations
1.6 Stakeholders
2 Research Methodology (Page No. - 20)
2.1 Research Data
2.1.1 Secondary Data
2.1.1.1 Key Data From Secondary Sources
2.1.2 Primary Data
2.1.2.1 Key Data From Primary Sources
2.1.2.2 Key Industry Insights
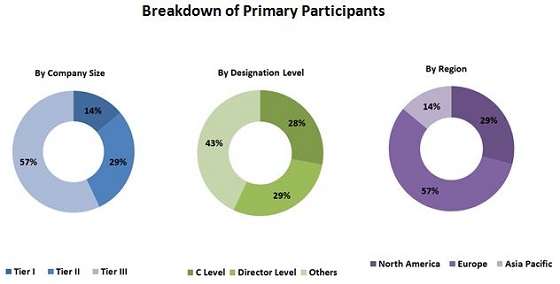
2.1.2.3 Breakdown of Primaries Interviews
2.2 Market Size Estimation
2.2.1 Bottom-Up Approach
2.2.2 Top-Down Approach
2.3 Market Breakdown and Data Triangulation
2.4 Research Assumptions
3 Executive Summary (Page No. - 28)
4 Premium Insight (Page No. - 34)
4.1 Increasing Opportunites in APM Software & Platform is Expected to Drive the Market During the Forecast Period
4.2 Smart Connected Assets and Operation Market: By Service
4.3 Major Countries Present in the Smart Connected Assets and Opepartion Market
4.4 China Dominated the Market in APAC in 2015
4.5 Market, By Healthcare
4.6 Life Cycle Analysis, By Geography
5 Market Overview (Page No. - 38)
5.1 Introduction
5.2 Market Segmentation
5.2.1 Market, By Module
5.2.2 Market, By Industry
5.2.3 Market, By Geography
5.3 Market Dynamics
5.3.1 Drivers
5.3.1.1 Enhanced Operational Performance With New Control Systems
5.3.1.2 Reduction in Cost and Energy Efficiency
5.3.1.3 Increased Agility in Manufacturing
5.3.2 Restraints
5.3.2.1 Lack of Standardization
5.3.2.2 Complexities Involved in Connecting Traditional Equipment
5.3.3 Opportunities
5.3.3.1 Increasing Adoption in Factory Automation
5.3.3.2 Reduction in Operational and Capital Costs Through Predictive Maintenance
5.3.3.3 Rising Adoption of Iot Across Small and Medium Businesses
5.3.3.4 Opportunity for Setting Up Large Number of Data Centers
5.3.4 Challenges
5.3.4.1 Rise in Security and Safety Concern
5.3.4.2 Managing Massive Amount of Data
5.3.4.3 Increase in Level of Integration Leading to Complex Architecture
5.3.4.4 Adaptability and Scalability
6 Industry Trends (Page No. - 48)
6.1 Introduction
6.2 Value Chain Analysis
6.3 Porter’s Five Forces Analysis
6.3.1 Intensity of Competitive Rivalry
6.3.2 Threat of Substitutes
6.3.3 Bargaining Power of Buyers
6.3.4 Bargaining Power of Suppliers
6.3.5 Threat of New Entrants
6.4 Industrial Iot Protocols
6.5 Impact of 5g on Smart Connected Assets and Operations
7 Market, By Module (Page No. - 62)
7.1 Introduction
7.2 Hardware
7.2.1 Processors
7.2.1.1 Microcontroller
7.2.1.2 Application Processor
7.2.1.3 DSP
7.2.1.4 Memory Chips
7.2.1.5 FPGA
7.2.2 Sensors
7.2.2.1 Temperature Sensor
7.2.2.2 Pressure Sensor
7.2.2.3 Humidity Sensor
7.2.2.4 Flow Sensor
7.2.2.5 Accelerometer
7.2.2.6 Magnetometer
7.2.2.7 Gyroscope
7.2.2.8 Image Sensor
7.2.2.9 Touch Sensors
7.2.2.10 Proximity Sensor
7.2.2.11 Acoustic Sensor
7.2.2.12 Motion Sensor
7.2.2.13 Occupancy Sensor
7.2.2.14 Other Sensors
7.2.3 Network Connectivity
7.2.3.1 Wired Technologies
7.2.3.2 Wireless Technologies
7.2.3.2.1 RFID
7.2.3.2.2 Wireless-Hart
7.2.3.2.3 Digimesh
7.2.3.2.4 ISA100.11a
7.2.3.2.5 IEEE 802.15.4
7.2.3.2.6 NFC
7.2.3.2.7 ANT+
7.2.3.2.8 Wi-Fi
7.2.3.2.9 Wimax
7.2.3.2.10 Zigbee
7.2.3.2.11 Enocean
7.2.3.2.12 Bluetooth
7.2.3.2.13 Eddystone- Bluetooth Low Energy (BLE)
7.2.3.2.14 Cellular Technologies
7.3 Assets Performance Management Software & Platform
7.3.1 Aspects of APM
7.3.1.1 Reliability-Centred Maintenance (RCM)
7.3.1.2 Condition-Based Monitoring (CBM)
7.3.1.3 Mro Inventory Optimization
7.3.2 Applications of APM Solution
7.3.2.1 Design & Configuration
7.3.2.2 Past Performance
7.3.2.3 Predicted Future Failure
7.3.2.4 Raw Material
7.3.2.5 Environmental Impact
7.3.2.6 Customer Requirements
7.3.2.7 Supplier Performance
7.4 Services
7.4.1 Professional Services
7.4.2 Managed Services
8 Market, By Industry (Page No. - 92)
8.1 Introduction
8.2 Automotive and Transportation
8.2.1 Roadways
8.2.2 Railways
8.2.3 Airways
8.2.4 Maritime
8.3 Energy and Power
8.4 Healthcare
8.4.1 Telemedicine
8.4.2 Clinical Operations and Workflow Management
8.4.3 Connected Imaging
8.4.4 Inpatient Monitoring
8.4.5 Medication Management
8.4.6 Others
8.5 Smart Agriculture
8.5.1 Precision Farming
8.5.2 Livestock Monitoring
8.5.3 Fish Farming
8.5.4 Smart Greenhouse
8.5.5 Others
8.6 Factory Automation
8.7 Others
9 Geographic Analysis (Page No. - 111)
9.1 Introduction
9.2 Americas
9.2.1 Expansion of the Portfolios of Smart Connected Assets and Operations
9.2.2 North America
9.2.2.1 Government Initiatives Help in Higher Adoption of Smart Connected Assets and Operations
9.2.2.2 U.S.
9.2.2.2.1 Increase in the Number of Installations of Iiot-Enabled Devices in the U.S.
9.2.2.3 Canada
9.2.2.3.1 Increase in the Adoption of Smart Connected Assets and Operations in the Manufacturing Industries
9.2.2.4 Mexico
9.2.2.4.1 Increasing Adoption of Smart Connected Assets and Operations Due to Various Initiatives Taken Up By Companies
9.2.3 South America
9.2.3.1 Increasing Focus on Enhancing Production Processes
9.2.3.2 Brazil
9.2.3.2.1 Various Initiatives By the Government and Public Companies Increasing Opportunities for the Market to Grow at Higher Rate
9.2.3.3 Rest of South America
9.2.3.3.1 Expansion of Smart Connected Assets and Operation Systems in Rural Market
9.3 Europe
9.3.1 Focus on Continuous Innovation of Smart Connected Assets and Operations
9.3.2 Germany
9.3.2.1 Increasing Initiatives of the German Government
9.3.3 U.K.
9.3.3.1 More Investments in Upcoming Projects for the Expansion of Market
9.3.4 France
9.3.4.1 Increasing Investments in the Development of Technologies
9.3.5 Rest of Europe
9.3.5.1 Increase in Installations of Iiot in the Automotive Sector
9.4 APAC
9.4.1 China
9.4.1.1 Increasing Opportunities for the Market Due to Growing Government Initiatives
9.4.2 Japan
9.4.2.1 Deployment of Smart Connected Assets and Operations to Increase in the Long Run
9.4.3 India
9.4.3.1 Strong Government Support for Implementing Smart Connected Assets and Operations
9.4.4 Rest of APAC
9.4.4.1 Significant Growth in the Market in Indonesia and Malaysia
9.5 Rest of the World (RoW)
9.5.1 Increasing Demand for Iiot in Various Industries
9.5.2 Middle East
9.5.2.1 Growing Demand for Iiot in the Automobile and Transportation Industry
9.5.3 Africa
9.5.3.1 Rising Investments in the Healthcare Industry By Government
10 Competitive Landscape (Page No. - 139)
10.1 Overview
10.2 Market Ranking for Market
10.3 Competitive Scenario
10.4 Recent Developments
10.4.1 New Product Launches
10.4.2 Expansions
10.4.3 Partnership/ Agreements/ Collaboration
10.4.4 Mergers & Acquisitions
11 Company Profiles (Page No. - 147)
11.1 Introduction
(Business Overview, Products & Services, Key Insights, Recent Developments, SWOT Analysis, Ratio Analysis, MnM View)*
11.2 Intel Corporation
11.3 Cisco Systems, Inc.
11.4 IBM Corporation
11.5 Arm Holdings PLC
11.6 General Electric Company
11.7 Texas Instruments Incorporated
11.8 Cypress Semiconductor Corporation
11.9 Rockwell Automation, Inc.
11.10 Stmicroelectronics N.V.
11.11 NXP Semiconductors N.V.
11.12 PTC Inc.
*Details on Business Overview, Products & Services, Key Insights, Recent Developments, SWOT Analysis, MnM View Might Not Be Captured in Case of Unlisted Companies.
12 Appendix (Page No. - 188)
12.1 Insights of Industry Experts
12.2 Discussion Guide
12.3 Knowledge Store: Marketsandmarkets’ Subscription Portal
12.4 Introducing RT: Real-Time Market Intelligence
12.5 Available Customizations
12.6 Related Reports
12.7 Author Details
List of Tables (65 Tables)
Table 1 Porter’s Five Forces Analysis: Threat of New Entrants Likely to Have A Medium Impact on the Overall Market
Table 2 Smart Connected Assets and Operations Market, By Module, 2013–2022 (USD Billion)
Table 3 Market for Hardware, By Region, 2013–2022 (USD Billion)
Table 4 Market for Hardware in Americas, By Region, 2013–2022 (USD Billion)
Table 5 Market, By Hardware, 2013–2022 (USD Billion)
Table 6 Market for Processors, By Region, 2013–2022 (USD Billion)
Table 7 Market for Processors in Americas, By Region, 2013–2022 (USD Billion)
Table 8 Market for Sensors, By Region, 2013–2022 (USD Billion)
Table 9 Market for Sensors in Americas, By Region, 2013–2022 (USD Billion)
Table 10 Market, By Sensors, 2013–2022 (USD Million)
Table 11 Market, By Sensors, 2013–2022 (Million Units)
Table 12 Market for Network Connectivity, By Region, 2013–2022 (USD Billion)
Table 13 Market for Network Connectivity in Americas, By Region, 2013–2022 (USD Billion)
Table 14 Market, By Network Connectivity, 2013–2022 (USD Billion)
Table 15 Market, By Wireless Connectivity, 2013–2022 (USD Billion)
Table 16 Market for APM Software & Paltform, By Region, 2013–2022 (USD Billion)
Table 17 Market for APM Software & Paltform in Americas, By Region, 2013–2022 (USD Billion)
Table 18 Market for Service, By Region, 2013–2022 (USD Billion)
Table 19 Market for Services in Americas, By Region, 2013–2022 (USD Billion)
Table 20 Market, By Service, 2013–2022 (USD Billion)
Table 21 Market, By Industry, 2013–2022 (USD Billion)
Table 22 Market for Automotive and Transportation, By Module, 2013–2022 (USD Billion)
Table 23 Market for Automotive and Transportation, By Region, 2013–2022 (USD Billion)
Table 24 Market for Automotive and Transportation, By Type, 2013–2022 (USD Billion)
Table 25 Market for Energy and Power, By Module, 2013–2022 (USD Billion)
Table 26 Market for Energy and Power, By Region, 2013–2022 (USD Billion)
Table 27 Market for Healthcare, By Module, 2013–2022 (USD Billion)
Table 28 Market for Healthcare, By Region, 2013–2022 (USD Billion)
Table 29 Market for Healthcare, By Type, 2013–2022 (USD Billion)
Table 30 Market for Smart Agriculture, By Module, 2013–2022 (USD Billion)
Table 31 Market for Smart Agriculture, By Region, 2013–2022 (USD Billion)
Table 32 Market for Smart Agriculture, By Type, 2013–2022 (USD Billion)
Table 33 Market for Factory Automation, By Module, 2013–2022 (USD Billion)
Table 34 Market for Factory Automation, By Region, 2013–2022 (USD Billion)
Table 35 Market for Others, By Module, 2013–2022 (USD Billion)
Table 36 Market for Others, By Region, 2013–2022 (USD Billion)
Table 37 Market, By Region, 2013–2022 (USD Billion)
Table 38 Market in the Americas, By Module, 2013–2022 (USD Billion)
Table 39 Market in the Americas, By Hardware, 2013–2022 (USD Billion)
Table 40 Market in the Americas, By Industry, 2013–2022 (USD Billion)
Table 41 Market in the Americas, By Region, 2013–2022 (USD Billion)
Table 42 Market in North America, By Module , 2013–2022 (USD Billion)
Table 43 Market in North America, By Hardware, 2013–2022 (USD Billion)
Table 44 Market in North America , By Industry, 2013–2022 (USD Billion)
Table 45 Market in North America, By Country, 2013–2022 (USD Billion)
Table 46 Market in South America, By Module, 2013–2022 (USD Billion)
Table 47 Market in South America, By Hardware, 2013–2022 (USD Billion)
Table 48 Market in South America, By Industry, 2013–2022 (USD Billion)
Table 49 Market in South America, By Country, 2013–2022 (USD Billion)
Table 50 Market in Europe, By Module, 2013–2022 (USD Billion)
Table 51 Market in Europe, By Hardware, 2013–2022 (USD Billion)
Table 52 Market in Europe , By Industry, 2013–2022 (USD Billion)
Table 53 Market in Europe, By Country, 2013–2022 (USD Billion)
Table 54 Market in APAC, By Module, 2013–2022 (USD Billion)
Table 55 Market in APAC, By Hardware, 2013–2022 (USD Billion)
Table 56 Market in APAC, By Industry, 2013–2022 (USD Billion)
Table 57 Market in APAC, By Country, 2013–2022 (USD Billion)
Table 58 Market in RoW , By Module, 2013–2022 (USD Billion)
Table 59 Market in RoW, By Hardware, 2013–2022 (USD Billion)
Table 60 Market in RoW, By Industry, 2013–2022 (USD Billion)
Table 61 Market in RoW, By Region, 2013–2022 (USD Billion)
Table 62 New Product Launch, 2013–2015
Table 63 Partnerships & Joint Ventures, 2013–2014
Table 64 Partnership/ Collaboration/ Joint Venture, 2013–2015
Table 65 Mergers & Acquisitions, 2012–2015
List of Figures (74 Figures)
Figure 1 Smart Connected Assets and Operations Market: Research Design
Figure 2 Market Size Estimation Methodology: Bottom-Up Approach
Figure 3 Market Size Estimation Methodology: Top-Down Approach
Figure 4 Data Triangulation
Figure 5 APM Software & Platform Module to Grow at the Highest Rate During the Forecast Period
Figure 6 Healthcare Industry is Expected to Grow at the Highest Rate in the Market Between 2016 and 2022
Figure 7 Cellular Technolgies Expected to Grow at Higher Rate in Market for Wireless Conenctivity During the Forecast Period
Figure 8 Processors to Grow at the Highest Rate, in Terms of Value, in the Market During the Forecast Period
Figure 9 Market in APAC is Expected to Grow at the Highest Rate Between 2016 and 2022
Figure 10 Significant Increase in Demand for APM Software & Platform
Figure 11 Managed Service to Grow at the Highest Rate in the Smart Connected Assets and Operation Market During the Forecast Period
Figure 12 India Expected to Witness the Highest Growth Rate During the Forecast Period
Figure 13 Automotive and Transportation Held the Largest Market Share in APAC in 2015
Figure 14 Inpatient Monitoring Estimated to Grow at the Highest CAGR Between 2016 and 2022
Figure 15 Market in APAC in the Growth Stage, 2015
Figure 16 Smart Connected Assets and Operations: Market By Geography
Figure 17 Ability to Provide Better Operational Performance Expected to Spur the Growth of the Smart Connected Assets and Operation Market
Figure 18 World-Wide Ipv6 Deployment, 2009–2016
Figure 19 Increasing IoT Investment in Manufacturing Sector
Figure 20 Major Value Added During the Integration Phase
Figure 21 Impact of Intensity of Competitive Rivalry High in the Market in 2016
Figure 22 Market: Porter’s Five Forces Analysis
Figure 23 Intensity of Competitive Rivalry: High Competition in the Market Due to Competitor’s Market Share
Figure 24 Threat of Substitutes Likely to Remain Low Due to Low Number of Substitutes
Figure 25 Bargaining Power of Buyers to Be High Due to Product Differentiation
Figure 26 Bargaining Power of Suppliers Likely to Be Medium Due to Threat of Forward Integration
Figure 27 Threat of New Entrants Likely to Be Medium Due to Moderate R&D Expenses
Figure 28 Market Segmentation: By Module
Figure 29 Market Segmentation: By Hardware
Figure 30 Market for Processors Expected to Grow at A Higher Rate in South America During the Forecast Period
Figure 31 APAC Expected to Grow at the Highest Rate in Market for Sensors During the Forecast Period
Figure 32 Gyroscopes Expected to Grow at the Highest Rate, in Terms of Volume, in the Market for Sensors During the Forecast Period
Figure 33 South America Expected to Grow at Higher Rate in Smart Connected Assets and Operations for Network Conenctivity Market During the Forecast Period
Figure 34 Market Segmentation: By APM Software & Platform
Figure 35 Market Segmentation: By Service
Figure 36 Segmentation of the Market, By Industry
Figure 37 Market for Automotive and Transportation in APAC Expected to Grow at the Highest Rate Between 2016 and 2022
Figure 38 Market for Energy and Power Industry in APAC Expected to Grow at the Highest Rate During the Forecast Period
Figure 39 Market for the Healthcare Industry in RoW Expected to Grow at the Highest Rate Between 2016 and 2022
Figure 40 Market : By Smart Agriculture
Figure 41 APM Software and Platform to Lead the Market for the Factory Automation Industry During the Forecast Period
Figure 42 APM Software and Platform to Lead the Market for Other Industries During the Forecast Period
Figure 43 Market, By Geography
Figure 44 Market in APAC Expected to Register the Highest Growth Rate During the Forecast Period
Figure 45 Market in India, Brazil, and Africa Estimated to Grow at A High Rate Between 2016 and 2022
Figure 46 Market in the Americas
Figure 47 Market for the Healthcare Industry in South America to Grow at the High Rate Between 2016 and 2022
Figure 48 Snapshot of the Market in Europe
Figure 49 Market in Europe
Figure 50 Snapshot of the Market in APAC
Figure 51 Market in APAC
Figure 52 Market in RoW
Figure 53 Market for Processors in RoW Estimated to Grow at the Highest Rate Between 2016 and 2022
Figure 54 Key Growth Strategies Adopted By the Top Companies, 2013–2016
Figure 55 Market Ranking of the Top 5 Players in the Market, 2015
Figure 56 Market Evaluation Framework – Partnership/ Agreement/ Collaboration Fuelled Growth and Innovation Between 2013 and 2015
Figure 57 Battle for Market Share: New Product Launch Was the Key Strategy
Figure 58 Geographic Revenue Mix of Top Market Players
Figure 59 Intel Corporation: Company Snapshot
Figure 60 Intel Corporation: SWOT Analysis
Figure 61 Cisco Systems, Inc.: Company Snapshot
Figure 62 Cisco Systems, Inc.: SWOT Analysis
Figure 63 IBM Corporation: Company Snapshot
Figure 64 IBM Corporation: SWOT Analysis
Figure 65 Arm Holdings PLC: Company Snapshot
Figure 66 Arm Holdings PLC: SWOT Analysis
Figure 67 General Electric Co.: Company Snapshot
Figure 68 General Electric Company: SWOT Analysis
Figure 69 Texas Instruments Incorporated: Company Snapshot
Figure 70 Cypress Semiconductor Corporation: Company Snapshot
Figure 71 Rockwell Automation: Company Snapshot
Figure 72 Stmicroelectronics N.V.: Company Snapshot
Figure 73 NXP Semiconductors N.V.: Company Snapshot
Figure 74 PTC Inc.: Company Snapshot
The research methodology used to estimate and forecast the smart connected assets and operations market begins with obtaining data on key vendor revenues through secondary research from sources such as BI Intelligence Estimate, 2015, Google statistics. The vendor offerings have been taken into consideration to determine the market segmentation. The top-down procedure has been employed to arrive at the overall market size of the global smart connected assets and operations market, which includes number of installation of smart connected assets and operations worldwide, and average selling price in USD. After arriving at the overall market size, the total market has been split into several segments and sub segments, which have then been verified through primary research by conducting extensive interviews with key people such as CEOs, VPs, directors, and executives. The data triangulation and market breakdown procedures have been employed to complete the overall market engineering process and arrive at the exact statistics for all segments and sub segments.
To know about the assumptions considered for the study, download the pdf brochure
This report provides valuable insights regarding the smart connected assets and operations market such as research and development; hardware and software providers; connectivity providers; business analytics; system integrators; end user; after sales service. This study also answers several questions for the stakeholders such as which market segments to focus on in the next two to five years for prioritizing the efforts and investments.
The smart connected assets and operations system comprises hardware providers such as Intel Corporation (U.S.), Broadcom Corporation (U.S.), and Freescale Semiconductor, Inc. (U.S.), ARM holding plc (U.K.), Texas Instruments (U.S.), Cypress Semiconductor (U.S.), Rockwell Automation (U.S.), NXP Semiconductor (Netherlands), and STMicroelectronics N.V. (Switzerland), whereas software providers includes companies such as Cisco System Inc. (U.S), IBM Corporation (U.S.), General Electric Company (U.S.), ABB Ltd (Switzerland), Bentley systems incorporated (U.S.), Maintenance Assistant Inc. (U.S.), OMCS International (U.S.), and iSolution international Pvt. ltd ( Philippines).
Target Audience:
- Raw material & equipment suppliers
- Original Equipment Manufacturers (OEMs)
- Hardware providers such as processors, sensors
- Software providers such as Asset performance management
- System integrators
- Distributors
- Research Organizations
- Forums, Alliances and Associations
- Technology investors
- End user such as automotive & transportation, energy & power, healthcare, smart agriculture, and factory automation among others
Scope of the report:
The global smart connected assets and operations market, in this research report, has been segmented on the basis of module, industry and geography.
Smart connected assets and operations Market, by Module
- Hardware
- APM software & platform
- Service
Smart connected assets and operations Market, by Industry
- Automotive & Transportation
- Energy & Power
- Healthcare
- Smart Agriculture
- Factory Automation
- Others (Metal & Mining, Food & beverage, and Textile)
Smart connected assets and operations Market, by Geography
- Americas
- Europe
- APAC
- RoW
Available customizations:
With the given market data, MarketsandMarkets offers customizations as per a company’s specific needs. The following customization options are available for the report:
Geographic Analysis
- Comprehensive coverage of regulations followed in each region (the Americas, APAC, and Europe)
Company Information
- Detailed analysis and profiling of additional market players (up to five)













Growth opportunities and latent adjacency in Smart Connected Assets and Operations Market