The study involved four major activities in estimating the size of the IoT sensors market. Exhaustive secondary research has been done to collect information on the market, peer market, and parent market. Validation of these findings, assumptions, and sizing with industry experts across the value chain through primary research has been the next step. Both top-down and bottom-up approaches have been employed to estimate the global market size. After that, market breakdown and data triangulation have been used to estimate the market sizes of segments and subsegments.
Secondary Research
Secondary sources that were referred to for this research study include corporate filings (such as annual reports, investor presentations, and financial statements); trade, business, and professional associations; white papers; certified publications; articles from recognized authors; directories; and databases. Secondary data was collected and analyzed to arrive at the overall market size, further validated by primary research.
Primary Research
Extensive primary research was conducted after understanding and analyzing the IoT sensors market size scenario through the secondary research process. Several primary interviews were conducted with key opinion leaders from both the demand- and supply-side vendors across four major regions—North America, Asia Pacific, Europe, and RoW (including the Middle East & Africa and South America).
After interacting with industry experts, brief sessions were conducted with highly experienced independent consultants to reinforce the findings from our primary. This, along with the in-house subject matter experts’ opinions, has led us to the findings as described in the remainder of this report.

To know about the assumptions considered for the study, download the pdf brochure
IoT Sensors Market Size Estimation
In the complete market engineering process, both top-down and bottom-up approaches have been used, along with several data triangulation methods to perform market estimation and forecasting for the overall market segments and subsegments listed in this report. Extensive qualitative and quantitative analyses have been performed on the complete market engineering process to list key information/insights. The research methodology used to estimate the market size includes the following:
-
Key players in major applications and markets have been identified through extensive secondary research.
-
The industry’s supply chain and market size, in terms of value, have been determined through primary and secondary research processes.
-
All percentage shares, splits, and breakdowns have been determined using secondary sources and verified through primary sources.
After arriving at the overall market size from the market size estimation process explained above, the total market has been split into several segments and subsegments. To complete the overall market engineering process and arrive at the exact statistics for all segments and subsegments, the market breakdown and data triangulation procedures have been employed, wherever applicable. The data has been triangulated by studying various factors and trends from both demand-and supply-side. Along with this, the market has been validated using both top-down and bottom-up approaches.
IoT sensors Market Top-down Approach

Data Triangulation
After arriving at the overall market size through the process explained earlier, the total market was split into several segments. The market breakdown and data triangulation procedures were employed, wherever applicable, to complete the overall market engineering process and arrive at the exact statistics for all the segments and subsegments. The data was triangulated by studying various factors and trends from both the demand and supply sides. The market was validated using both the top-down and bottom-up approaches.
Market Definition
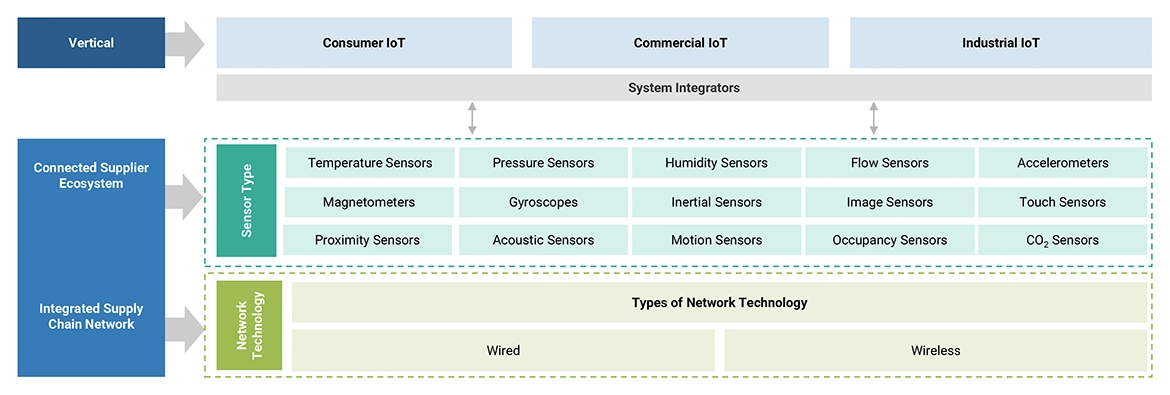
IoT sensors refer to sensors used in smart applications, which require uninterrupted connectivity to carry out real-time data analytics. They require common connecting platforms for collecting and analyzing data. IoT sensors are based on the computing concept that considers every physical object to be connected to the Internet to communicate with each other. Sensors are the most important component in the IoT ecosystem. They gather required data from their surroundings and communicate it to the concerned operators. Image, temperature, pressure, ultrasonic, light, and position sensors, accelerometers, and gyroscopes are the key sensors in the IoT ecosystem.
Key Stakeholders
-
Semiconductor Companies
-
Embedded System Companies
-
Consumer Electronics Manufacturers
-
Sensor Manufacturers
-
Technology Providers
-
Original Equipment Manufacturers (OEMs)
-
Universities and Research Organizations
-
Internet Identity Management, Privacy, and Security Companies
-
Machine-to-Machine (M2M), IoT, and Telecommunication Companies
-
Government Bodies
Report Objectives
-
To describe and forecast the size of the Internet of Things (IoT) sensors market in terms of value, based sensor type, network technology, vertical, and region
-
To forecast the market size, in terms of value, for various segments in four key regions, namely, North America, Europe, Asia Pacific (APAC), and the Rest of the World (RoW)
-
To forecast the size of the IoT sensors market size in terms of volume
-
To provide detailed information regarding the key factors such as drivers, restraints, opportunities, and challenges influencing the growth of the IoT sensors market
-
To analyze micromarkets1 with respect to individual growth trends, prospects, and contribution to the total market
-
To analyze the opportunities in the market for various stakeholders by identifying the
high-growth segments of the IoT sensors market size
-
To profile the key players and comprehensively analyze their market ranking and core competencies2, along with a detailed competitive landscape for the market leaders.
-
To map the competitive intelligence based on the company profiles, key player strategies, and game-changing developments, such as product launches and developments, partnerships, collaborations, and acquisitions undertaken in the market.
Available customizations:
MarketsandMarkets offers the following customizations for this market report:
-
Further breakdown of the market in different regions to the country-level
-
Detailed analysis and profiling of additional market players (up to 5)


Kalle
Aug, 2016
We are interested in the thermopile part of the market. Do you have any information of companies like Heimann ad Excelitas in the report?.
Ali
Jun, 2019
We provide need to IoT solutions including sensor manufacturer and are interested in the predicted market demand .
Pham
Mar, 2019
I am new researcher in field of IoT. I am looking for suitable sensor and free sample for investigating..
Leo
May, 2019
I am looking for the market that meet needs to be our market driven. Then, I want to know which kind of IoT sensor has potential market size and to match the technology what we have. .
Mitch
Sep, 2017
I am interested in getting some clarity around the non-SCADA, non-IoT IoT, sensor marketplace. Retrofit, crossover, and emerging light industrial. is this addressed in your report?.
Clara
Jun, 2019
I would like to have an overview of this report for a task I'm conducting on Power Solutions for IoT devices, current and future trends, especially in the field of energy management..
Petar
Aug, 2019
Looking for a market share of IoT sensors especially for use in remote areas such as Mining, Energy, Agriculture etc.. .
PhillipineKambula
Nov, 2019
We are currently building an application that entails some IoT elements and we want to better understand the IoT Sensor Market and the Global Forecast to understand what the future holds for the Africa market .
Arijit
Nov, 2019
As an enterprise architect, intelligent edge solutions also come under my solution port. Therefore, such market intelligence is essential for me.
Leonardo
Oct, 2019
Hi, My company is a "start-up" in segment of IoT Sensor with focus in Temperature and Humidity Sensors and Energy Sensors. I want access to the article to better understand it market and how it will expand in next years..
Michael
May, 2019
Hello! I am doing some research on the sensor market. I would appreciate your time to clarify any details you shared on the report. Just a heads up that I am out of the country for travel so please contact me via email..
Alonso
May, 2019
We are seeking to expand our portfolio of IoT solutions and would like to get a brief overview as to who are the key players in this market..
Michael
Apr, 2019
Hello! I am looking to do research on the IoT sensors market for supply chain management. This report looks very useful. .
Matthew
Mar, 2018
When you say 'market will USD 38 BN', please explain its scope are also. Is it include entire IoT sensor ecosystem or just devices, applications, and services? You get the drift. .
Andrei
Feb, 2019
We do have unbalanced sensors manufacturing in Russia. It is interesting to see where the rest of the world is going for this market. .
Massimo
Jan, 2019
Research in the field of ultra-low power chips for IoT sensor nodes (www.green-ic.org), with an interest to start-up a company in this space..