Smart Harvest Market by Site of Operation (On-field, Greenhouse, Indoor), Component (Harvesting Robots, Automation & Control Systems, Imaging Systems, Sensors, Software), Crop Type (Fruits and Vegetables), and Region - Global Forecast to 2023


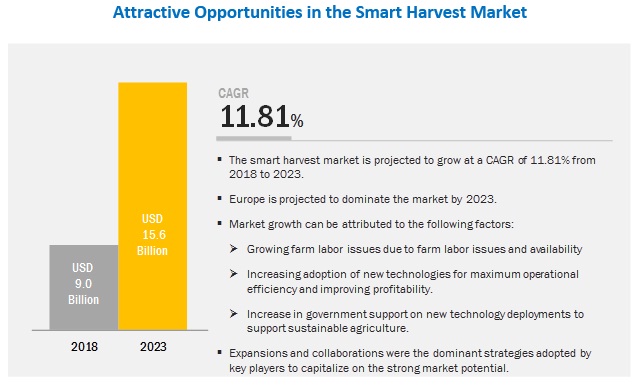
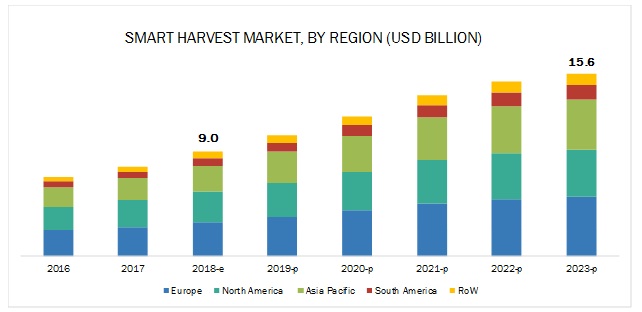
[136 Pages Report] The smart harvest market is projected to reach USD 15.6 billion by 2023, from USD 9.0 billion in 2018, at a CAGR of 11.81% during the forecast period. The rise in population has led to increased food demand, which in turn has led to increased pressure on farmers to increase yield and area harvested for various crops. However, global labor shortage in agriculture is one of the major factors leading to loss of yield due to improper maintenance and farming practices. To cater to this issue, farmers are highly adopting farm mechanization and other smart agriculture techniques to optimize their crop yields.
On the basis of component, the hardware segment is projected to be the largest contributor in the smart harvest market during the forecast period
The global market has been segmented on the basis of component into hardware and software. The market for software is projected to record the higher CAGR between 2018 and 2023. The hardware aspect of the smart harvest market includes harvesting robots, automation and control systems, sensors, and imaging systems. All three hardware components are designed to coordinate their activities to move, identify, and harvest the fruit/vegetable. In the coming years, the integration of AI (Artificial Intelligence) in the smart harvest systems would allow the machines to make their own decisions based on the appropriate parameters.
Declining farmlands to drive growth for indoor farming applications of smart harvest in the coming years
The smart harvest market is segmented on the basis of site of operation into on-field, greenhouses, and indoor farming. The market for on-field systems is projected to record the highest CAGR between 2018 and 2023. The development of smart harvest technologies and robots aims to minimize the impact of labor shortage, while also maximizing the benefits realized by the end users in the form of cost and time benefits. Declining farmlands in developing countries are expected to favor the growth for indoor systems during the next decade.
Improving hardware dexterity drives the growth for harvesting robot technologies in fruits during the forecast period
The harvesting robots market is segmented on the basis of crop type into vegetables and fruits. Manufacturers are developing and testing various harvesting robot technologies for commercial deployment during the forecast period. The current generation of smart harvest technologies is capable of harvesting a variety of fruits including apples, strawberries, and citrus fruits (lemons and oranges). The use of smart harvest systems expands the possibilities of integrating yield monitoring sensors and ripening controllers across a wide variety of fruits.
Europe is projected to account for the largest market share by 2023
The European smart harvest market is estimated to be the largest by 2023, while the Asia Pacific market is projected to grow as the fastest-growing region from 2018 to 2023. Europe and North America also host the largest concentration of manufacturers in the smart harvest industry, with major industry leaders maintaining their operations in the region. The strong agriculture sector in the region and increasing dependence on technology is expected to bolster prospects for the global market in the Asia Pacific region.
Key players in the market include Robert Bosch GmbH (Germany), Deere & Company (US), Smart Harvest Ltd. (UK), Dogtooth Technologies (UK), Harvest Automation (US), Panasonic Corporation (Japan), Root AI (US), Abundant Robotics (US), Iron Ox (US), Agrobot (Spain), Energid Technologies Corp. (US), FFRobotics (Israel), Vision Robotics Corp. (US), Metomotion (Israel), AVL Motion (Netherlands), and Harvest Croo (US). These players are undertaking a strategy involving new product development and launches, and divestments to improve their market position and extend their core competitive advantage.
Scope of the report
|
Report Metric |
Details |
|
Market size estimation |
2016�2023 |
|
Base year considered |
2017 |
|
Forecast period considered |
2018�2023 |
|
Units considered |
Value (USD) |
|
Segments covered |
Component, Site of Operation, Crop Type, and Region |
|
Regions covered |
North America, Asia Pacific, Europe, South America and RoW |
|
Companies studied |
Robert Bosch GmbH (Germany), Deere & Company (US), Smart Harvest Ltd. (UK), Dogtooth Technologies (UK), Harvest Automation (US), Panasonic Corporation (Japan), Root AI (US), Abundant Robotics (US), Iron Ox (US), Agrobot (Spain), Energid Technologies Corp. (US), FFRobotics (Israel), Vision Robotics Corp. (US), Metomotion (Israel), AVL Motion (Netherlands), and Harvest Croo (US). |
This research report categorizes the smart harvest market based on component, site of operation, and crop type.
Target Audience
- Smart agricultural robot manufacturers
- Smart networking system and software developers
- Precision farming related technology providers
- Agriculture equipment and component providers
- Public institution and private research professionals
- OEM suppliers for agriculture equipment
- Government and regulatory authorities
- Associations, organizations, forums, and alliances related to semiconductor, agriculture, and automotive industries
Report Scope
Component
- Hardware
- Automation & control systems
- Sensors
- Imaging systems
- Harvesting robots
- Software
Site of Operation
- On-Field
- Greenhouse
- Indoor
Crop Type:
- Fruits
- Vegetables
By Region
- North America
- Europe
- Asia Pacific
- South America
- Rest of the World (RoW)
Critical questions the report answers:
- Where will all these developments take the industry in the mid to long term?
- What are the upcoming commercial applications for smart harvest robots?
- What is the impact of the indoor farming industry on smart harvest?
- What are the new technologies being introduced in smart harvest?
- What are the latest trends in smart harvest?
Frequently Asked Questions (FAQ):
What is the competitive scenario of the top players in smart harvest market?
There is an increase in new product developments and launches and divestments by the key players such as Robert Bosch GmbH, Deere & Company and Smart Harvest Ltd.
What are the factors constraining the growth of smart harvest market?
The global labor shortage in agriculture is one of the major factors leading to loss of yield due to improper maintenance and farming practices. To cater to this issue, farmers are highly adopting farm mechanization and other smart agriculture techniques to optimize their crop yields.
What are the factors that drive the growth of smart harvest market?
Growing farm labor issues and availability, increasing adoption of new technologies for maximum operational efficiency and improving profitability and increase in government support on new technology deployment to support sustainable agriculture are the factors that attribute to the market growth.
Which region is projected to dominate the smart harvest market?
The European smart harvest market is estimated to be the largest by 2023. Europe hosts the largest concentration of manufacturers in the smart harvest industry, with major industry leaders maintaining their operations in the region.
Why does Asia Pacific account for the fastest growth in smart harvest market?
The strong agriculture sector in the region and increasing dependence on technology is expected to bolster prospects for the smart harvest market in the Asia Pacific region. .
To speak to our analyst for a discussion on the above findings, click Speak to Analyst
 Exclusive indicates content/data unique to MarketsandMarkets and not available with any competitors.
Table of Contents
1 Introduction (Page No. - 15)
1.1 Objectives of the Study
1.2 Market Definition
1.3 Study Scope
1.4 Periodization Considered
1.5 Currency Considered
1.6 Stakeholders
2 Research Methodology (Page No. - 19)
2.1 Research Data
2.1.1 Secondary Data
2.1.2 Primary Data
2.1.2.1 Key Industry Insights
2.1.2.2 Breakdown of Primary Interviews
2.2 Market Size Estimation
2.3 Data Triangulation
2.4 Research Assumptions
2.5 Limitations
3 Executive Summary (Page No. - 26)
4 Premium Insights (Page No. - 31)
4.1 Attractive Opportunities in the Global Market
4.2 Smart Harvest Market, By Component
4.3 North America: Smart Harvest Market, By Site of Operation and Country
4.4 Harvesting Robots Market, By Crop Type
4.5 Smart Harvest Market Share, By Key Country
5 Market Overview (Page No. - 36)
5.1 Introduction
5.2 Macroeconomic Indicators
5.2.1 Decreasing Farm Landholding Capacity
5.2.2 Export Potential of Global Markets
5.3 Market Dynamics
5.3.1 Drivers
5.3.1.1 Growing Farm Labor Issues Due to Higher Costs and Availability
5.3.1.2 Improving Profitability in Farming Through the Adoption of Advanced Technologies
5.3.1.3 Cost Efficiency Benefits Offered By Smart Harvest Systems
5.3.1.4 Favorable Government Initiatives to Propel the Adoption of Smart Harvest Systems
5.3.2 Restraints
5.3.2.1 High Capital Costs Involved in the Deployment of Smart Harvest Technologies
5.3.3 Opportunities
5.3.3.1 High-Growth Opportunities for Simpler Harvest Technologies in Developing Countries
5.3.3.2 High-Growth Opportunities for Automated Harvesting Robots in Developed Countries
5.3.3.3 Integration of Artificial Intelligence and Big Data in Farming
5.3.4 Challenges
5.3.4.1 Collection, Management, and Representation of Data Gathered By Smart Harvest Systems
5.3.4.2 Commercial Deployment of Smart Harvest Technologies is A Slow and Gradual Process
5.3.4.3 Limited Technical Knowledge Possessed By Farmers Toward Smart Harvest Technologies
5.4 Regulatory Framework
5.4.1 Regulatory Framework for Drones
5.4.1.1 Drone Regulations in India
5.4.1.2 US Drone Regulations
5.4.1.3 UK Drone Regulations
5.4.1.4 Other Drone Regulations
5.4.2 European Union Regulatory Framework for Robots
5.4.2.1 A Common Definition of Smart Autonomous Robots
5.4.2.1.1 Terminological Limits of the Notions of an �Autonomous Robot� and A �Smart Robot�
5.4.2.2 Liability for Damages Caused By an Autonomous Robot
6 Smart Harvest Market, By Site of Operation (Page No. - 54)
6.1 Introduction
6.2 On-Field
6.2.1 Technological Advancements in Positioning Systems to Drive Growth for On-Field Applications
6.3 Greenhouses
6.3.1 Smart Greenhouses to Bolster Prospects for Smart Harvest Technologies
6.4 Indoor Farming
6.4.1 Shrinking Agricultural Land and Technological Innovations in Indoor Farming to Aid Market Growth
7 Smart Harvest Market, By Crop Type (Page No. - 61)
7.1 Introduction
7.2 Vegetables
7.2.1 Equipment Availability to Drive Growth for Smart Vegetable Harvesting
7.3 Fruits
7.3.1 Labor Shortages and High Costs of Manual Harvesting to Drive Growth of Smart Harvest of Fruits
8 Smart Harvest Market, By Component (Page No. - 66)
8.1 Introduction
8.2 Hardware
8.2.1 Advancements in Imaging Systems to Drive Growth for Hardware Components in Smart Harvest Robots
8.3 Software
8.3.1 Requirement of Optimum Functionality and Efficient Hardware Integration to Drive the Growth of Software Applications in Smart Harvest Systems
9 Smart Harvest Market, By Region (Page No. - 72)
9.1 Introduction
9.2 North America
9.2.1 US
9.2.1.1 Labor Shortages and Technological Advancements to Drive US Smart Harvest Market
9.2.2 Canada
9.2.2.1 Increasing Greenhouses and Demand for Connected Systems to Bolster Prospects in Canadian Smart Harvest Market
9.2.3 Mexico
9.2.3.1 Increasing Exports Drive Growth for Smart Harvest Technologies in Mexico
9.3 Europe
9.3.1 Germany
9.3.1.1 Government Policies to Overhaul German Smart Harvest Market
9.3.2 UK
9.3.2.1 Skilled Workforce in UK Farms Seeking to Integrate Smart Harvest Systems
9.3.3 France
9.3.3.1 Modernization of French Farms to Be the Key Driver for Smart Harvest Systems in the Country
9.3.4 Italy
9.3.4.1 Demand From Greenhouses to Fuel Market Growth for Smart Harvest Technologies in Italy
9.3.5 Netherlands
9.3.5.1 Robust Agriculture Industry and Trade Prospects Drives Demand for Smart Harvest in the Netherlands
9.3.6 Rest of Europe
9.4 Asia Pacific
9.4.1 China
9.4.1.1 Increasing Population and Government Initiatives Drive Growth for Smart Harvest Technologies in China
9.4.2 Japan
9.4.2.1 Sensors and Robots Pave the Way for Smart Harvest Growth in Japan
9.4.3 Australia
9.4.3.1 Public-Private Partnerships Play A Key Role in Developing Smart Harvest Systems in Australia
9.4.4 Rest of Asia Pacific
9.5 South America
9.5.1 Brazil
9.5.1.1 Untapped Agriculture Potential in Brazil to Improve Prospects for Smart Harvest Market
9.5.2 Argentina
9.5.2.1 Increasing Adoption of Advanced Farming Equipment in Argentina Supplements Growth of Smart Harvest Technologies.
9.6 Rest of South America
9.6.1 Rest of the World (Row)
9.6.2 Middle East
9.6.2.1 High-Value Crop Farmers in the Middle East Seek to Integrate Smart Harvest Technologies
9.6.3 Africa
9.6.3.1 Regional and International Efforts Seek to Integrate Smart Harvest Technologies in African Agriculture Industry
10 Competitive Landscape (Page No. - 100)
10.1 Overview
10.2 Competitive Leadership Mapping
10.3 Progressive, Responsive, Dynamic, and Starting Blocks
10.3.1 Progressive Companies
10.3.2 Responsive Companies
10.3.3 Dynamic Companies
10.3.4 Starting Blocks
10.4 Competitive Scenario & Trends
10.4.1 New Product Development and Launches
10.4.2 Divestment
11 Company Profiles (Page No. - 105)
(Business Overview, Products Offered, Recent Developments, SWOT Analysis, MnM View)*
11.1 Deere & Company
11.2 Robert Bosch GmbH
11.3 Panasonic Corporation
11.4 Energid Technologies Corporation
11.5 Smart Harvest Ltd.
11.6 Harvest Automation
11.7 Dogtooth Technologies
11.8 AVL Motion B.V.
11.9 Abundant Robotics
11.10 Iron Ox
11.11 Ffrobotics
11.12 Vision Robotics Corporation
11.13 Metomotion
11.14 Agrobot
11.15 Harvest Croo
11.16 Root AI
11.17 Key Innovators
11.17.1 Exabit Systems Pvt. Ltd.
11.17.2 Cerescon B.V.
11.17.3 Octinion BVBA
11.17.4 KMS Projects Ltd.
*Details on Business Overview, Products Offered, Recent Developments, SWOT Analysis, MnM View Might Not Be Captured in Case of Unlisted Companies.
12 Appendix (Page No. - 129)
12.1 Knowledge Store: Marketsandmarkets� Subscription Portal
12.2 Available Customizations
12.3 Related Reports
12.4 Author Details
List of Tables (63 Tables)
Table 1 USD Exchange Rate, 2014�2017
Table 2 Global Production of Fruits & Vegetables, 2011�2013 (Million Mt)
Table 3 Rules and Guidelines By the Faa for the Operation of Drones in the US
Table 4 Rules and Guidelines By the Caa (UK) for the Operation of Drones
Table 5 Rules and Guidelines for the Operation of Drones in Other Countries
Table 6 Smart Harvest Market Size, By Site of Operation, 2016�2023 (USD Million)
Table 7 US: Number of Farmholders, By Farm Size, 2017 (Acre)
Table 8 Smart Harvest Market Size in On-Field Farming, By Component, 2016�2023 (USD Million)
Table 9 Market Size in On-Field Farming, By Region, 2016�2023 (USD Million)
Table 10 Canada: Greenhouse Industry, 2015
Table 11 Smart Harvest Market Size in Greenhouses, By Component, 2016�2023 (USD Million)
Table 12 Market Size in Greenhouses, By Region, 2016�2023 (USD Million)
Table 13 Market Size in Indoor Farming, By Component, 2016�2023 (USD Million)
Table 14 Market Size in Indoor Farming, By Region, 2016�2023 (USD Million)
Table 15 Harvesting Robots Market, By Crop Type, 2016�2023 (USD Million)
Table 16 Harvesting Robots Market Size in Vegetable Cultivation, By Region, 2016�2023 (USD Million)
Table 17 Harvesting Robots Market Size in Fruit Cultivation, By Region, 2016�2023 (USD Million)
Table 18 Smart Harvest Market Size, By Component, 2016�2023 (USD Million)
Table 19 Component: Market Size For Smart Harvest, By Region, 2016�2023 (USD Million)
Table 20 Hardware: Market Size For Smart Harvest, By Region, 2016�2023 (USD Million)
Table 21 Hardware: Market Size, By Type, 2016�2023 (USD Million)
Table 22 Software: Market Size For Smart Harvest, By Region, 2016�2023 (USD Million)
Table 23 Smart Harvest Market Size, By Region, 2016�2023 (USD Million)
Table 24 North America: Smart Harvest Market Size, By Component, 2016-2023 (USD Million)
Table 25 North America: Market Size, By Site of Operation, 2016-2023 (USD Million)
Table 26 North America: Harvesting Robots Market Size, By Crop Type, 2016-2023 (USD Million)
Table 27 North America: Market Size, By Country, 2016-2023 (USD Million)
Table 28 US: Market Size For Smart Harvest, By Component, 2016-2023 (USD Million)
Table 29 Canada: Market Size For Smart Harvest, By Component, 2016-2023 (USD Million)
Table 30 Mexico: Market Size For Smart Harvest, By Component, 2016-2023 (USD Million)
Table 31 Europe: Market Size For Smart Harvest, By Country, 2016-2023 (USD Million)
Table 32 Europe: Market Size, By Component, 2016-2023 (USD Million)
Table 33 Europe: Market Size, By Site of Operation, 2016-2023 (USD Million)
Table 34 Europe: Harvesting Robots Market Size, By Crop Type, 2016-2023 (USD Million)
Table 35 Germany: Smart Harvest Market Size, By Component, 2016-2023 (USD Million)
Table 36 UK: Market Size For Smart Harvest, By Component, 2016-2023 (USD Million)
Table 37 France: Market Size For Smart Harvest, By Component, 2016-2023 (USD Million)
Table 38 Italy: Market Size For Smart Harvest, By Component, 2016-2023 (USD Million)
Table 39 Netherlands: Market Size For Smart Harvest, By Component, 2016-2023 (USD Million)
Table 40 Rest of Europe: Market Size For Smart Harvest, By Component, 2016-2023 (USD Million)
Table 41 Asia Pacific: Market Size For Smart Harvest, By Country, 2016-2023 (USD Million)
Table 42 Asia Pacific: Market Size, By Component, 2016-2023 (USD Million)
Table 43 Asia Pacific: Market Size, By Site of Operation, 2016-2023 (USD Million)
Table 44 Asia Pacific: Harvesting Robots Market Size, By Crop Type, 2016-2023 (USD Million)
Table 45 China: Smart Harvest Market Size, By Component, 2016-2023 (USD Million)
Table 46 Japan: Market Size For Smart Harvest, By Component, 2016-2023 (USD Million)
Table 47 Australia: Market Size For Smart Harvest, By Component, 2016-2023 (USD Million)
Table 48 Rest of Asia Pacific: Market Size For Smart Harvest, By Component, 2016-2023 (USD Million)
Table 49 South America: Smart Harvest Market Size, By Country, 2016-2023 (USD Million)
Table 50 South America: Market Size, By Component,2016-2023 (USD Million)
Table 51 South America: Market Size, By Site of Operation, 2016-2023 (USD Million)
Table 52 South America: Harvesting Robots Market Size, By Crop Type, 2016-2023 (USD Million)
Table 53 Brazil: Market Size For Smart Harvest, By Component, 2016-2023 (USD Million)
Table 54 Argentina: Market Size For Smart Harvest, By Component, 2016-2023 (USD Million)
Table 55 Rest of South America: Market Size For Smart Harvest, By Component, 2016-2023 (USD Million)
Table 56 RoW: Market Size For Smart Harvest, By Region, 2016-2023 (USD Million)
Table 57 RoW: Market Size, By Component, 2016-2023 (USD Million)
Table 58 RoW: Market Size, By Site of Operation, 2016-2023 (USD Million)
Table 59 RoW: Harvesting Robots Market Size, By Crop Type, 2016-2023 (USD Million)
Table 60 Middle East: Market Size For Smart Harvest, By Component, 2016-2023 (USD Million)
Table 61 Africa: Market Size For Smart Harvest, By Component, 2016-2023 (USD Million)
Table 62 New Product Development and Launches, 2017-2018
Table 63 Divestment, 2016
List of Figures (38 Figures)
Figure 1 Smart Harvest: Market Segmentation
Figure 2 Regional Segmentation
Figure 3 Smart Harvest Market: Research Design
Figure 4 Breakdown of Primary Interviews: By Company Type, Designation, and Region
Figure 5 Market Size Estimation Methodology: Bottom-Up Approach
Figure 6 Market Size Estimation Methodology: Top-Down Approach
Figure 7 Data Triangulation Methodology
Figure 8 Market Size For Smart Harvest, By Component, 2018 vs. 2023 (USD Million)
Figure 9 Market Size For Smart Harvest, By Site of Operation, 2018 vs. 2023 (USD Million)
Figure 10 Harvesting Robots Market Size, By Crop Type, 2018 vs. 2023 (USD Million)
Figure 11 Market Size For Smart Harvest: Regional Snapshot
Figure 12 Smart Harvest Market is Driven By The Increasing Adoption of New Technologies in Farming for Maximum Profitability and Production
Figure 13 Hardware Segment is Projected to Dominate The Market Through 2023
Figure 14 On-Field Segment Accounted for A Significant Market Share in North America in 2017
Figure 15 Fruits Segment Dominated The Harvesting Robots Market in 2017
Figure 16 US, Japan, and Germany: Important Markets for Smart Harvest, 2017
Figure 17 Smart Farm Process Flow
Figure 18 Global Land Area Adopted for Agricultural Activities (%), 2000�2015
Figure 19 Market Dynamics: Drivers, Restraints, Opportunities, and Challenges
Figure 20 Global Population Growth Projection Till 2100
Figure 21 Global Robot Density, 2003�2015
Figure 22 Global Production of Fruits and Vegetables, 2011�2013 (Mmt)
Figure 23 US: Apple Production Trend , 2014�2016 (Mmt)
Figure 24 China to Witness The Fastest Growth in The Smart Harvest Market, 2018-2023
Figure 25 North America: Market Snapshot, 2017
Figure 26 Share of Labor Shortages in US Farms, 2017
Figure 27 Europe: Market Snapshot, 2017
Figure 28 Asia Pacific: Market Snapshot, 2017
Figure 29 Key Developments of The Leading Players in The Smart Harvest Market for 2016-2018
Figure 30 Smart Harvest Market: Competitive Leadership Mapping, 2018
Figure 31 Deere & Company: Company Snapshot
Figure 32 Deere & Company: SWOT Analysis
Figure 33 Robert Bosch GmbH: Company Snapshot
Figure 34 Robert Bosch GmbH: SWOT Analysis
Figure 35 Panasonic Corporation: Company Snapshot
Figure 36 Panasonic Corporation: SWOT Analysis
Figure 37 Energid Technologies Corporation: SWOT Analysis
Figure 38 Smart Harvest: SWOT Analysis
The study involved four major activities in estimating the market size for smart harvest. Exhaustive secondary research was conducted to collect information on the market, peer market, and parent market. The next step was to validate these findings, assumptions, and sizing with industry experts across the value chain through primary research. Both top-down and bottom-up approaches were employed to estimate the complete market size. Thereafter, market breakdown and data triangulation were used to estimate the market size of segments and subsegments.
Secondary Research
In the secondary research process, various secondary sources such as Hoovers, Bloomberg BusinessWeek, and Factiva have been referred to, so as to identify and collect information for this study. These secondary sources included annual reports, press releases & investor presentations of companies, white papers, certified publications, articles by recognized authors, gold & silver standard websites, agricultural organizations, regulatory bodies, trade directories, and databases.
Primary Research
The market comprises several stakeholders such as raw material suppliers, technology and service providers, end-product manufacturers, and regulatory organizations in the supply chain. The demand side of this market is characterized by the technology adoption and diverse application industries. The supply side is characterized by development of the robotics, software applications, and sensor technologies. Various primary sources from both the supply and demand sides of the market were interviewed to obtain qualitative and quantitative information. Given below is the breakdown of the primary respondents.
To know about the assumptions considered for the study, download the pdf brochure
Market Size Estimation
Both top-down and bottom-up approaches were used to estimate and validate the total size of the smart harvest market. These methods were also used extensively to estimate the size of various subsegments in the market. The research methodology used to estimate the market size includes the following:
- The key players in the industry and markets have been identified through extensive secondary research.
- The industry�s supply chain and market size, in terms of value, have been determined through primary and secondary research processes.
- All percentage shares, splits, and breakdowns have been determined using secondary sources and verified through primary sources.
Data Triangulation
After arriving at the overall market size-using the market size estimation processes as explained above-the market was split into several segments and subsegments. In order to complete the overall market engineering process and arrive at the exact statistics of each market segment and subsegment, the data triangulation and market breakdown procedures were employed, wherever applicable. The data was triangulated by studying various factors and trends from both the demand and supply sides in the food, feed, and pharmaceutical, nutraceutical, and personal care industries.
Report Objectives
- To describe and forecast the smart harvest market, in terms of component, site of operation, crop type, and region
- To describe and forecast the smart harvest market, in terms of value, by region�Asia Pacific, Europe, North America, South America, and the Rest of the World-along with their respective countries
- To provide detailed information regarding the major factors influencing market growth (drivers, restraints, opportunities, and challenges)
- To strategically analyze micromarkets with respect to individual growth trends, prospects, and contributions to the overall market
- To study the complete value chain of smart harvest
- To analyze opportunities in the market for stakeholders by identifying the high-growth segments of the smart harvest ecosystem
- To strategically profile key players and comprehensively analyze their market position in terms of core competencies, along with detailed competitive landscape for market leaders
- To analyze strategic approaches such as product launches, agreements, and partnerships in the smart harvest market
Available Customizations
Based on the given market data, MarketsandMarkets offers customizations in the reports according to the client�s specific requirements. The available customization options are as follows:
Product Analysis
- Product matrix, which gives a detailed comparison of the product portfolio of each company
Regional Analysis
- Further country-wise breakdown of the market in North America and Europe, based on site of operation
Company Information
- Detailed analysis and profiling of additional market players (Up to 5)


Growth opportunities and latent adjacency in Smart Harvest Market