Smart Plantation Management Systems Market by Type (Irrigation Systems, Plant Growth Monitoring Systems, and Harvesting Systems), Crop (Coffee, Oilseeds, Sugarcane, and Cotton), Component (Hardware and Software), and Region - Global Forecast to 2025


Smart Plantation Management Systems Market
Smart Plantation Management Systems Market Key Drivers, Restraint & Challenge:
Smart plantation management systems include hardware and software technologies that help in enhancing and optimizing the production of plantation crops grown on a large scale, mostly in tropical & sub-tropical climatic conditions. This system is used to enhance the quality and quantity of plantation crops with optimized usage of resources. The growth of this market is attributed to the increase in adoption of plantation intelligence and data mining by farmers.
Key Drivers:
- Increase in the adoption of plantation intelligence and data mining by farmers
- Reduction in the wastage of resource and manpower
Key Restraint & Challenge:
- High capital investment in the deployment of smart plantation
- Data aggregation and lack of awareness associated with smart plantation management systems
Types of smart plantation management systems :
Smart plantation management systems aim to increase the quantity and quality of plantation crops with optimized usage of resource. With smart plantation management systems, a farmer can monitor the needs of crops better and adjust their nutrient, water, pesticides, and fertilizer requirements. The smart plantation management systems market is dominated by the irrigation systems segment due to the greater adoption and application of these systems in wide varieties of plantation.
- Irrigation systems
- Plant growth monitoring systems
- Harvesting system
Top 10 players in Smart Plantation Management industry:
The competitive landscape provides an overview of the relative market position of the key players operating in the smart plantation management system market, based on the strength of their project offerings and business strategies, analyzed based on a proprietary model. Key players in the market have majorly adopted strategies such as new product launches, agreements, collaborations, and joint ventures, expansions, and acquisitions. Some of the major players in the market are:
- Robert Bosch
- Deere & Company
- Netafim
- Synelixis Solutions
- DTN
- Agroweblab Co Ltd
- Tevatronics
- Semiosbio Technologies
- Waterbit
- Phytech
- Arjuna Natural Extracts Ltd
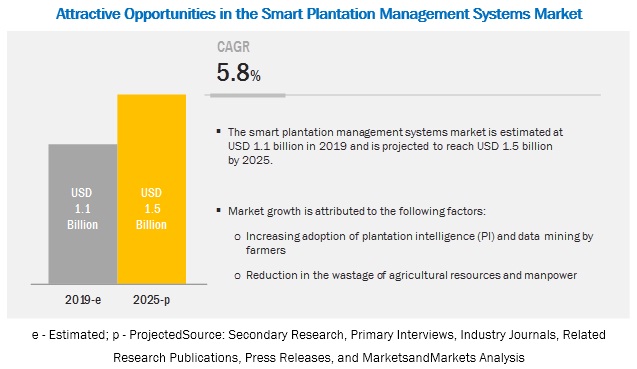
[147 Pages Report] The smart plantation management systems market is projected to grow from USD 1.1 billion in 2019 to USD 1.5 billion by 2025, recording a CAGR of 5.8% during the forecast period. This is attributed to an increase in the adoption of plantation intelligence (PI) and data mining by farmers and reduction in the wastage of resources and manpower.
The irrigation systems segment is estimated to account for the largest market share in 2019 in the smart plantation management systems.
The irrigation systems segment is estimated to dominate the market for smart plantation management systems, by type, in terms of value, in 2019. Smart irrigation systems control and monitor the water scheduling for plantation crops based on the data collected by sensors. Furthermore, the use of smart irrigation systems reduces the amount of water needed for irrigation, resulting in the reduction of operation cost, specifically for large farmland. According to the tests by the Irrigation Association (IA) and the International Center for Water Technology (California), smart irrigation systems save about 20% more water than traditional irrigation systems, which is one of the major factors driving its demand in the market.
By crop, the fruit segment is projected to account for the largest market share during the forecast period.
The smart plantation management systems market, by crop, was dominated by the fruits segment throughout the forecasted period, as fruits have emerged as a key crop for the usage of smart plantation management systems, given the large number of players offering smart plantation systems for fruits and technologies developed for different types of fruits. Grapes, citrus fruits, and apples are the major fruits where smart plantation management systems have been implemented due to their higher consumption.
The hardware segment in the smart plantation management systems is estimated to dominate the market.
The market for hardware is estimated to dominate the smart plantation management systems in 2019. The hardware component consists of various sensors, controllers, GPS devices, displays, flow meters, solenoid valves, and switches, among others. Sensors are installed on the plants or soil to sense and collect real-time data, which is used to generate reports and maps to assist farmers in making decisions about their crops. Some of the major sensors used are soil, water, weather, moisture, wind intensity, and temperature sensors. Thus, advancement in software systems drives the growth of hardware components.
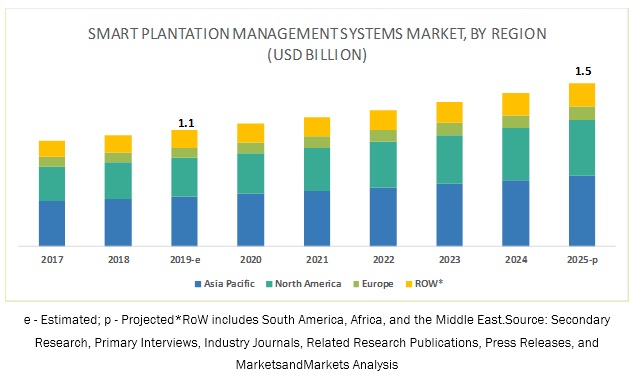
Asia Pacific is projected to account for the largest market share in the smart plantation management systems during the forecast period.
The Asia Pacific market accounted for the largest share in 2018. This dominance is attributed to the favorable climatic conditions for plantation crops. It has a huge potential due to the large cultivation of plantation crops, which include tea, sugarcane, and cotton. The deployment of smart plantation management systems in the region is still in its nascent stage and is expected to witness robust growth that will improve the crop yield with optimized usage of resources. China holds the major market share due to the presence of a large cultivation area for plantation crops, specifically for tea, sugarcane, and fruits.
Key Market Players
The key vendors in the global smart plantation management systems include Robert Bosch (Germany), Deere & Company (US), Netafim (Israel), Synelixis Solutions (Greece), DTN (US), AgroWebLab Co., Ltd (AWL) (China), Tevatronics (Israel), SemiosBio Technologies (Canada), WaterBit (US), Phytech (Israel), Rivulis (Israel), Jain Irrigation Systems (India), Hidrosoph (Portugal), and AquaSpy (US). These players have broad industry coverage and strong operational and financial strength.
Scope of the report
|
Report Metric |
Details |
|
Market size available for years |
2017�2025 |
|
Base year considered |
2018 |
|
Forecast period |
2019�2025 |
|
Forecast units |
Value (USD Million) and Volume (Units) |
|
Segments covered |
Type, Crop, Component, and Region |
|
Geographies covered |
North America, Europe, Asia Pacific, and RoW |
|
Companies covered |
Robert Bosch (Germany), Deere & Company (US), Netafim (Israel), Synelixis Solutions (Greece), DTN (US), AgroWebLab Co., Ltd (China), SemiosBio Technologies (Canada), WaterBit (US), Phytech (Israel), Tevatronics (Israel), Rivulis (Israel), Jain Irrigation Systems (India), Hidrosoph (Portugal), and AquaSpy (US). |
This research report categorizes the smart plantation management systems market based on type, crop, component, and region.
Based on type, the smart plantation management systems market has been segmented as follows:
- Irrigation systems
- Plant growth monitoring systems
- Harvesting systems
Based on crop, the smart plantation management systems market has been segmented as follows:
- Coffee
- Oilseeds
- Sugarcane
- Cotton
- Fruits
- Others (cocoa, coconuts, areca nuts, and tea)
Based on the component, the smart plantation management systems market has been segmented as follows:
- Hardware
- Software
Based on the region, the smart plantation management systems market has been segmented as follows:
- North America
- Europe
- Asia Pacific
- RoW (South America, and the Middle East & Africa)
Recent Developments
- In June 2019, DTN (US) acquired PraxSoft (US), which would help the organization to provide more accurate data by using sensors and communication technology.
- In April 2019, DTN (US) partnered with Decisive Farming (Canada) so that farmers can get a comprehensive solution from both these organizations and make more accurate decisions for their crops.
- In December 2018, Netafim (Israel) formed a strategic alliance with Khang Thinh Irrigation Technology JSC (Vietnam) and ACOM (Vietnam) to provide knowledge and technology access to coffee farmers in Vietnam.
- In October 2018, Sustainable Development Technology (Canada) invested around 9.9 million in SemiosBio Technologies. This investment would help the company to develop machine-learning models to predict factors impacting the growth of fruits and other trees.
- In January 2018, WaterBit (US) launched a pressure sensor that would ensure that water is delivered in the right amount. It is an important component of the company's cloud-based solution.
Key questions addressed by the report
- Who are the major market players in the smart plantation management systems?
- What are the regional growth trends and the largest revenue-generating regions for the smart plantation management systems?
- What are the key regions and industries that are projected to witness significant growth in the smart plantation management systems?
- What are the major types of smart plantation management systems that are projected to gain maximum market revenue and share during the forecast period?
- On which major crops are these of smart plantation management systems majorly used, and which type of crops dominates the forecasted period?
Frequently Asked Questions (FAQ):
What is the report� coverage in terms of the types of smart plantation management systems currently used in the industry?
The report includes a broad classification of the different types of smart plantation management systems into the following segments,
- Irrigation Systems
- Plant Growth Monitoring Systems
- Harvesting Systems
What is the current market scenario for smart plantation management systems in the European region?
A comprehensive study has been carried out for the European region in terms of segmental analysis to identify growth prospects, the countries studies in the European region includes the following,
- Spain
- Italy
- France
- Germany
Can you provide pricing analysis of the systems?
Yes, we can include pricing analysis of the report
Can you provide further bifurcation of market size in Asia by additional countries?
Yes, we can offer the market size for key countries in Africa. We will share ToC with sample tables with you.
To speak to our analyst for a discussion on the above findings, click Speak to Analyst
 Exclusive indicates content/data unique to MarketsandMarkets and not available with any competitors.
TABLE OF CONTENTS
1 INTRODUCTION (Page No. - 17)
1.1 OBJECTIVES OF THE STUDY
1.2 MARKET DEFINITION
1.3 MARKET SEGMENTATION
1.3.1 REGIONS COVERED
1.3.2 PERIODIZATION CONSIDERED
1.4 CURRENCY CONSIDERED
1.5 UNITS CONSIDERED
1.6 STAKEHOLDERS
2 RESEARCH METHODOLOGY (Page No. - 21)
2.1 RESEARCH DATA
FIGURE 1 SMART PLANTATION MANAGEMENT SYSTEMS MARKET: RESEARCH DESIGN
2.2 MARKET SIZE ESTIMATION
2.2.1 APPROACH ONE (BASED ON TYPE, BY REGION)
2.2.2 APPROACH TWO (BASED ON GLOBAL MARKET)
2.3 DATA TRIANGULATION
FIGURE 2 DATA TRIANGULATION METHODOLOGY
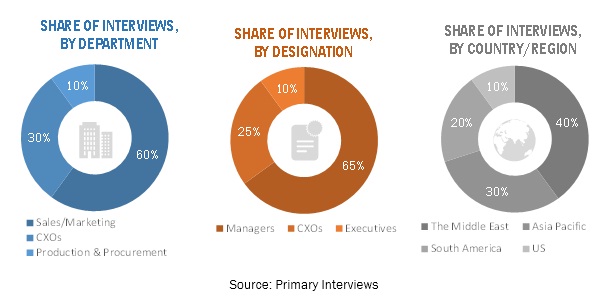
2.4 BREAKDOWN OF PRIMARIES
FIGURE 3 BREAKDOWN OF PRIMARY INTERVIEWS: BY DEPARTMENT, DESIGNATION, AND COUNTRY/REGION
2.5 ASSUMPTIONS FOR THE STUDY
2.6 LIMITATIONS OF THE STUDY
3 EXECUTIVE SUMMARY (Page No. - 28)
TABLE 1 SMART PLANTATION MANAGEMENT SYSTEMS MARKET SNAPSHOT, 2019 VS. 2025
FIGURE 4 SMART PLANTATION MANAGEMENT SYSTEMS MARKET SIZE, BY TYPE, 2019 VS. 2025 (USD MILLION)
FIGURE 5 SMART PLANTATION MANAGEMENT SYSTEMS MARKET SIZE, BY CROP, 2019 VS. 2025 (USD MILLION)
FIGURE 6 SMART PLANTATION MANAGEMENT SYSTEMS MARKET SIZE, BY COMPONENT, 2019 VS. 2025 (USD MILLION)
FIGURE 7 SMART PLANTATION MANAGEMENT SYSTEMS MARKET SHARE (VALUE), BY REGION, 2018
4 PREMIUM INSIGHTS (Page No. - 33)
4.1 ATTRACTIVE OPPORTUNITIES IN THE SMART PLANTATION MANAGEMENT SYSTEMS MARKET
FIGURE 8 INCREASED ADOPTION AND AVAILABILITY OF VARIOUS SMART TECHNOLOGIES FUELING THE MARKET GROWTH
4.2 SMART PLANTATION MANAGEMENT SYSTEMS MARKET: MAJOR REGIONAL SUBMARKETS
FIGURE 9 THE US IS PROJECTED TO GROW AT THE HIGHEST CAGR DURING THE FORECAST PERIOD
4.3 ASIA PACIFIC: SMART PLANTATION MANAGEMENT SYSTEMS MARKET, BY TYPE AND KEY COUNTRY
FIGURE 10 CHINA ACCOUNTED FOR THE LARGEST SHARE IN THE ASIA PACIFIC MARKET IN 2018
4.4 SMART PLANTATION MANAGEMENT SYSTEMS MARKET, BY TYPE AND REGION
FIGURE 11 ASIA PACIFIC IS PROJECTED TO DOMINATE THE MARKET FOR SMART PLANTATION MANAGEMENT SYSTEMS ACROSS ALL SEGMENTS
4.5 SMART PLANTATION MANAGEMENT SYSTEMS MARKET, BY CROP
FIGURE 12 THE FRUITS SEGMENT IS PROJECTED TO DOMINATE THE SMART PLANTATION MANAGEMENT SYSTEMS MARKET DURING THE FORECAST PERIOD
4.6 SMART PLANTATION MANAGEMENT SYSTEMS MARKET, BY COMPONENT
FIGURE 13 ASIA PACIFIC DOMINATED THE HARDWARE SEGMENT IN 2018
5 MARKET OVERVIEW (Page No. - 38)
5.1 INTRODUCTION
5.2 MARKET DYNAMICS
FIGURE 14 SMART PLANTATION MANAGEMENT SYSTEMS MARKET DYNAMICS
5.2.1 DRIVERS
5.2.1.1 Increase in the adoption of plantation intelligence (PI) and data mining by farmers
5.2.1.2 Reduction in the wastage of resources and manpower
5.2.2 RESTRAINTS
5.2.2.1 High capital investment in the deployment of smart plantation systems
5.2.3 OPPORTUNITIES
5.2.3.1 Growth in the adoption of smart plantation management systems in emerging regions
5.2.3.2 The advent of big data in agriculture farms
5.2.4 CHALLENGES
5.2.4.1 Data aggregation and lack of awareness associated with smart plantation management systems
5.3 VALUE CHAIN
FIGURE 15 SMART PLANTATION MANAGEMENT SYSTEMS MARKET: VALUE CHAIN
5.4 YC SHIFT FOR DEERE & COMPANY
6 SMART PLANTATION MANAGEMENT SYSTEMS MARKET, BY TYPE (Page No. - 44)
6.1 INTRODUCTION
FIGURE 16 SMART PLANTATION MANAGEMENT SYSTEMS MARKET SIZE, BY TYPE, 2019 VS. 2025 (VALUE)
TABLE 2 SMART PLANTATION MANAGEMENT SYSTEMS MARKET SIZE, BY TYPE, 2017�2025 (USD MILLION)
6.2 IRRIGATION SYSTEMS
6.2.1 DEPLOYMENT OF IRRIGATION SYSTEMS FOR A WIDE RANGE OF PLANTATION CROPS EXPECTED TO DRIVE THEIR DEMAND
TABLE 3 IRRIGATION SYSTEMS MARKET SIZE, BY REGION, 2017�2025 (USD MILLION)
6.3 PLANT GROWTH MONITORING SYSTEMS
6.3.1 SIGNIFICANT USAGE OF PLANT GROWTH MONITORING SYSTEMS IN FRUIT CROPS EXPECTED TO DRIVE THEIR MARKET GROWTH
TABLE 4 PLANT GROWTH MONITORING SYSTEMS MARKET SIZE, BY REGION, 2017�2025 (USD MILLION)
6.4 HARVESTING SYSTEMS
6.4.1 INCREASING FARM MECHANIZATION DRIVING THE MARKET FOR SMART HARVESTING SYSTEMS
TABLE 5 HARVESTING SYSTEMS MARKET SIZE, BY REGION, 2017�2025 (USD MILLION)
7 SMART PLANTATION MANAGEMENT SYSTEMS MARKET, BY CROP (Page No. - 49)
7.1 INTRODUCTION
TABLE 6 SMART PLANTATION MANAGEMENT SYSTEMS MARKET SIZE, BY CROP, 2017�2025 (USD MILLION)
TABLE 7 SMART PLANTATION MANAGEMENT SYSTEMS MARKET SIZE, BY CROP, 2017�2025 (UNITS)
7.2 COFFEE
7.2.1 INCREASING CONSUMPTION OF COFFEE IS EXPECTED TO DRIVE THE PRODUCTION OF COFFEE, IN TURN, DRIVING THE DEMAND FOR SMART PLANTATION MANAGEMENT SYSTEMS
TABLE 8 COFFEE: SMART PLANTATION MANAGEMENT SYSTEMS MARKET SIZE, BY REGION, 2017�2025 (USD MILLION)
TABLE 9 COFFEE: SMART PLANTATION MANAGEMENT SYSTEMS MARKET SIZE, BY REGION, 2017�2025 (UNITS)
7.3 OILSEEDS
7.3.1 LARGE-SCALE IRRIGATION REQUIREMENT OF OILSEEDS PLANTATION IS EXPECTED TO DRIVE THE MARKET FOR SMART PLANTATION MANAGEMENT SYSTEMS
TABLE 10 OILSEEDS: SMART PLANTATION MANAGEMENT SYSTEMS MARKET SIZE, BY REGION, 2017�2025 (USD MILLION)
TABLE 11 OILSEEDS: SMART PLANTATION MANAGEMENT SYSTEMS MARKET SIZE, BY REGION, 2017�2025 (UNITS)
7.4 SUGARCANE
7.4.1 DIFFICULTY IN ACCESSING AND MANAGING THE SUGARCANE CROP IS EXPECTED TO DRIVE THE USAGE OF SMART PLANTATION MANAGEMENT SYSTEMS
TABLE 12 SUGARCANE: SMART PLANTATION MANAGEMENT SYSTEMS MARKET SIZE, BY REGION, 2017�2025 (USD MILLION)
TABLE 13 SUGARCANE: SMART PLANTATION MANAGEMENT SYSTEMS MARKET SIZE, BY REGION, 2017�2025 (UNITS)
7.5 COTTON
7.5.1 INCREASING PRESSURE TO ADOPT BETTER PRACTICES IN COTTON FARMING DRIVES THE USAGE OF SMART PLANTATION MANAGEMENT SYSTEMS
TABLE 14 COTTON: SMART PLANTATION MANAGEMENT SYSTEMS MARKET SIZE, BY REGION, 2017�2025 (USD MILLION)
TABLE 15 COTTON: SMART PLANTATION MANAGEMENT SYSTEMS MARKET SIZE, BY REGION, 2017�2025 (UNITS)
7.6 FRUITS
7.6.1 TECHNOLOGICAL DEVELOPMENT & DEPLOYMENT FOR FRUITS TO DRIVE THE MARKET GROWTH
TABLE 16 FRUITS: SMART PLANTATION MANAGEMENT SYSTEMS MARKET SIZE, BY REGION, 2017�2025 (USD MILLION)
TABLE 17 FRUITS: SMART PLANTATION MANAGEMENT SYSTEMS MARKET SIZE, BY REGION, 2017�2025 (UNITS)
7.7 OTHERS
7.7.1 INCREASING PEST INFESTATION AND DISEASES IN CROPS TO DRIVE THE SMART PLANTATION MANAGEMENT SYSTEMS MARKET
TABLE 18 OTHERS: SMART PLANTATION MANAGEMENT SYSTEMS MARKET SIZE, BY REGION, 2017�2025 (USD MILLION)
TABLE 19 OTHERS: SMART PLANTATION MANAGEMENT SYSTEMS MARKET SIZE, BY REGION, 2017�2025 (UNITS)
8 SMART PLANTATION MANAGEMENT SYSTEMS MARKET, BY COMPONENT (Page No. - 59)
8.1 INTRODUCTION
FIGURE 18 SMART PLANTATION MANAGEMENT SYSTEMS MARKET SIZE, BY COMPONENT, 2019 VS. 2025 (VALUE)
TABLE 20 SMART PLANTATION MANAGEMENT SYSTEMS MARKET SIZE, BY COMPONENT, 2017�2025 (USD MILLION)
8.2 HARDWARE
8.2.1 ADVANCEMENT IN SOFTWARE SYSTEMS DRIVING THE GROWTH OF HARDWARE COMPONENTS
TABLE 21 SMART PLANTATION MANAGEMENT HARDWARE SYSTEMS MARKET SIZE, BY REGION, 2017�2025 (USD MILLION)
8.3 SOFTWARE
8.3.1 INCLINATION TOWARD THE ADOPTION OF EFFICIENT AGRICULTURAL PRACTICES
TABLE 22 SMART PLANTATION MANAGEMENT SOFTWARE SYSTEMS MARKET SIZE, BY REGION, 2017�2025 (USD MILLION)
9 SMART PLANTATION MANAGEMENT SYSTEMS MARKET, BY REGION (Page No. - 63)
9.1 INTRODUCTION
TABLE 23 SMART PLANTATION MANAGEMENT SYSTEMS MARKET SIZE, BY REGION, 2017�2025 (USD MILLION)
TABLE 24 SMART PLANTATION MANAGEMENT SYSTEMS MARKET SIZE, BY REGION, 2017�2025 (UNITS)
TABLE 25 SMART PLANTATION MANAGEMENT SYSTEMS MARKET SIZE, BY COUNTRY/REGION, 2017�2025 (USD MILLION)
TABLE 26 SMART PLANTATION MANAGEMENT SYSTEMS MARKET SIZE, BY COUNTRY/REGION, 2017�2025 (UNITS)
9.2 NORTH AMERICA
FIGURE 19 NORTH AMERICA: SMART PLANTATION MANAGEMENT SYSTEMS SNAPSHOT
TABLE 27 NORTH AMERICA: SMART PLANTATION MANAGEMENT SYSTEMS MARKET SIZE, BY COUNTRY, 2017�2025 (USD MILLION)
TABLE 28 NORTH AMERICA: SMART PLANTATION MANAGEMENT SYSTEMS MARKET SIZE, BY COUNTRY, 2017�2025 (UNITS)
TABLE 29 NORTH AMERICA: SMART PLANTATION MANAGEMENT SYSTEMS MARKET SIZE, BY TYPE, 2017�2025 (USD MILLION)
TABLE 30 NORTH AMERICA: SMART PLANTATION MANAGEMENT SYSTEMS MARKET SIZE, BY CROP, 2017�2025 (USD MILLION)
TABLE 31 NORTH AMERICA: SMART PLANTATION MANAGEMENT SYSTEMS MARKET SIZE, BY CROP, 2017�2025 (UNITS)
TABLE 32 NORTH AMERICA: SMART PLANTATION MANAGEMENT SYSTEMS MARKET SIZE, BY COMPONENT, 2017�2025 (USD MILLION)
TABLE 33 NORTH AMERICA: IRRIGATION SYSTEMS MARKET SIZE, BY COUNTRY, 2017�2025 (USD MILLION)
TABLE 34 NORTH AMERICA: PLANT GROWTH MONITORING SYSTEMS MARKET SIZE, BY COUNTRY, 2017�2025 (USD MILLION)
TABLE 35 NORTH AMERICA: HARVESTING SYSTEMS MARKET SIZE, BY COUNTRY, 2017�2025 (USD MILLION)
TABLE 36 NORTH AMERICA: HARDWARE MARKET SIZE, BY COUNTRY, 2017�2025 (USD MILLION)
TABLE 37 NORTH AMERICA: SOFTWARE MARKET SIZE, BY COUNTRY, 2017�2025 (USD MILLION)
9.2.1 US
9.2.1.1 Increased adoption of automated technologies to drive market growth
TABLE 38 US: SMART PLANTATION MANAGEMENT SYSTEMS MARKET SIZE, BY TYPE, 2017�2025 (USD MILLION)
TABLE 39 US: SMART PLANTATION MANAGEMENT SYSTEMS MARKET SIZE, BY COMPONENT, 2017�2025 (USD MILLION)
9.2.2 CANADA
9.2.2.1 Growth in controlled plantation spaces to propel market growth
TABLE 40 CANADA: SMART PLANTATION MANAGEMENT SYSTEMS MARKET SIZE, BY TYPE, 2017�2025 (USD MILLION)
TABLE 41 CANADA: SMART PLANTATION MANAGEMENT SYSTEMS MARKET SIZE, BY COMPONENT, 2017�2025 (USD MILLION)
9.2.3 MEXICO
9.2.3.1 With a wide variety of plantation crops, Mexico presents huge growth opportunities for smart plantation management systems
TABLE 42 MEXICO: SMART PLANTATION MANAGEMENT SYSTEMS MARKET SIZE, BY TYPE, 2017�2025 (USD MILLION)
TABLE 43 MEXICO: SMART PLANTATION MANAGEMENT SYSTEMS MARKET SIZE, BY COMPONENT, 2017�2025 (USD MILLION)
9.3 EUROPE
TABLE 44 EUROPE: SMART PLANTATION MANAGEMENT SYSTEMS MARKET SIZE, BY COUNTRY, 2017�2025 (USD MILLION)
TABLE 45 EUROPE: SMART PLANTATION MANAGEMENT SYSTEMS MARKET SIZE, BY COUNTRY, 2017�2025 (UNITS)
TABLE 46 EUROPE: SMART PLANTATION MANAGEMENT SYSTEMS MARKET SIZE, BY TYPE, 2017�2025 (USD MILLION)
TABLE 47 EUROPE: SMART PLANTATION MANAGEMENT SYSTEMS MARKET SIZE, BY CROP, 2017�2025 (USD MILLION)
TABLE 48 EUROPE: SMART PLANTATION MANAGEMENT SYSTEMS MARKET SIZE, BY CROP, 2017�2025 (UNITS)
TABLE 49 EUROPE: SMART PLANTATION MANAGEMENT SYSTEMS MARKET SIZE, BY COMPONENT, 2017�2025 (USD MILLION)
TABLE 50 EUROPE: IRRIGATION SYSTEMS MARKET SIZE, BY COUNTRY, 2017�2025 (USD MILLION)
TABLE 51 EUROPE: PLANT GROWTH MONITORING SYSTEMS MARKET SIZE, BY COUNTRY, 2017�2025 (USD MILLION)
TABLE 52 EUROPE: HARVESTING SYSTEMS MARKET SIZE, BY COUNTRY/REGION, 2017�2025 (USD MILLION)
TABLE 53 EUROPE: HARDWARE COMPONENTS MARKET SIZE, BY COUNTRY/REGION, 2017�2025 (USD MILLION)
TABLE 54 EUROPE: SOFTWARE COMPONENTS MARKET SIZE, BY COUNTRY, 2017�2025 (USD MILLION)
9.3.1 SPAIN
9.3.1.1 Water shortage due to climate change propelling the demand for smart plantation management systems in Spain
TABLE 55 SPAIN: SMART PLANTATION MANAGEMENT SYSTEMS MARKET SIZE, BY TYPE, 2017�2025 (USD MILLION)
TABLE 56 SPAIN: SMART PLANTATION MANAGEMENT SYSTEMS MARKET SIZE, BY COMPONENT, 2017�2025 (USD MILLION)
9.3.2 ITALY
9.3.2.1 Rising awareness and demand for better-quality fruits expected to boost the usage of smart plantation management systems
TABLE 57 ITALY: SMART PLANTATION MANAGEMENT SYSTEMS MARKET SIZE, BY TYPE, 2017�2025 (USD MILLION)
TABLE 58 ITALY: SMART PLANTATION MANAGEMENT SYSTEMS MARKET SIZE, BY COMPONENT, 2017�2025 (USD MILLION)
9.3.3 FRANCE
9.3.3.1 Demand for quality output expected to drive the demand for smart plantation management systems
TABLE 59 FRANCE: SMART PLANTATION MANAGEMENT SYSTEMS MARKET SIZE, BY TYPE, 2017�2025 (USD MILLION)
TABLE 60 FRANCE: SMART PLANTATION MANAGEMENT SYSTEMS MARKET SIZE, BY COMPONENT, 2017�2025 (USD MILLION)
9.3.4 GERMANY
9.3.4.1 Consumer focus on sustainable agriculture
TABLE 61 GERMANY: SMART PLANTATION MANAGEMENT SYSTEMS MARKET SIZE, BY TYPE, 2017�2025 (USD MILLION)
TABLE 62 GERMANY: SMART PLANTATION MANAGEMENT SYSTEMS MARKET SIZE, BY COMPONENT, 2017�2025 (USD MILLION)
9.3.5 REST OF EUROPE
9.3.5.1 Demand for quality output expected to increase the adoption of smart plantation management systems
TABLE 63 REST OF EUROPE: SMART PLANTATION MANAGEMENT SYSTEMS MARKET SIZE, BY TYPE, 2017�2025 (USD MILLION)
TABLE 64 REST OF EUROPE: SMART PLANTATION MANAGEMENT SYSTEMS MARKET SIZE, BY COMPONENT, 2017�2025 (USD MILLION)
9.4 ASIA PACIFIC
FIGURE 20 ASIA PACIFIC: SMART PLANTATION MANAGEMENT SYSTEMS MARKET SNAPSHOT
TABLE 65 ASIA PACIFIC: SMART PLANTATION MANAGEMENT SYSTEMS MARKET SIZE, BY COUNTRY/REGION, 2017�2025 (USD MILLION)
TABLE 66 ASIA PACIFIC: SMART PLANTATION MANAGEMENT SYSTEMS MARKET SIZE, BY COUNTRY/REGION, 2017�2025 (UNITS)
TABLE 67 ASIA PACIFIC: SMART PLANTATION MANAGEMENT SYSTEMS MARKET SIZE, BY TYPE, 2017�2025 (USD MILLION)
TABLE 68 ASIA PACIFIC: SMART PLANTATION MANAGEMENT SYSTEMS MARKET SIZE, BY CROP, 2017�2025 (USD MILLION)
TABLE 69 ASIA PACIFIC: SMART PLANTATION MANAGEMENT SYSTEMS MARKET SIZE, BY CROP, 2017�2025 (UNITS)
TABLE 70 ASIA PACIFIC: SMART PLANTATION MANAGEMENT SYSTEMS MARKET SIZE, BY COMPONENT, 2017�2025 (USD MILLION)
TABLE 71 ASIA PACIFIC: IRRIGATION SYSTEMS MARKET SIZE, BY COUNTRY/REGION, 2017�2025 (USD MILLION)
TABLE 72 ASIA PACIFIC: PLANT GROWTH MONITORING SYSTEMS MARKET SIZE, BY COUNTRY/REGION, 2017�2025 (USD MILLION)
TABLE 73 ASIA PACIFIC: HARVESTING SYSTEMS MARKET SIZE, BY COUNTRY/REGION, 2017�2025 (USD MILLION)
TABLE 74 ASIA PACIFIC: HARDWARE COMPONENTS MARKET SIZE, BY COUNTRY/REGION, 2017�2025 (USD MILLION)
TABLE 75 ASIA PACIFIC: SOFTWARE COMPONENTS MARKET SIZE, BY COUNTRY/REGION, 2017�2025 (USD MILLION)
9.4.1 CHINA
9.4.1.1 Adoption of smart technologies to conserve natural resources
TABLE 76 CHINA: SMART PLANTATION MANAGEMENT SYSTEMS MARKET SIZE, BY TYPE, 2017�2025 (USD MILLION)
TABLE 77 CHINA: SMART PLANTATION MANAGEMENT SYSTEMS MARKET SIZE, BY COMPONENT, 2017�2025 (USD MILLION)
9.4.2 AUSTRALIA & NEW ZEALAND
9.4.2.1 Government support to fuel the demand for smart plantation management systems
TABLE 78 AUSTRALIA & NEW ZEALAND: SMART PLANTATION MANAGEMENT SYSTEMS MARKET SIZE, BY TYPE, 2017�2025 (USD MILLION)
TABLE 79 AUSTRALIA & NEW ZEALAND: SMART PLANTATION MANAGEMENT SYSTEMS MARKET SIZE, BY COMPONENT, 2017�2025 (USD MILLION)
9.4.3 JAPAN
9.4.3.1 Acute shortage of labor is expected to drive the demand for smart plantation management systems
TABLE 80 JAPAN: SMART PLANTATION MANAGEMENT SYSTEMS MARKET SIZE, BY TYPE, 2017�2025 (USD MILLION)
TABLE 81 JAPAN: SMART PLANTATION MANAGEMENT SYSTEMS MARKET SIZE, BY COMPONENT, 2017�2025 (USD MILLION)
9.4.4 INDIA
9.4.4.1 Advancement in technology and increasing concerns for sustainability
TABLE 82 INDIA: SMART PLANTATION MANAGEMENT SYSTEMS MARKET SIZE, BY TYPE, 2017�2025 (USD MILLION)
TABLE 83 INDIA: SMART PLANTATION MANAGEMENT SYSTEMS MARKET SIZE, BY COMPONENT, 2017�2025 (USD MILLION)
9.4.5 REST OF ASIA PACIFIC
9.4.5.1 Extensive research and development projects
TABLE 84 REST OF ASIA PACIFIC: SMART PLANTATION MANAGEMENT SYSTEMS MARKET SIZE, BY TYPE, 2017�2025 (USD MILLION)
TABLE 85 REST OF ASIA PACIFIC: SMART PLANTATION MANAGEMENT SYSTEMS MARKET SIZE, BY COMPONENT, 2017�2025 (USD MILLION)
9.5 REST OF THE WORLD (ROW)
TABLE 86 ROW: SMART PLANTATION MANAGEMENT SYSTEMS MARKET SIZE, BY REGION, 2017�2025 (USD MILLION)
TABLE 87 ROW: SMART PLANTATION MANAGEMENT SYSTEMS MARKET SIZE, BY REGION, 2017�2025 (UNITS)
TABLE 88 ROW: SMART PLANTATION MANAGEMENT SYSTEMS MARKET SIZE, BY TYPE, 2017�2025 (USD MILLION)
TABLE 89 ROW: SMART PLANTATION MANAGEMENT SYSTEMS MARKET SIZE, BY CROP, 2017�2025 (USD MILLION)
TABLE 90 ROW: SMART PLANTATION MANAGEMENT SYSTEMS MARKET SIZE, BY CROP, 2017�2025 (UNITS)
TABLE 91 ROW: SMART PLANTATION MANAGEMENT SYSTEMS MARKET SIZE, BY COMPONENT, 2017�2025 (USD MILLION)
TABLE 92 ROW: IRRIGATION SYSTEMS MARKET SIZE, BY REGION, 2017�2025 (USD MILLION)
TABLE 93 ROW: PLANT GROWTH MONITORING SYSTEMS MARKET SIZE, BY REGION, 2017�2025 (USD MILLION)
TABLE 94 ROW: HARVESTING SYSTEMS MARKET SIZE, BY REGION, 2017�2025 (USD MILLION)
TABLE 95 ROW: HARDWARE COMPONENTS MARKET SIZE, BY REGION, 2017�2025 (USD MILLION)
TABLE 96 ROW: SOFTWARE COMPONENTS MARKET SIZE, BY REGION, 2017�2025 (USD MILLION)
9.5.1 SOUTH AMERICA
TABLE 97 SOUTH AMERICA: SMART PLANTATION MANAGEMENT SYSTEMS MARKET SIZE, BY TYPE, 2017�2025 (USD MILLION)
TABLE 98 SOUTH AMERICA: SMART PLANTATION MANAGEMENT SYSTEMS MARKET SIZE, BY COMPONENT, 2017�2025 (USD MILLION)
9.5.2 MIDDLE EAST & AFRICA
TABLE 99 MIDDLE EAST & AFRICA: SMART PLANTATION MANAGEMENT SYSTEMS MARKET SIZE, BY TYPE, 2017�2025 (USD MILLION)
TABLE 100 MIDDLE EAST & AFRICA: SMART PLANTATION MANAGEMENT SYSTEMS MARKET SIZE, BY COMPONENT, 2017�2025 (USD MILLION)
10 COMPETITIVE LANDSCAPE (Page No. - 101)
10.1 INTRODUCTION
10.2 COMPETITIVE LEADERSHIP MAPPING
10.2.1 VISIONARY LEADERS
10.2.2 DYNAMIC DIFFERENTIATORS
10.2.3 INNOVATORS
10.2.4 EMERGING COMPANIES
FIGURE 21 SMART PLANTATION MANAGEMENT SYSTEMS MARKET: COMPETITIVE LEADERSHIP MAPPING, 2018
10.3 MARKET SHARE ANALYSIS
FIGURE 22 MARKET SHARE OF KEY PLAYERS IN THE SMART PLANTATION MANAGEMENT SYSTEMS MARKET
10.4 COMPETITIVE SCENARIO
10.4.1 NEW PRODUCT/TECHNOLOGY LAUNCHES
TABLE 101 NEW PRODUCT/TECHNOLOGY LAUNCHES, 2014�2019
10.4.2 ACQUISITIONS
TABLE 102 ACQUISITIONS, 2014�2019
10.4.3 AGREEMENTS, COLLABORATIONS & PARTNERSHIPS
TABLE 103 AGREEMENTS, COLLABORATIONS & PARTNERSHIPS, 2014�2019
10.4.4 INVESTMENTS
TABLE 104 INVESTMENTS, 2014�2019
11 COMPANY PROFILES (Page No. - 107)
(Business overview, Products offered, Recent Developments, SWOT analysis, MNM view)*
11.1 ROBERT BOSCH
FIGURE 23 ROBERT BOSCH: COMPANY SNAPSHOT
FIGURE 24 ROBERT BOSCH: SWOT ANALYSIS
11.2 DEERE & COMPANY
FIGURE 25 DEERE & COMPANY: COMPANY SNAPSHOT
FIGURE 26 DEERE & COMPANY: SWOT ANALYSIS
11.3 NETAFIM
FIGURE 27 NETAFIM: SWOT ANALYSIS
11.4 SYNELIXIS SOLUTIONS
FIGURE 28 SYNELIXIS SOLUTIONS: COMPANY SNAPSHOT
11.5 DTN
11.6 AGROWEBLAB CO., LTD
11.7 TEVATRONICS
11.8 SEMIOSBIO TECHNOLOGIES
11.9 WATERBIT
11.10 PHYTECH
11.11 RIVULIS
11.12 JAIN IRRIGATION SYSTEMS
FIGURE 29 JAIN IRRIGATION SYSTEMS: COMPANY SNAPSHOT
FIGURE 30 JAIN IRRIGATION SYSTEMS: SWOT ANALYSIS
11.13 ABACO GROUP
11.14 HIDROSOPH
11.15 AQUASPY
11.16 AG LEADER TECHNOLOGY
11.17 TEEJET TECHNOLOGIES
11.18 CROP METRICS
11.19 TOPCON GROUP
FIGURE 31 TOPCON GROUP: COMPANY SNAPSHOT
11.20 RAVEN INDUSTRIES
FIGURE 32 RAVEN INDUSTRIES: COMPANY SNAPSHOT
11.21 AGJUNCTION
FIGURE 33 AGJUNCTION TECHNOLOGY: COMPANY SNAPSHOT
*Details on Business overview, Products offered, Recent Developments, SWOT analysis, MNM view might not be captured in case of unlisted companies.
12 APPENDIX (Page No. - 140)
12.1 DISCUSSION GUIDE
12.2 KNOWLEDGE STORE: MARKETSANDMARKETS� SUBSCRIPTION PORTAL
12.3 AVAILABLE CUSTOMIZATIONS
12.4 RELATED REPORTS
12.5 AUTHOR DETAILS
The study involved four major steps in estimating the size of the smart plantation management systems market. Exhaustive secondary research was done to collect information on the market as well as the parent market. The next step was to validate these findings, assumptions, and sizing with industry experts across the value chain through primary research. Both the top-down and bottom-up approaches were employed to estimate the complete market size. After that, market breakdown and data triangulation were used to estimate the market size of segments and subsegments.
Secondary Research
In the secondary research process, various sources were referred to, to identify and collect information for this study. These secondary sources included reports from the Food and Agriculture Organization (FAO), Food and Drug Administration (FDA), International Fruit Tree Association (IFTA), European Irrigation Association (EIA), African Agricultural Technology Foundation (AATF), and Indian Agricultural Association (IAA). The secondary sources also included annual reports, press releases, investor presentations of companies, white papers, certified publications, articles by recognized authors and regulatory bodies, trade directories, and databases.
Secondary research was mainly conducted to obtain key information about the industry�s supply chain, the total pool of key players, market classification & segmentation according to industry trends to the bottom-most level, and geographical markets. It was also used to obtain information about the key developments from a market-oriented perspective.
Primary Research
The overall smart plantation management systems market comprises several stakeholders in the supply chain, which include farmers, smart agricultural equipment manufacturers, and distributors. Various primary sources from both the supply and demand sides of the market were interviewed to obtain qualitative and quantitative information. The primary interviewees from the demand side include key opinion leaders; farmers; executives; vice presidents; and CEOs of coffee, fruits, and tea processing industries. The primary sources from the supply side include research institutions involved in R&D, key opinion leaders, and smart agricultural equipment suppliers and manufacturers.
To know about the assumptions considered for the study, download the pdf brochure
Market Size Estimation
Both the top-down and bottom-up approaches were used to estimate and validate the total size of the smart plantation management systems market. These approaches were also used extensively to estimate the size of various subsegments in the market. The research methodology used to estimate the market size includes the following details:
- The key players were identified through extensive secondary research.
- The smart plantation management systems market size, in terms of value, was determined through primary and secondary research.
- All percentage share splits and breakdowns were determined using secondary sources and verified through primary sources.
- All the possible parameters that affect the market covered in this research study were accounted for, viewed in extensive detail, verified through primary research, and analyzed to obtain the final quantitative and qualitative data.
Data Triangulation
After arriving at the overall market size from the estimation process explained above, the total market was split into several segments and subsegments. The data triangulation and market breakdown procedures were employed to estimate the global smart plantation management systems market and arrive at the exact statistics for all segments and subsegments, wherever applicable. The data was triangulated by studying various factors and trends from the demand and supply sides. Along with this, the market size was validated using both the top-down and bottom-up approaches.
Report Objectives
- Determining and projecting the size of the smart plantation management systems market, with respect to type, crop, component, and regional markets, over six years, ranging from 2019 to 2025
- Identifying attractive opportunities in the market by determining the largest and fastest-growing segments across regions
- Providing detailed information about the key factors influencing the growth of the market (drivers, restraints, opportunities, and industry-specific challenges)
- Analyzing the micro-markets, with respect to individual growth trends, future prospects, and their contribution to the total market
- Identifying and profiling the key market players in the smart plantation management systems market
- Providing a comparative analysis of the market leaders based on the following parameters:
- Product offerings
- Business strategies
- Strengths and weaknesses
- Key financials
- Understanding the competitive landscape and identifying the major growth strategies adopted by players across the key regions
- Analyzing the value chain, products, and regulatory frameworks across key regions and their impact on the prominent market players
- Providing insights into key product innovations and investments in the smart plantation management systems market
Geographical Analysis
- Further breakdown of Asia Pacific smart plantation management systems market, by key country
Company Information
- Analyses and profiling of additional market players (up to five)


Growth opportunities and latent adjacency in Smart Plantation Management Systems Market