Software Defined Radio (SDR) Market for Communication by Component (FPGA, DSP, GPP, PSOC, Amplifier, and Software), Application (Military, Telecommunication, Short Range, Positioning, Transportation, and Public Safety), & Geography - Analysis & Forecast to 2014 - 2020


The increasing need for secure and reliable communication devices for the civilian and military applications has increased the demand for software defined radio market for communication. Software defined radio is basically a radio communication technology in which all or some of the physical layer functions are software defined. The impact of the software defined radio technology will affect the network operators, end users, OEM suppliers, handset manufacturers, and the electronic component manufacturers. Many projects have been started for the development of software defined radio; such as the US Joint Tactical Radio System (JTRS) program, European Secure Software Defined Radio (ESSOR), and Speak Easy radio program, among others. Software defined radio contributes significantly towards the development of better communication devices, thus, providing a useful prospective for the various sectors such as defense, telecommunication, and transportation.
This report is based on an in-depth research study on the software defined radio market for communication across the military, homeland security, and commercial applications and focuses on the various types of emerging applications that are available commercially, as well as the new market demand for the SDR technology by 2020. The report provides the profiles of the major active companies in the software defined radio market. The recent developments, adoption of technologies, and the agreements to strengthen the growth of this market are also briefly discussed. The report also provides the competitive landscapes of the key players, which indicates their growth strategies in terms of the software defined radio market for communication.
The report also presents the market dynamics such as the drivers, restraints, and opportunities. Apart from the in-depth view on market segmentation on the basis of components, applications, and geographies, the report also includes the critical market data and qualitative information for each type; along with the qualitative analysis, such as the Porter�s five force analysis, value chain analysis, supply chain, and market crackdown analysis. The software defined radio market for communication is expected to reach $27.29 billion by 2020 at a CAGR of 12.5% from 2014 to 2020.The market covered under this report has been segmented as follows:
Market by component:
The software defined radio market for communication segmentation by component includes field programmable gate array, digital signal processor, general purpose processor, amplifier, software, and other components such as antenna, RF front end, and converter.
Market by application:
The software defined radio market for communication, by application, is segmented on the basis of military applications, which is further sub-segmented into the land, airborne, and naval type. The other major applications that are covered in the report are public safety/civilian government, telecommunication infrastructure, and short range communication equipment. The positioning applications include global positioning system, GLONASS, and other positioning systems such as Galileo and BeiDou. The transportation application consists of intelligent transport systems and automotive wireless electronics. The remaining applications are cognitive radios and cellular phones, which are also expected to act as a good prospective for the software defined radio in near future.
Market by geography:
The software defined radio market for communication, by geography, is divided into four major segments that include Americas, Europe, Asia-Pacific, and the Rest of the World (ROW); and regional analysis is done further on the basis of countries.
Major players in this market include: Rockwell Collins Inc. (U.S.), ITT Corporation (U.S.), BAE Systems Plc. (U.K.), Northrop Grumman Corporation (U.S.), Harris Corporation (U.S.), Thales Defense & Security Inc. (U.S.), Flex Radio Systems Inc. (U.S.), Datasoft Corporation (U.S.), L-3 Communication Holdings Inc. (U.S.), and Raytheon Co. (U.S.).
software defined radio market for communication is an evolving technology that can be deployed in cellular base stations, battlefield radios, and in homeland security systems. It offers the flexibility to change the modulation schemes, filters, and the error correction algorithms by simply making changes in the software performing on the processor. For the rapidly evolving wireless standards such as 2.5G, 3G, and 4G, there is a need to support the modulation and air-interface formats. The software defined radio empowers such functions in the wireless devices, by utilizing reconfigurable hardware platforms through the multiple standards.
The software defined radio technology has been able to overcome the challenges imposed by the incompatible communication systems by updating the radio systems with new protocols, functions, and standards. This is because of its ability to use software to control the operating parameters of the radio. It has the potential to enable new technologies in the system without doing the replacement of the system. This has been possible due to the advancements in digital electronics. The growing demand for effective communication systems is a prominent factor that is endorsing the growth of this market. The software defined radio market for communication serves a vast range of industry verticals ranging from very small consumer electronic devices to very large military devices and telecommunication infrastructure equipment.
Software Defined Radio Communication Market Size, by Value ($Billion), 2013-2020
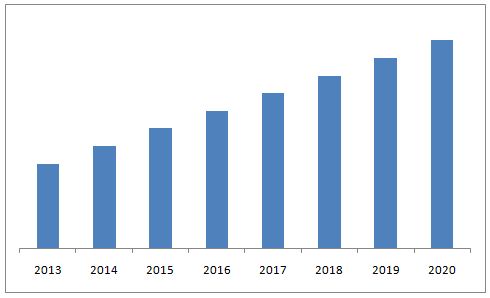
Source: MarketsandMarkets Analysis
The market size of the software defined radio communication is expected to grow at a CAGR of 12.5% from 2014 to 2020. This report focuses on detailed segmentations of the market, combined with qualitative and quantitative analysis of each and every aspect of the classification on the basis of components, applications, and geographies. All the numbers, at every level of detail, are forecasted till 2020, to give a glimpse of the potential market size in terms of value in this market.
Major players in software defined radio market for communication includes Rockwell Collins Inc. (U.S.), ITT Corporation (U.S.),BAE Systems Plc. (U.K.), Northrop Grumman Corporation (U.S.), Harris Corporation (U.S.), Thales Defense & Security Inc. (U.S.), Flex Radio Systems Inc. (U.S.), Datasoft Corporation (U.S.), L-3 Communication Holdings Inc. (U.S.), and Raytheon Co. (U.S.), among others.
 Exclusive indicates content/data unique to MarketsandMarkets and not available with any competitors.
Table of Contents
1 Introduction (Page No. - 16)
1.1 Objectives of The Study
1.2 Markets Covered
1.3 Stakeholders
1.4 Market Scope
2 Research Methodology (Page No. - 20)
2.1 Market Size Estimation
2.2 Market Crackdown And Data Trangulation
2.3 Market Share Estimation
2.3.1 Key Points Taken From Secondary Sources
2.3.2 Key Points Taken From Primary Sources
2.3.2.1 Key Industry Insights
2.3.3 Assumptions
3 Executive Summary (Page No. - 26)
4 Premium Insights (Page No. - 30)
4.1 Attractive Market Opportunities in The SDR Market
4.2 SDR Market � Top Three Application Segments
4.3 SDR Market in The Americas Region
4.4 Americas Commands Over One-Third of The Overall SDR Market
4.5 SDR Market: By Application
4.6 SDR Market: Asian Vs American Countries
4.7 Life Cycle Analysis
5 Market Overview (Page No. - 36)
5.1 Introduction
5.2 Evolution
5.3 Market Segmentation
5.3.1 SDR Market, By Component
5.3.2 SDR Market, By Application
5.3.3 SDR Market, By Geography
5.4 Market Dynamics
5.4.1 Drivers
5.4.1.1 Network Interoperability
5.4.1.2 Spectrum Reuse
5.4.1.3 Compatibility of Devices With Future Standards
5.4.1.4 Ubiquitous Connectivity
5.4.1.5 Reduced Cost of End Products And Services
5.4.1.6 Improved Time To Market
5.4.2 Restraints
5.4.2.1 Higher Initial Cost
5.4.2.2 Security Concerns
5.4.2.3 Integration Problem
5.4.3 Opportunities
5.4.3.1 Increasing Demand in Public Safety And Homeland Security
5.4.3.2 Growing Adoption in Commercial Applications
5.4.3.3 New Opportunities in The Form of Derived Technologies Like Cognitive Radio
5.4.4 Challenges
5.4.4.1 Operator Circumspection
5.4.4.2 Ever Changing Communication Standards
5.4.4.3 Regulatory issues
5.4.5 Burning issue
5.4.5.1 Requirement of Flexible Network
6 Industry Trends (Page No. - 54)
6.1 Introduction
6.2 SDR Industry Life Cycle
6.3 Value Chain Analysis
6.3.1 Key Influencers
6.4 Supply Chain Analysis
6.5 Industry Trends
6.6 Porter�s Five Forces Analysis
6.6.1 Threat From New Entrants
6.6.2 Threats From Substitutes
6.6.3 Bargaining Power of Suppliers
6.6.4 Bargaining Power of The Buyers
6.6.5 Degree of Competition
7 SDR Market, By Component (Page No. - 68)
7.1 Introduction
7.2 Field Programmable Gate Array
7.3 Digital Signal Processor
7.4 General Purpose Processor
7.5 Programmable System On Chip
7.6 Amplifier
7.7 Software
7.7.1 Common Object Request Broker Architecture
7.7.2 Software Communications Architecture
7.7.2.1 Operational Environment
7.7.2.2 Waveform
7.7.3 Real Time Operating Systems
7.7.4 Development Tools
7.7.4.1 Model Driven Engineering
7.7.4.2 Software Development And Testing Tools
7.7.4.3 Compliance Check Tools
7.8 Others
7.8.1 Converter
7.8.1.1 D/A Converter
7.8.1.2 A/D Converter
7.8.2 Antennas
7.8.3 Rf Front End
8 SDR Market, By Application (Page No. - 88)
8.1 Introduction
8.2 Military
8.2.1 Land
8.2.1.1 Hand-Held
8.2.1.2 Man-Pack
8.2.1.3 Vehicle Mounted
8.2.2 Airborne
8.2.3 Naval
8.2.3.1 Ship Based
8.2.3.2 Shore Based
8.3 Telecommunication Infrastructure
8.4 Short Range Communication
8.4.1 Wi-Fi
8.4.2 Bluetooth
8.4.3 Rfid System
8.4.4 Others
8.5 Positioning
8.5.1 Global Positioning System
8.5.2 Glonass
8.5.3 Others
8.6 Transportation
8.6.1 Intelligent Transportation System
8.6.2 Automotive Wireless Electronic
8.7 Public Safety/Civilian Government
8.7.1 Emergency Management Center
8.7.2 Paramilitary Force
8.7.3 Intelligence Agency
8.7.4 Others
8.8 Others
9 Geographic Analysis (Page No. - 122)
9.1 Introduction
9.2 Americas
9.2.1 North America
9.2.1.1 U.S.
9.2.1.2 Canada
9.2.1.3 Rest of North America
9.2.2 South America
9.2.2.1 Brazil
9.2.2.2 Rest of South America
9.3 Europe
9.3.1 Germany
9.3.2 France
9.3.3 Italy
9.3.4 U.K.
9.3.5 Rest of Europe
9.4 Asia-Pacific
9.4.1 Japan
9.4.2 Korea
9.4.3 China
9.4.4 India
9.4.5 Rest of Apac
9.5 Row
9.5.1 Saudi Arabia
9.5.2 Uae
9.5.3 israel
9.5.4 Turkey
9.5.5 Russia
9.5.6 Rest of Row
10 Competitive Landscape (Page No. - 156)
10.1 Overview
10.2 Market Ranking
10.3 Competitive Situations And Trends
10.3.1 Contracts, Partnerships, And Agreements
10.3.2 New Product Launches
10.3.3 Mergers And Acquisitions
10.3.4 Expansions
10.3.5 Other Developments
11 Company Profiles (Overview, Products And Services, Financials, Strategy & Development)* (Page No. - 164)
11.1 Introduction
11.2 BAE Systems Plc
11.3 Datasoft Corporation
11.4 Flexradio Systems Inc.
11.5 Harris Corporation
11.6 Itt Corporation
11.7 L3 Communication Holdings Inc.
11.8 Northrop Grumman Corporation
11.9 Raytheon Co.
11.10 Rockwell Collins Inc.
11.11 Thales Defense & Security Inc.
*Details On Overview, Products And Services, Financials, Strategy & Development Might Not Be Captured in Case of Unlisted Companies.
12 Appendix (Page No. - 191)
12.1 Insights of Industry Experts
12.2 Discussion Guide
12.3 Introducing Rt: Real Time Market Intelligence
12.4 Available Customizations
12.5 Related Reports
List of Tables (85 Tables)
Table 1 Variations in The Definition of Radio Based On The Capability And Flexibility
Table 2 Interoperability To Avoid Disaster is Driving The Growth of SDR Market
Table 3 Security Concerns Are Restraining The Growth of The SDR Market
Table 4 Commercial Applications Are Generating New Opportunities For The SDR Market
Table 5 Porter�s Five Forces Analysis
Table 6 SDR Market Size, By Component ($Billion), 2013-2020
Table 7 Field Programmable Gate Array Market Size, By Geography ($Billion), 2013-2020
Table 8 Digital Signal Processor Market Size, By Geography ($Billion), 2013-2020
Table 9 General Purpose Processor Market Size, By Geography ($Billion), 2013-2020
Table 10 Programmable System On Chip Market Size, By Geography ($Billion), 2013-2020
Table 11 Amplifier Market Size, By Geography ($Billion), 2013-2020
Table 12 Software Market Size, By Geography ($Billion), 2013-2020
Table 13 Other Components Market Size, By Geography ($Billion), 2013-2020
Table 14 SDR Market Size, By Application ($Billion), 2013-2020
Table 15 SDR Market Size, By Military Application ($Billion), 2013-2020
Table 16 Military Application Market Size, By Geography ($Billion), 2013-2020
Table 17 Land Based Military Application Market Size, By Geography ($Million), 2013-2020
Table 18 Airborne Based Military Application Market Size, By Geography ($Million), 2013-2020
Table 19 Naval Based Military Application Market Size, By Geography ($Million), 2013-2020
Table 20 Telecommunication Infrastructure Application Market Size, By Geography ($Billion), 2013-2020
Table 21 SDR Market Size, By Short Range Communication Application ($Billion), 2013-2020
Table 22 Short Range Communication Application Market Size, By Geography ($Billion), 2013-2020
Table 23 Wi-Fi Application Market Size, By Geography ($Million), 2013-2020
Table 24 Bluetooth Application Market Size, By Geography ($Million), 2013-2020
Table 25 Rfid System Application Market Size, By Geography ($Million), 2013-2020
Table 26 Other Short Range Communication Applications Market Size, By Geography ($Million), 2013-2020
Table 27 SDR Market Size, By Positioning Application ($Billion), 2013-2020
Table 28 Positioning Application Market Size, By Geography ($Billion), 2013-2020
Table 29 Global Positioning System Application Market Size, By Geography ($Million), 2013-2020
Table 30 Glonass Application Market Size, By Geography ($Million), 2013-2020
Table 31 Other Positioning Applications Market Size, By Geography ($Million), 2013-2020
Table 32 SDR Market Size, By Transportation Application ($Billion), 2013-2020
Table 33 Transportation Application Market Size, By Geography ($Billion), 2013-2020
Table 34 Intelligent Transport Systems Application Market Size, By Geography ($Million), 2013-2020
Table 35 Automotive Wireless Electronics Application Market Size, By Geography ($Million), 2013-2020
Table 36 SDR Market Size, By Public Safety/Civilian Government Application ($Billion), 2013-2020
Table 37 Public Safety/Civilian Government Application Market Size, By Geography ($Billion), 2013-2020
Table 38 Emergency Management Centers Application Market Size, By Geography ($Million), 2013-2020
Table 39 Paramilitary Forces Application Market Size, By Geography ($Million), 2013-2020
Table 40 Intelligence Agencies Application Market Size, By Geography ($Million), 2013-2020
Table 41 Other Public Safety/Civilian Government Applications Market Size, By Geography ($Million), 2013-2020
Table 42 Other Applications Market Size, By Geography ($Billion), 2013-2020
Table 43 SDR Market Size, By Geography ($Billion), 2013-2020
Table 44 Americas: SDR Market Size, By Country ($Billion), 2013-2020
Table 45 Americas: SDR Market Size, By Component ($Billion), 2013-2020
Table 46 Americas: SDR Market Size, By Application ($Billion), 2013-2020
Table 47 Americas: SDR Market Size, By Military Application ($Million), 2013-2020
Table 48 Americas: SDR Market Size, By Short Range Communication Application ($Million), 2013-2020
Table 49 Americas: SDR Market Size, By Positioning Application ($Million), 2013-2020
Table 50 Americas: Market Size, By Transportation Application ($Million), 2013-2020
Table 51 Americas: Market Size, By Public Safety/Civilian Government Application ($Million), 2013-2020
Table 52 North America: SDR Market Size, By Country ($Billion), 2013-2020
Table 53 South America: SDR Market Size, By Country ($Billion), 2013-2020
Table 54 Europe: SDR Market Size, By Country ($Billion), 2013-2020
Table 55 Europe: SDR Market Size, By Component ($Billion), 2013-2020
Table 56 Europe: SDR Market Size, By Application ($Billion), 2013-2020
Table 57 Europe: SDR Market Size, By Military Application ($Million), 2013-2020
Table 58 Europe: SDR Market Size, By Short Range Communication Application ($Million), 2013-2020
Table 59 Europe: SDR Market Size, By Positioning Application ($Million), 2013-2020
Table 60 Europe: Market Size, By Transportation Application ($Million), 2013-2020
Table 61 Europe: Market Size, By Public Safety/Civilian Government Application ($Million), 2013-2020
Table 62 Apac: SDR Market Size, By Country ($Billion), 2013-2020
Table 63 Apac: SDR Market Size, By Component ($Billion), 2013-2020
Table 64 Apac: SDR Market Size, By Application ($Billion), 2013-2020
Table 65 Apac: SDR Market Size, By Military Application ($Million), 2013-2020
Table 66 Apac: SDR Market Size, By Short Range Communication Application ($Million), 2013-2020
Table 67 Apac: SDR Market Size, By Positioning Application ($Million), 2013-2020
Table 68 Apac: Market Size, By Transportation Application ($Million), 2013-2020
Table 69 Apac: Market Size, By Public Safety/Civilian Government Application ($Million), 2013-2020
Table 70 Row: SDR Market Size, By Country ($Billion), 2013-2020
Table 71 Row: SDR Market Size, By Component ($Billion), 2013-2020
Table 72 Row: SDR Market Size, By Application ($Billion), 2013-2020
Table 73 Row: SDR Market Size, By Military Application ($Million), 2013-2020
Table 74 Row: SDR Market Size, By Short Range Communication Application ($Million), 2013-2020
Table 75 Row: SDR Market Size, By Positioning Application ($Million), 2013-2020
Table 76 Row: Market Size, By Transportation Application ($Million), 2013-2020
Table 77 Row: Market Size, By Public Safety/Civilian Government Application ($Million), 2013-2020
Table 78 List of The Top 5 SDR Chip Manufacturers of 2013
Table 79 List of The Top 5 System Integrators For The Military Applications in The SDR Market of 2013
Table 80 List of The Top 5 System Integrators For The Commercial Applications in The SDR Market in 2013
Table 81 Most Significant Contracts, Partnerships, And Agreements of SDR Market in 2014
Table 82 Most Significant New Product Launches of SDR Market in 2014
Table 83 Recent Mergers And Acquisitions of SDR Market
Table 84 Recent Expansions of SDR Market
Table 85 Other Recent Developments of SDR Market
List of Figures (82 Figures)
Figure 1 Research Methodology
Figure 2 Market Size Estimation Methodology: Bottom-Up Approach
Figure 3 Market Size Estimation Methodology: Top-Down Approach
Figure 4 Break Down of Primary Interviews: By Company Type, Designation, & Region
Figure 5 Software Market Has Made The Highest Contribution in The SDR Market
Figure 6 Public Safety/Civilian Government Application is Expected To Have The Fastest Growth Rate in The Coming Years
Figure 7 The Americas Region Accounted For The Highest Market Share in 2013
Figure 8 SDR Market is Expected To Grow At A Cagr of 12.5% From 2014-2020
Figure 9 Public Safety/Civilian Government Application is Expected To Grow At The Fastest Cagr in The SDR Market
Figure 10 Military Application Hold A Major Market Share in The Americas Region
Figure 11 Americas Commands Over One-Third of The Overall SDR Market
Figure 12 Military Application Will Continue To Dominate The SDR Market in The Coming Six Years
Figure 13 Asian Countries Are Growing At A Faster Rate Than The American Countries
Figure 14 Apac Has Recorded The Fastest Growth Rate, Followed By The Americas And Europe
Figure 15 Evolution of The SDR
Figure 16 Market Segmentation: By Component
Figure 17 Market Segmentation: By Application
Figure 18 Market Segmentation: By Geography
Figure 19 Major Parameters Impacting The SDR Market Dynamics
Figure 20 Percentage of Cost Saving in Communication Systems After Deployment of SDR
Figure 21 Cost Breakup of SDR Base Station
Figure 22 SDR Industry Life Cycle
Figure 23 Value Chain of The SDR Market
Figure 24 Value Chain Analysis: Major Value is Added During The Manufacturing And Software Integration Phase
Figure 25 Two Different Streams of SDR Supply Chain Are Military Applications And Commercial Applications
Figure 26 Increasing Adoption in Commercial Applications is The Leading Trend in The Market
Figure 27 Porter�s Five Forces Analysis
Figure 28 Bargaining Power of The Suppliers Will Be High Due To The Limited Choices Available For The Buyers
Figure 29 Higher Market Growth Rate Will Attract New Entrants
Figure 30 Traditional Communication Technologies Creating issues For The Substitutes
Figure 31 Bargaining Power of The Suppliers is Heavily Impacted By The Quality And Reliability of The Final Product
Figure 32 Consumer Acceptance And Technology Factors Are Supporting The Buyers� Power
Figure 33 Low Entry Barriers And High Exit Barriers Are Fuelling The Competitive Rivalry
Figure 34 Essential Components of SDR
Figure 35 Software Dominated The SDR Market Throughout The Forecast Period
Figure 36 Field Programmable Gate Array Market Size Comparison In Terms of Value, in 2014 & 2020
Figure 37 Digital Signal Processor Market Size Comparison in Terms of Value, in 2014 & 2020
Figure 38 General Purpose Processor Market Size Comparison in Terms of Value, in 2014 & 2020
Figure 39 Programmable System On Chip Market Size Comparison in Terms of Value, in 2014 & 2020
Figure 40 Amplifier Market Size Comparison in Terms of Value, in 2014 & 2020
Figure 41 Role of Software in The Value Chain of The SDR Market
Figure 42 Software Market Size Comparison in Terms of Value, in 2014 & 2020
Figure 43 Other Components Market Size Comparison in Terms of Value, in 2014 & 2020
Figure 44 The Military Applications Have Been Contributing A Major Share in The Overall Application Market
Figure 45 Naval is The Fastest Growing Market of The SDR Military Application
Figure 46 Military Application Market Size Comparison in Terms of Value, in 2014 & 2020
Figure 47 Telecommunication infrastructure Market Size Comparison in Terms of Value, in 2014 & 2020
Figure 48 Wi-Fi Accounted For The Largest Share of The SDR Short Range Communication Application in 2013
Figure 49 Short Range Communication Market Size Comparison in Terms of Value, in 2014 & 2020
Figure 50 Global Positioning System Holds The Largest Percentage Share in The Positioning Application of SDR
Figure 51 Positioning Market Size Comparison in Terms of Value, in 2014 & 2020
Figure 52 Intelligent Transport System Market Has A Great Scope in Future And is Expected To Grow At The Fastest Cagr
Figure 53 Transportation Market Size Comparison in Terms of Value, in 2014 & 2020
Figure 54 Paramilitary Forces Holds The Largest Percentage Share in The Public Safety/Civilian Government Application of SDR
Figure 55 Public Safety/Civilian Government Market Size Comparison in Terms of Value, in 2014 & 2020
Figure 56 Other Applications Market Size Comparison in Terms of Value, in 2014 & 2020
Figure 57 Geographic Snapshot (2013)
Figure 58 Americas SDR Market Snapshot
Figure 59 The U.S. Dominated The North American SDR Market With The Highest Market Share
Figure 60 Brazil Holds The Maximum Share in The SDR Market in South America
Figure 61 Europe�s SDR Market Snapshot
Figure 62 U.K. Accounted For The Highest Share in Europe�s SDR Market
Figure 63 Asia-Pacific SDR Market Snapshot
Figure 64 Japan Holds The Maximum Market Share of Apac�s SDR Market in 2013
Figure 65 Rest of The World SDR Market Snapshot
Figure 66 Saudi Arabia is Expected To Be The Fastest Growing Market of Row�s SDR Market
Figure 67 Companies Adopted Contracts, Partnerships, And Agreements As The Key Growth Strategies Over The Last Five Years
Figure 68 Battle For Market Share: Contracts, Partnerships, And Agreements Are The Key Strategy
Figure 69 Geographic Revenue Mix of The Top 5 Market Players
Figure 70 BAE Systems Plc: Business Overview
Figure 71 SWOT Analysis
Figure 72 Harris Corporation: Business Overview
Figure 73 SWOT Analysis
Figure 74 ITT Corporation: Business Overview
Figure 75 L3 Communication Holdings Plc: Business Overview
Figure 76 Northrop Grumman Corporation: Business Overview
Figure 77 Raytheon Co.: Business Overview
Figure 78 SWOT Analysis
Figure 79 Rockwell Collins inc.: Business Overview
Figure 80 SWOT Analysis
Figure 81 Thales Defense & Security inc.: Business Overview
Figure 82 SWOT Analysis


Growth opportunities and latent adjacency in Software Defined Radio (SDR) Market
Excellent brief. Can I have a latest update on teh report having outlook till 2025RegdsSanjay [email protected]