Solar Vehicle Market by EV (BEV, HEV & PHEV), Vehicle Type (PC & CV), Battery (Lithium-ion, Lead acid, & Lead carbon), Solar Panel (monocrystalline & polycrystalline), Neighborhood vehicles, Charging Stations, and Region - Global Forecast to 2030


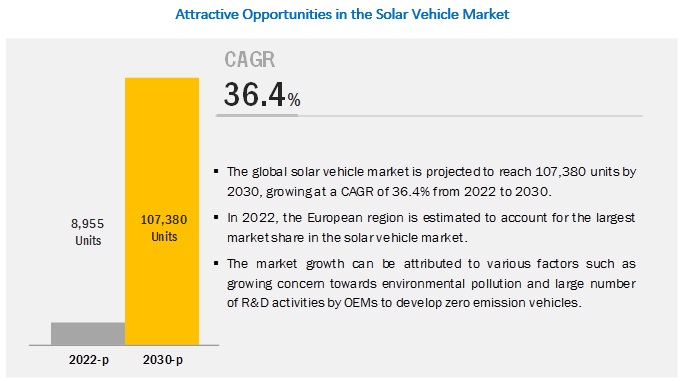
[137 Pages Report] The global solar vehicle market to reach 107,380 units by 2030 from projected 8,955 units by 2022, at a CAGR of 36.4% during the forecast period. Solar vehicle is an electric vehicle integrated with solar panels. Generally, solar panels consist of photovoltaic cells which help to convert solar energy into electric energy. The propulsion of these vehicles is usually offered through solar energy, and the efficiency of solar modules defines the propulsive force of the vehicle.
To request to know about sample pages on the above findings, click Request Sample
By Battery: Lithium-ion battery is expected to be the largest segment in the solar vehicle market
The lithium-ion battery segment is anticipated to register the largest growth during the forecast period. This type of battery offers all the suitable characteristics required for the operation of these vehicles. The battery provides high energy density with rapid discharging capability, thereby enabling a smooth charging cycle. Furthermore, with the highest power conversion ratio, this battery offers maximum efficiency, making it most suitable for these vehicles.
By Vehicle Type: Passenger car segment is expected to dominate the solar vehicle market
The rising sales of passenger cars in the electric vehicle segment is the primary factor responsible for the growth of this segment during the forecast period. The propulsive force needed for passenger cars is lesser than commercial vehicles. Thus, solar panels are integrated into passenger cars which accomplish the objective of lower emissions. The commercial vehicle segment is expected to gain gradual growth during the forecast period.
By solar-powered charging station: Asia Pacific is expected to grow at the fastest rate during the forecast period.
A majority of these vehicles sales and EV charging station installations in Asia Pacific are expected to be driven by the huge demand in countries such as China and Japan. Asia Pacific is one of the largest markets for electric vehicles and likely to become the same for these vehicles. Furthermore, South Korea and India are taking initiatives to reduce greenhouse gas emissions by increasing the use of electric vehicles. Further, to develop the infrastructure for electric vehicles, government authorities are taking a keen interest in developing charging station infrastructure in the region. Thus, by integrating solar panels over charging stations of electric vehicles, the efficiency of power supply increases and the dependability over electric grid reduces. This factor is responsible for the growth of solar charging stations in the Asia Pacific region.
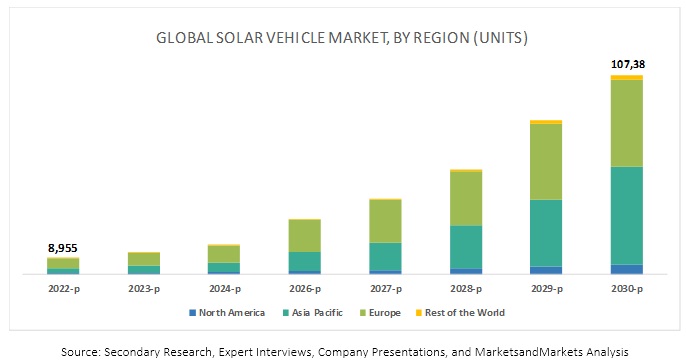
Asia Pacific is expected to account for the largest market size during the forecast period
The Asia Pacific region is estimated to be the largest the market by 2030. The region comprises some of the fastest developing economies of the world such as China and India. The Asia Pacific region is the largest market for automotive as the growing purchasing power of consumers has triggered the demand for automobiles in the region. Also, climatic conditions of the Southeast Asian countries are suitable for these vehicles. Moreover, the high demand for passenger cars from emerging countries of the region is likely to drive the growth of the Asia Pacific market during the forecast period.
Europe has been at the forefront in terms of early adoption of electric cars in the world. Thus, it is expected that the adoption of these vehicles in Europe will gain traction during the forecast period. Strict environmental policies and pollution control measures are likely to contribute to the faster adoption of these vehicles in the region. According to a recent report by ING, a leading European financial institution, every new car sold in Europe will be electric in the near future. The integration of solar panels with electric vehicles makes them more efficient, which may lead to higher adoption of these vehicles in the region. Favorable government support, decreasing battery cost, and economies of scale are cited as the primary reason for the stated prediction.
Scope of the Report
|
Report Metric |
Details |
|
Market size available for years |
2022–2030 |
|
Base year considered |
- |
|
Forecast period |
2022–2030 |
|
Forecast units |
Volume (Units) |
|
Segments covered |
By EV, Vehicle Type, Battery, Solar Panel, Charging Station, Neighborhood Vehicle, and Region |
|
Geographies covered |
Asia Pacific, Europe, North America, and Rest of the World |
|
Companies covered |
Volkswagen (Germany), Toyota (Japan), Ford (US), Mahindra (India), Nissan (Japan), GM (US), Sono Motors (Germany), Cruise Car (US), Solar Electric Vehicle Company (US) |
This research report categorizes the solar vehicle market based on EV type, vehicle type, battery, solar panel, charging station, neighborhood vehicle, and region
On the basis of electric vehicle type, the market has been segmented as follows:
- BEV
- HEV
- PHEV
On the basis of vehicle type, the market has been segmented as follows:
- Passenger Cars
- Commercial Vehicles
On the basis of battery, the market has been segmented as follows:
- Lithium-ion
- Lead-Acid
- Lead carbon
On the basis of solar panel, the market has been segmented as follows:
- Monocrystalline
- Polycrystalline
On the basis of charging station, the market has been segmented as follows:
- Asia Pacific
- Europe
- North America
- Rest of the World
On the basis of neighborhood vehicle, the market has been segmented as follows:
- Commercial Turf Utility Vehicles
- Industrial Utility Vehicles
- Golf Cars
- Personnel Carriers
On the basis of region, the market has been segmented as follows:
-
Asia Pacific
- China
- India
- Japan
- South Korea
- Thailand
- Malaysia
-
Europe
- France
- Germany
- Norway
- The Netherlands
- UK
-
North America
- US
- Canada
-
RoW
- Brazil
- Dubai
- South Africa
Critical Questions:
- How will the trend of solar electric vehicle will impact the overall EV market in the long term?
- How will the industry cope with the challenge of operating efficiency of solar vehicles?
- How do you see the impact of the stringent emission regulations in the solar vehicle market?
- What are the upcoming trends in the solar vehicle market? What impact would they make in the coming years?
- What are the key strategies adopted by top players in this market?
Key Market Players
The major solar vehicle market players include Sono Motors (Germany), Volkswagen (Germany), Toyota (Japan), Ford (US), Mahindra (India), Nissan (Japan), GM (US), Cruise Car (US), and Solar Electric Vehicle Company (US), among others. These companies have strong distribution networks at a global level. In addition, these companies offer an extensive product range. The key strategies adopted by these companies to sustain their market position are new product developments, collaborations, and contracts & agreements. For Instance, in March 2019, Sono Motors showcased its first solar electric vehicle in Germany. The vehicle is mounted with solar cells over the roof capable of generating power worth 34 km in a day. The operating range of this vehicle is around 255 km with an extended range of 34 km on a sunny day.
To speak to our analyst for a discussion on the above findings, click Speak to Analyst
 Exclusive indicates content/data unique to MarketsandMarkets and not available with any competitors.
Table of Contents
1 Introduction (Page No. - 16)
1.1 Objectives of the Study
1.2 Market Definition
1.3 Market Scope
1.4 Years Considered for the Study
1.5 Currency & Pricing
1.6 Package Size
1.7 Limitations
1.8 Stakeholders
2 Research Methodology (Page No. - 20)
2.1 Research Data
2.1.1 Secondary Data
2.1.1.1 Key Secondary Sources
2.1.1.2 Key Data From Secondary Sources
2.1.2 Primary Data
2.1.3 Sampling Techniques & Data Collection Methods
2.1.4 Primary Participants
2.2 Market Size Estimation
2.2.1 Bottom-Up Approach
2.2.2 Top-Down Approach
2.3 Market Breakdown and Data Triangulation
2.4 Assumptions
3 Executive Summary (Page No. - 28)
4 Premium Insights (Page No. - 32)
4.1 Attractive Opportunities in the Solar Vehicle Market
4.2 Market Share, By Country
4.3 Market, By EV Type
4.4 Market, By Vehicle Type
4.5 Market, By Battery
4.6 Market, By Solar Panel
4.7 Market, By Charging Station
4.8 Market, By NEV
4.9 Market, By Region
5 Market Overview (Page No. - 37)
5.1 Introduction
5.2 Market Dynamics
5.2.1 Drivers
5.2.1.1 Growing Concern About Environmental Pollution
5.2.1.2 Government Funding, Subsidies, and Incentives to Encourage Eco-Friendly Vehicles
5.2.1.3 Increasing Investments in R&D Activities By Oems to Develop Zero-Emission Vehicles
5.2.2 Restraints
5.2.2.1 Less Operational Efficiency of Solar Vehicles Coupled With High Cost
5.2.2.2 Lack of Standardization
5.2.3 Opportunities
5.2.3.1 EV Charging Stations Powered By Solar Panels
5.2.3.2 Use of Vehicle-To-Grid (V2g) EV Charging Stations for Electric Vehicles
5.2.4 Challenges
5.2.4.1 Low Efficiency Resulting in Short Distance Operation of Associated Solar Vehicles
6 Industry Trends (Page No. - 45)
6.1 Introduction
6.2 Technology Overview
6.2.1 Batteries Used in Solar Vehicles
6.2.1.1 Lead–Acid Battery
6.2.1.1.1 Advantages of Lead–Acid Battery
6.2.1.1.2 Disadvantages of Lead–Acid Battery
6.2.1.2 Lead Carbon Battery
6.2.1.2.1 Advantages of Lead Carbon Battery
6.2.1.2.2 Disadvantages of Lead Carbon Battery
6.2.1.3 Lithium–Ion Battery
6.2.1.3.1 Advantages of Lithium–Ion Battery
6.2.1.3.2 Disadvantages of Lithium–Ion Battery
6.2.1.4 Solid State Battery (SSB)
6.2.2 Photovoltaics Panels (Monocrystalline) Solar Vehicles
6.3 Porter’s 5 Forces Analysis
7 Solar Vehicle Market, By Vehicle Type (Page No. - 50)
7.1 Introduction
7.1.1 Research Methodology
7.2 Passenger Car
7.2.1 High Adoption of Electric Vehicles and Increasing Demand for Eco-Friendly Vehicles are Driving the Growth of Passenger Car Segment
7.3 Commercial Vehicle
7.3.1 Increasing Concern Towards Environmental Pollution is Expected to Drive the Commercial Vehicle Solar Market
8 Solar Vehicle Market, By EV Type (Page No. - 56)
8.1 Introduction
8.1.1 Research Methodology
8.2 Battery Electric Vehicle (BEV)
8.2.1 Growing Demand to Improve the Efficiency of Electric Vehicles is Expected to Drive the BEV Segment
8.3 Hybrid Electric Vehicle (HEV)
8.3.1 High Impact of Carbon Footprint of Automobiles is the Primary Factor Driving the Growth of HEV Segment
8.4 Plug-In Hybrid Electric Vehicle (PHEV)
8.4.1 Government Funding and Subsidies to Encourage Eco-Friendly Vehicles Have Triggered the Grwoth of PHEV Segment
9 Solar Vehicle Market, By Battery (Page No. - 63)
9.1 Introduction
9.2 Lithium-Ion Battery
9.2.1 Owing to Suitable Technical Properties for Solar Technology, Lithium-Ion Battery is Expected to Lead the Market During the Forecast Period
9.3 Lead-Acid
9.4 Lead Carbon
10 Solar Vehicle Market, By Solar Panel (Page No. - 67)
10.1 Introduction
10.2 Monocrystalline Solar Panel
10.2.1 Monocrystalline Panel Offers Highest Efficiency in Terms of Conversion for Solar Energy Into Electrical Energy
10.3 Polycrystalline Solar Panel
11 Solar Vehicle Market, By Charging Station (Page No. - 70)
11.1 Introduction
11.1.1 Research Methodology
11.2 Residential
11.3 Commercial
11.3.1 Asia Pacific
11.3.1.1 High Adoption Rate of EVs in China, Japan and Others Solar Charging Stations are Expected to Increase in the Coming Years in Asia Pacific Region
11.3.2 Europe
11.3.2.1 Stringent Emission Norms Leading to Increase in EV Sales is Expected to Boost the Solar Charging Station in Europe Region
11.3.3 North America
11.3.3.1 Growing Focus on Renewable Energy Sources Like Solar, EV Infrastructure Providers are Likely to Install Solar Panels on EV Charging Stations in North America Region
12 Solar Vehicle Market, By Neighborhood Electric Vehicles (NEV) (Page No. - 76)
12.1 Introduction
12.1.1 Research Methodology
12.2 Commercial Turf Utility Vehicles
12.2.1 Many EV Manufacturers are Focusing to Get Rid of Fossil Fuels and Emphasizing on to Install Solar Cell Over Utility Vehicles
12.3 Industrial Utility Vehicles
12.3.1 Industrial Utility Vehicles are Expected to Be Integrated With Solar Panels Due to the Requirement of High Efficiency for Heavy Application
12.4 Golf Carts
12.4.1 Numerous Golf Clubs in the US Have Adopted Solar Powered Golf Carts Due to Its Cost Effectiveness
12.5 Personnel Carrier
12.5.1 the Sale of Solar Personnel Carriers is Expected to Increase Owing to Rise in Gated Communities, and Tourist Places.
13 Solar Vehicle Market, By Region (Page No. - 80)
13.1 Introduction
13.2 Asia Pacific
13.2.1 China
13.2.1.1 China is the Largest Market of EVs and May Witness Exponential Growth for Solar Vehicles
13.2.2 India
13.2.2.1 Emission Norms in India Will Propel the Growth of the Solar Vehicle Market
13.2.3 Japan
13.2.3.1 The BEV Segment is Projected to Be the Fastest Growing Segment in the Japanese Market
13.2.4 South Korea
13.2.4.1 Korean Automakers See Solar Technology as Better Alternative to Enhance Efficiency
13.2.5 Thailand
13.2.5.1 High Number of Initiatives Adopted By Thai Government to Promote Zero Emission Vehicles Will Fuel the Growth of Solar Vehicles
13.2.6 Malaysia
13.2.6.1 Government Policies to Reduce Carbon Emission Would Boost the Demand for Solar Vehicle in Malaysia
13.3 Europe
13.3.1 France
13.3.1.1 Rising Number of PHEV Models Due to Higher Efficiency is Likely to Garner the Growth of PHEV Segment of Solar Vehicle Market
13.3.2 Germany
13.3.2.1 Increased Investments in R&D By German Automakers are Expected to Improve the Operating Range of Eco-Friendly Vehicles
13.3.3 Norway
13.3.3.1 Rise in the Sales of Eco-Friendly Vehicles is Expected to Boost the Market for Solar Vehicle
13.3.4 the Netherlands
13.3.4.1 Large EV Fleet and High Demand for Eco-Friendly Cars are Expected to Propel the Growth of Solar Vehicles
13.3.5 UK
13.3.5.1 Heavy Investments By Oems Such as Jaguar Land Rover, Nissan, and Honda are Expected to Be the Primary Growth Factor
13.4 North America
13.4.1 Canada
13.4.1.1 The Canadian Auto Industry is One of the Largest “Green Tech” Sectors in the World
13.4.2 US
13.4.2.1 The US Automotive Industry is Highly Inclined Toward Innovation, Technology, and the Development of High-Performance and Fuel-Efficient Vehicles
13.5 Rest of the World
13.5.1 Brazil
13.5.1.1 The Brazilian Market for Solar Vehicle Will Be Driven By the Initiatives Taken By Oems and Tier 1 Suppliers in the Country
13.5.2 United Arab Emirates
13.5.2.1 The BEV Segment is Projected to Be the Largest Solar Vehicle Market in United Arab Emirates
13.5.3 South Africa
13.5.3.1 The Few Oem and Tier 1 Suppliers are Extending Their Reach in African Countries
14 Competitive Landscape (Page No. - 104)
14.1 Overview
14.2 Market Ranking Analysis
14.3 Competitive Situations and Trends
14.3.1 New Product Developments
14.3.2 Expansions
14.3.3 Partnerships/Supply Contracts/Collaborations/ Joint Ventures/Agreements/Mergers & Acquisitions
14.4 Competitive Leadership Mapping
14.4.1 Visionary Leaders
14.4.2 Innovators
14.4.3 Dynamic Differentiators
14.4.4 Emerging Companies
15 Company Profiles (Page No. - 110)
(Business Overview, Products Offered, Recent Developments & SWOT Analysis)*
15.1 Volkswagen
15.2 Toyota
15.3 Ford
15.4 Mahindra & Mahindra
15.5 Nissan
15.6 General Motors
15.7 Sono Motors
15.8 Hanergy Thin Film Power Group
15.9 Cruise Car
15.10 Solar Electric Vehicle Company
15.11 Jinko Solar
15.12 Trina Solar
15.13 Other Key Regional Players
15.13.1 Asia Pacific
15.13.1.1 Weifang Guangsheng New Energy Co., Ltd.
15.13.1.2 Sikco
15.13.1.3 Surat Exim Pvt. Ltd.
15.13.1.4 Jj Pv Solar
15.13.2 Europe
15.13.2.1 Alke
15.13.2.2 Lightyear
15.13.3 North America
15.13.3.1 Solarrolla
*Details on Business Overview, Products Offered, Recent Developments & SWOT Analysis Might Not Be Captured in Case of Unlisted Companies.
16 Appendix (Page No. - 131)
16.1 Insights From Industry Experts
16.2 Discussion Guide
16.3 Knowledge Store: Marketsandmarkets’ Subscription Portal
16.4 Available Customizations
16.5 Related Reports
16.6 Author Details
List of Tables (44 Tables)
Table 1 Impact of Market Dynamics
Table 2 Government Incentive Programs, 2018
Table 3 Solar Vehicle Market, By Vehicle Type, 2022–2030 (Units)
Table 4 Passenger Car: Solar Vehicle Market, By Region, 2022–2030 (Units)
Table 5 Commercial Vehicles: Solar Vehicle Market, By Region, 2022–2030 (Units)
Table 6 Market, By EV Type, 2022–2030 (Units)
Table 7 BEV: Solar Vehicle Market, By Region, 2022–2030 (Units)
Table 8 HEV: Solar Vehicle Market, By Region, 2022–2030 (Units)
Table 9 PHEV: Solar Vehicle Market, By Region, 2022–2030 (Units)
Table 10 Lithium-Ion: Solar Vehicle Market, By Region, 2022–2030 (Units)
Table 11 Lithium-Ion: Solar Vehicle Market, By Region, 2022–2030 (Units)
Table 12 Charging Station: Solar Vehicle Market, By Region, 2020–2030 (Units)
Table 13 Charging Station: Asia Pacific Market, By Country, 2020–2030 (Units)
Table 14 Charging Station: Europe Market, By Country, 2020–2030 (Units)
Table 15 Charging Station: North America Market, By Country, 2020–2030 (Units)
Table 16 US: Market, By NEV, 2018–2030 (Units)
Table 17 Solar Vehicle Market, By Region, 2022–2030 (Units)
Table 18 Asia Pacific: Market, By Country, 2022–2030 (Units)
Table 19 Asia Pacific: Market, By EV Type, 2022–2030 (Units)
Table 20 China: Market, By EV Type, 2022–2030 (Units)
Table 21 India: Market, By EV Type, 2022–2030 (Units)
Table 22 Japan: Market, By EV Type, 2022–2030 (Units)
Table 23 South Korea: Market, By EV Type, 2022–2030 (Units)
Table 24 Thailand: Market, By EV Type, 2022–2030 (Units)
Table 25 Malaysia: Market, By EV Type, 2022–2030 (Units)
Table 26 Europe: Market, By Country, 2022–2030 (Units)
Table 27 Europe: Market, By EV Type, 2022–2030 (Units)
Table 28 France: Market, By EV Type, 2022–2030 (Units)
Table 29 Germany: Market, By EV Type, 2022–2030 (Units)
Table 30 Norway: Market, By EV Type, 2022–2030 (Units)
Table 31 Netherlands: Market, By EV Type, 2022–2030 (Units)
Table 32 UK: Market, By EV Type, 2022–2030 (Units)
Table 33 North America: Market, By Country, 2022–2030 (Units)
Table 34 North America: Market, By EV Type, 2022–2030 (Units)
Table 35 Canada: Market, By EV Type, 2022–2030 (Units)
Table 36 US: Market, By EV Type, 2022–2030 (Units)
Table 37 RoW: Market, By Country, 2022–2030 (Units)
Table 38 RoW: Market, By EV Type, 2022–2030 (Units)
Table 39 Brazil: Market, By EV Type, 2022–2030 (Units)
Table 40 United Arab Emirates: Market, By EV Type, 2022–2030 (Units)
Table 41 South Africa: Market, By EV Type, 2022–2030 (Units)
Table 42 New Product Developments, 2014–2019
Table 43 Expansions, 2018
Table 44 Partnerships/Supply Contracts/Collaborations/Joint Ventures/ Agreements/Mergers & Acquisitions, 2017–2019
List of Figures (52 Figures)
Figure 1 Segments Covered
Figure 2 Research Design
Figure 3 Research Methodology Model
Figure 4 Breakdown of Primary Interviews
Figure 5 Market Size Estimation Methodology for the Solar Vehicle: Bottom-Up Approach
Figure 6 Market Size Estimation Methodology for the Solar Vehicle: Top-Down Approach
Figure 7 Data Triangulation
Figure 8 Solar Vehicle: Market Dynamics
Figure 9 Solar Vehicle Market, By Region, 2022–2030 (Units)
Figure 10 Market, By EV Type, Market Share, 2030
Figure 11 Growing Concern Towards Environmental Pollution and R&D Activities to Enhance the Efficiency of EV are Expected to Boost the Growth of Market From 2022 to 2030
Figure 12 Brazil is Expected to Be the Fastest Growing Market From 2022 to 2030
Figure 13 BEV Segment is Expected to Be the Largest Market By 2030
Figure 14 Passenger Car Segment is Expected to Be the Largest Market By 2030
Figure 15 Asia Pacific Region for Lithium-Ion Battery is Expected to Be the Largest Market, By Battery, 2022 vs. 2030
Figure 16 Asia Pacific Region is Expected to Have the Largest Market of Market, By Solar Panel, 2022–2030
Figure 17 Asia Pacific is Expected to Hold the Largest Share of this Market, By Charging Station, 2020–2030
Figure 18 Golf Cart is Expected to Be the Largest Segment of Market in the US, 2022 vs. 2030
Figure 19 Asia Pacific is Expected to Be the Largest Market By 2030
Figure 20 Solar Vehicle: Market Dynamics
Figure 21 Working of V2g Charging Station
Figure 22 Types of Electric Vehicle Battery
Figure 23 High Threat of Substitutes Due to Increasing Adoption Rate of Electric Vehicles
Figure 24 Passenger Car Segment is Expected to Dominate the Solar Vehicle Market, 2022 vs. 2030 (Units)
Figure 25 Key Primary Insights
Figure 26 BEV Segment is Expected to Be the Largest Market During the Forecast Period (2022–2030)
Figure 27 Key Primary Insights
Figure 28 Market, Lithium-Ion Battery, 2022 vs 2030 (Units)
Figure 29 Market, Monocrystalline Solar Panel, 2022 vs 2030 (Units)
Figure 30 Charging Station: Market, By Region, 2022 vs. 2030 (Units)
Figure 31 US: Market, By NEV, 2022 vs. 2030 (Units)
Figure 32 Market, By Region, 2022 vs. 2030
Figure 33 Asia Pacific: Market Snapshot
Figure 34 Europe: Market, By Country, 2022 vs. 2030 (Units)
Figure 35 North America: Market Snapshot
Figure 36 RoW: Market, By Country, 2022 vs. 2030 (Units)
Figure 37 Key Developments By Leading Players in the Market, 2014–2018
Figure 38 Volkswagen Led the Market in 2018
Figure 39 Solar Vehicle Market (Global): Competitive Leadership Mapping, 2018
Figure 40 Volkswagen: Company Snapshot
Figure 41 Volkswagen: SWOT Analysis
Figure 42 Toyota: Company Snapshot
Figure 43 Toyota: SWOT Analysis
Figure 44 Ford: Company Snapshot
Figure 45 Ford: SWOT Analysis
Figure 46 Mahindra & Mahindra: Company Snapshot
Figure 47 Mahindra & Mahindra: SWOT Analysis
Figure 48 Nissan: Company Snapshot
Figure 49 Nissan: SWOT Analysis
Figure 50 General Motors: Company Snapshot
Figure 51 Hanergy: Company Snapshot
Figure 52 Jinko Solar: Company Snapshot
The study involved 4 major activities in estimating the market size for solar vehicles. Exhaustive secondary research was done to collect information on the market, peer market, and parent market. The next step was to validate these findings, assumptions, and sizing with industry experts across value chains through primary research. Both top-down and bottom-up approaches were employed to estimate the complete market size. Thereafter, market breakdown and data triangulation were used to estimate the solar vehicle market size of segments and subsegments.
Secondary Research
In the secondary research process, various secondary sources such as company annual reports/presentations, press releases, industry association publications Sustainable Energy Association, National Motorists Association, National Automobile Dealers Association, International Human Powered Vehicle Association, European Photovoltaic Industry Association, Malaysian Photovoltaic Industry Association, China Photovoltaic Industry Association (CPIA), British Photovoltaic Association (BPVA), South African Photovoltaic Industry Association (SAPVIA), Korea Photovoltaic Industry Association (KOPIA), Solar Energy Industries Association (SEIA), European Automotive Research Partners Association (EARPA), China Association Of Automoblie Manufacturers (CAAM)], automotive magazine articles, directories, technical handbooks, World Economic Outlook, trade websites, technical articles, and databases (Marklines and Factiva) have been used to identify and collect information useful for an extensive commercial study of the global solar vehicle market.
Primary Research
Extensive primary research has been conducted after acquiring an understanding of the market scenario through secondary research. Several primary interviews have been conducted with market experts from the demand- and supply-side OEMs [(in terms of component supply), country-level government associations, and trade associations] and component manufacturers across 4 major regions, namely, Asia Pacific, Europe, North America, and Rest of the World. Approximately 23% and 77% of primary interviews have been conducted from the demand and supply side, respectively. Primary data has been collected through questionnaires, emails, and telephonic interviews. In the canvassing of primaries, we have strived to cover various departments within organizations, such as sales, operations, and administration, to provide a holistic viewpoint in our report.
After interacting with industry experts, we have also conducted brief sessions with highly experienced independent consultants to reinforce the findings from our primaries. This, along with the in-house subject-matter expert’s opinions, has led us to the findings as described in the remainder of this report.
To know about the assumptions considered for the study, download the pdf brochure
Market Size Estimation
Both top-down and bottom-up approaches were used to estimate and validate the total size of the market. These methods were also used extensively to estimate the size of various subsegments in the market. The research methodology used to estimate the solar vehicle market size includes the following:
- The key players in the industry and markets have been identified through extensive secondary research
- The industry’s supply chain and market size, in terms of volume, have been determined through primary and secondary research processes
- All percentage shares, splits, and breakdowns have been determined using secondary sources and verified through primary sources
Data Triangulation
After arriving at the overall solar vehicle market size-using the market size estimation processes as explained above-the market was split into several segments and subsegments. To complete the overall market engineering process and arrive at the exact statistics of each market segment and subsegment, data triangulation and market breakdown procedures were employed, wherever applicable. The data was triangulated by studying various factors and trends from both demand and supply sides.
Report Objectives
- To analyze and forecast the solar vehicle market, in terms of volume (units), from 2022 to 2030
- To provide detailed information regarding the major factors influencing the growth of the market (drivers, restraints, opportunities, and industry-specific challenges)
- To analyze the regional markets for growth trends, prospects, and their contribution to the overall market
- To segment and forecast the market, by volume, on the basis of region (Asia Pacific, Europe, North America, and Rest of the World)
- To segment and forecast the market, by volume, on the basis of battery (lithium-ion, lead-acid, and lead carbon)
- To segment and forecast the solar vehicle market, by volume, on the basis of solar panel (monocrystalline and polycrystalline)
- To segment and forecast the market, by volume, on the basis of electric vehicle (BEV, HEV, and PHEV)
- To segment and forecast the market, by volume, on the basis of vehicle type (passenger cars (PC) and commercial vehicle (CV))
- To segment and forecast the market, by volume, on the basis of regional solar-powered charging station (Asia Pacific, Europe, and North America)
- To segment and forecast the market, by volume, on the basis of neighborhood vehicles (commercial turf utility vehicles, industrial utility vehicles, golfs cars, and personnel carriers)
- To analyze opportunities for stakeholders and the competitive landscape for market leaders
- To strategically profile key players and comprehensively analyze their respective market share and core competencies
To track and analyze competitive developments such as joint ventures, mergers & acquisitions, new product launches, expansions, and other activities undertaken by the key industry participants
Available Customizations
- Solar Vehicle Market, By vehicle type at regional level
Company Information
- Profiling of Additional Market Players (Up to 3)


Growth opportunities and latent adjacency in Solar Vehicle Market