Sound Reinforcement Market by Product Type (Microphones, Professional Speakers, Audio Mixers, Power Amplifiers), Format (Digital, Analog), End User (Corporate, Education, Large Venue & Events, Hospitality), Geography - Global Forecast to 2025-2036


The global sound reinforcement market was valued at USD 8.54 billion in 2024 and is projected to reach USD 12.34 billion by 2036, growing at a CAGR of 4.3% between 2025 and 2036.
The sound reinforcement market is experiencing robust growth driven by multiple factors. Firstly, the expanding entertainment and live event industries worldwide are fueling demand for high-quality audio systems that deliver immersive sound experiences in large venues, concerts, and sports arenas. Technological advancements such as wireless, digital, and smart audio technologies are significantly improving audio clarity, reliability, and ease of use, further accelerating market adoption. Additionally, rising disposable incomes in emerging markets and a growing focus on enhancing audience engagement are key drivers behind this upward trajectory. As organizations increasingly prioritize superior sound quality for events and broadcasts, the industry is poised for sustained growth over the coming years.

Ongoing innovations in IoT and AI integration are enabling more intelligent, remote-controlled, and adaptive audio systems, providing venues and event organizers with new opportunities to improve operational efficiency and audience experience. The rising frequency of large-scale concerts, conferences, and cultural festivals worldwide, coupled with investments in infrastructure upgrades, continues to propel market expansion. These combined factors make sound reinforcement a vital component of the future live entertainment and professional audio markets, ensuring steady growth well into the next decade.
Market by Product Type
Professional Speakers
By product type, professional speakers holds the largest share of the sound reinforcement market, as they are the essential output devices for diverse applications such as concerts, corporate events, educational institutions, and large venues. Their ability to deliver high-quality, powerful, and reliable audio makes them indispensable for both fixed and portable installations. With the expanding number of live events, entertainment venues, and corporate gatherings worldwide, demand for professional speakers continues to rise. Technological advancements such as line array design, wireless connectivity, and improved durability further strengthen their adoption. Integration with sophisticated audio management systems and flexible configuration options supports their dominance across end user segments.
Microphones
The microphones segment is expected to grow at a significant CAGR during the forecast period, fueled by rising demand from dynamic end uses such as sports tournaments, education, and increasingly corporate and event environments. The rapid adoption of wireless and digital microphone technologies is enhancing flexibility and audio quality while reducing setup complexity. Key drivers include the popularity of live performances, conferences, e-learning, and remote collaborations that require high-quality audio capture. Ongoing innovations and the push for smarter, compact, and user-friendly designs are expanding their use in new scenarios and contributing to sustained, robust growth for microphones in the sound reinforcement space.
Market by End User
Large Venues
By end user, the large venues segment is expected to hold the largest share of the sound reinforcement market, owing to the substantial demand for powerful audio systems in concerts, stadiums, theaters, and festivals. These spaces require high-capacity professional speakers, mixers, and signal processors to deliver clear, immersive sound experiences for vast audiences. Rising popularity of live music performances and sports events worldwide continues to fuel this segment’s growth. Investments from entertainment operators and event organizers also play a critical role, ensuring regular upgrades and integration of advanced technologies in audio setups for superior sound quality.
Corporate
The corporate segment is expected to grow at a significant CAGR during the forecast period, with the rapid digital transformation of boardrooms, collaboration spaces, and offices. Increasing adoption of AV and IoT-enabled sound systems empowers seamless communication, productive meetings, and interactive presentations. Enhanced remote and hybrid working trends further boost demand for reliable sound reinforcement solutions. Businesses are investing in high-quality microphones, speakers, and smart audio mixers to improve workforce engagement and deliver professional-grade audio for conferences and trainings, driving robust market expansion in this segment.
Market by Geography
Geographically, the sound reinforcement market is expanding across North America, Europe, Asia Pacific, and the Rest of the World (ROW), including the Middle East, South America, and Africa. Asia Pacific is expected to grow at the highest CAGR, driven by factors such as rapid urbanization, strong economic development, and increased investments in infrastructure and entertainment sectors. Major contributors China, India, Japan, and Australia are seeing rising demand for professional audio solutions as governments and private entities expand digitalization initiatives in education, hospitality, and commercial sectors. The region's vibrant music, entertainment, and events scene, along with consumer preference for live concerts and robust audio experiences, fuels sustained demand for sound reinforcement systems. The adoption of new audio-visual technologies and increasing disposable incomes are further amplifying the market's expansion, making Asia Pacific a primary growth hotspot for the industry.
Market Dynamics
Driver: Increasing penetration of lot in professional AV equipment or AV business
The increasing penetration of IoT in professional AV equipment and the AV business is a key driver for the sound reinforcement market. IoT integration enables connected, smart AV devices that can be remotely monitored, controlled, and managed, improving efficiency and user experience. This connectivity allows seamless integration of AV systems with other enterprise operations, enhancing collaboration and real-time data analytics for performance optimization. The growing trend toward smart buildings, digital signage, and interactive displays powered by IoT is propelling demand for advanced audio-visual solutions, thereby accelerating market growth. Additionally, IoT-enabled AV systems support adaptive and immersive experiences, which are becoming increasingly important across corporate, education, and entertainment sectors.
Restraint: Compliance issues in operating frequencies for wireless microphones
Compliance issues in operating frequencies for wireless microphones pose a significant restraint to the sound reinforcement market. Different countries have varying regulations on frequency use, and recent reallocations by authorities like the FCC have restricted usage in popular bands such as the 600 MHz range, now reserved for other wireless services like 5G. This limits the availability of frequency spectrum for wireless microphones, causing challenges for users in avoiding interference and adhering to legal requirements. Non-compliance can lead to fines, operational disruptions, or forced equipment upgrades, increasing costs and complexity for users and slowing market adoption.
Opportunity: Increasing number of concerts and live performances
The increasing number of concerts and live performances is a significant opportunity driving the growth of the sound reinforcement market. The surge in live music events, festivals, and entertainment shows globally is propelling demand for advanced audio equipment to deliver high-quality sound experiences. With rising disposable incomes and a strong appetite for immersive and memorable live performances, both in-person and hybrid digital concerts are expanding rapidly. This growth also benefits related industries like hospitality and tourism, further boosting investments in professional sound reinforcement systems. Innovations in streaming technology and audience engagement are enhancing concert experiences, making live events a key growth engine for the market.
Challenge: Issues in delivering high-quality audio due to improper placement of wireless sound reinforcement equipment
Issues in delivering high-quality audio due to improper placement of wireless sound reinforcement equipment remain a significant challenge in the market. Poor placement can lead to uneven sound coverage, dead zones, and signal dropouts, particularly in large or acoustically complex venues. Obstacles such as architectural features or audience movement can block signal transmission, causing interference and inconsistent audio quality. To mitigate these problems, careful planning, room acoustic measurements, and the use of diversity antenna systems are essential. Properly positioning microphones and speakers ensures clear, consistent sound delivery, which is crucial for audience engagement and event success.
Future Outlook
Between 2025 and 2036, the sound reinforcement market is expected to grow substantially, due to increasing demand for high-quality audio solutions across live events, entertainment venues, and corporate environments. Technological innovations such as wireless connectivity, AI-based sound optimization, and digital integration are enhancing product capabilities and customer experience. Expanding live concerts, sports events, and the modernization of event infrastructure worldwide, especially in emerging markets like Asia Pacific, further support robust market growth. Despite challenges like regulatory restrictions and high equipment costs, investments in research and development and rising consumer expectations for immersive audio experiences continue to fuel market advancement.
Key Market Players
Top sound reinforcement companies HARMAN International (US), BOSE Profssional (US), Shure Inc. (US), SONY (Japan), and Sennheiser electronic (Germany).
Key Questions addressed in this report:
- What are the global trends in demand for the market?
- What are the upcoming technologies/product areas that will have a significant impact on the market in the future?
- What will be the revenue pockets for the market players in the next 6 years?
- What are the prime strategies followed by key players in the market?
 Exclusive indicates content/data unique to MarketsandMarkets and not available with any competitors.
Table of Contents
1 Introduction (Page No. - 15)
1.1 Study Objectives
1.2 Market Definition and Scope
1.3 Inclusions and Exclusions
1.4 Study Scope
1.4.1 Markets Covered
1.4.2 Geographic Scope
1.5 Years Considered
1.6 Currency
1.7 Stakeholders
2 Research Methodology (Page No. - 19)
2.1 Research Data
2.1.1 Secondary Data
2.1.1.1 Secondary Sources
2.1.2 Primary Data
2.1.2.1 Primary Sources
2.1.2.2 Key Industry Insights
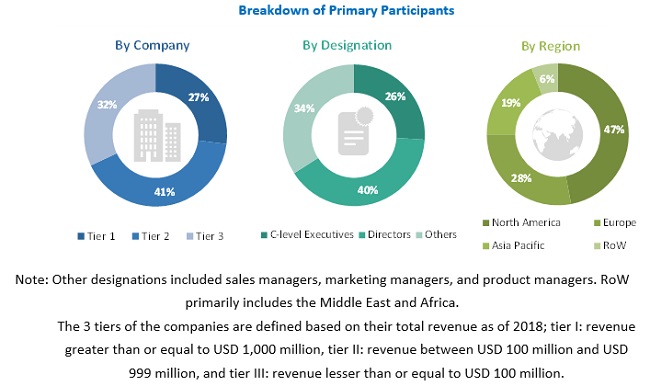
2.1.2.3 Breakdown of Primaries
2.2 Market Size Estimation
2.2.1 Bottom-Up Approach
2.2.2 Top-Down Approach
2.3 Market Breakdown and Data Triangulation
2.4 Research Assumptions
2.5 Study Limitations
3 Executive Summary (Page No. - 27)
4 Premium Insights (Page No. - 31)
4.1 Attractive Opportunities in Sound Reinforcement Market
4.2 Market for Professional Speaker, By End User (USD Million)
4.3 Sound Reinforcement for Corporate Sector, By Product (USD Million)
4.4 Sound Reinforcement, By Product Type
4.5 Sound Reinforcement Market in APAC
4.6 Market, By Geography
5 Market Overview (Page No. - 34)
5.1 Introduction
5.2 Market Dynamics
5.2.1 Drivers
5.2.1.1 Increasing Penetration of IoT in Professional AV Equipment Or AV Business
5.2.1.2 Increasing Demand From Corporate, Educational, and Government Sectors
5.2.2 Restraints
5.2.2.1 Compliance Issues in Operating Frequencies for Wireless Microphones
5.2.3 Opportunities
5.2.3.1 Increasing Number of Concerts and Live Performances
5.2.3.2 Increasing Number of Sports Events and Tournaments
5.2.4 Challengess
5.2.4.1 Issues in Delivering High-Quality Audio Due to Improper Placement of Wireless Sound Reinforcement Equipment
6 Market, By Product Type (Page No. - 39)
6.1 Introduction
6.2 Microphones
6.2.1 Increased Use of Sound Reinforcement Microphones in Sports Tournaments, Educational Institutes, and Corporate Setups
6.3 Professional Loudspeaker
6.3.1 Rising Demand for High-Quality Music, for Outdoor Events
6.4 Audio Mixer
6.4.1 Shift From Analog to Digital Technologies Augmenting the Growth of Audio Mixers
6.5 Power Amplifier
6.5.1 Increasing Use of Audio Power Amplifiers in Broadcasting Studios, Nightclubs, DJS, Theatres, and Concert Halls
6.6 Signal Processor
6.6.1 Rapid Increase in Demand for Wireless Audio Systems
6.7 Others
7 Market, By Format (Page No. - 48)
7.1 Introduction
7.2 Analog Audio
7.2.1 Microphones Expected to Grow at Highest CAGR for Analog Segment
7.3 Digital Audio
7.3.1 Growing Trend of Wireless Systems Drive Growth of Sound Reinforcement Market
8 Market, By End User (Page No. - 50)
8.1 Introduction
8.2 Corporate
8.2.1 Integration of IoT in Business Workflow Processes
8.3 Large Events & Venues
8.3.1 Increasing Number of Live Performances and Music Concerts
8.4 Educational Institutions
8.4.1 Increasing Trend of Smart Campuses
8.5 Government Offices
8.5.1 Growing Digitalism Worldwide Drives the Demand for Sound Reinforcement Systems.
8.6 Studio and Broadcasting
8.6.1 Rising Trend of Online Video Blogging and Live Broadcasting
8.7 Hospitality
8.7.1 Rapidly Changing Business Needs Allows Hotels Or Resorts to Accommodate Different Type of Events
8.8 Others
9 Geographic Analysis (Page No. - 67)
9.1 Introduction
9.2 North America
9.2.1 US
9.2.1.1 Strong Economic Condition in US Owing to Commercial Verticals
9.2.2 Canada
9.2.2.1 Strong Education Sector in Canada Contributes to Growth of Market
9.2.3 Mexico
9.2.3.1 High Presence of Electronic A/V Product Manufacturers Offer Growth Opportunities in Mexico
9.3 Europe
9.3.1 Germany
9.3.1.1 Germany’s Strong Corporate and Educational Industry Driving Overall Market
9.3.2 UK
9.3.2.1 Presence Educational Institutions Make UK A Hotbed for Adoption of Sound Reinforcement Systems
9.3.3 France
9.3.3.1 Robust Audio-Video Market Offers Significant Opportunities for Investment and Growth
9.3.4 Italy
9.3.4.1 Growing Sports and Entertainment Events
9.3.5 RoE
9.4 APAC
9.4.1 China
9.4.1.1 Growth of the Smart Office/Corporate Sector
9.4.2 Japan
9.4.2.1 Rapid Growth of Commercial Sector, Concerts, and Events
9.4.3 India
9.4.3.1 Government Initiatives for Promoting Smart Education and Learning
9.4.4 RoAPAC
9.5 RoW
9.5.1 Middle East & Africa
9.5.1.1 Rise in the Commercial Sector Such as Corporate Spaces and Hospitality Sector
9.5.2 South America
9.5.2.1 Increase in Industrialization and Influx of Professional Audio Electronics Providing Significant Growth Opportunities
10 Competitive Landscape (Page No. - 84)
10.1 Introduction
10.2 Market Ranking Analysis: Sound Reinforcement Market
10.3 Competitive Situations and Trends
10.3.1 Product Launches and Developments
10.3.2 Partnerships & Collaborations
10.3.3 Expansion
10.3.4 Acquisitions
10.4 Competitive Leadership Mapping
10.4.1 Visionary Leaders
10.4.2 Innovators
10.4.3 Dynamic Differentiators
10.4.4 Emerging Companies
11 Company Profiles (Page No. - 90)
11.1 Key Players
(Business Overview, Products Offered, Recent Developments, SWOT Analysis, and MnM View)*
11.1.1 Sennheiser
11.1.2 Sony
11.1.3 Bose
11.1.4 Harman
11.1.5 Yamaha
11.1.6 Audio-Technica
11.1.7 Shure
11.1.8 Music Tribe
11.1.9 Audix Microphones
11.1.10 Coda Audio
* Business Overview, Products Offered, Recent Developments, SWOT Analysis, and MnM View Might Not Be Captured in Case of Unlisted Companies.
11.2 Right-To-Win
11.3 Other Key Companies
11.3.1 Electro-Voice
11.3.2 Lewitt
11.3.3 Wharfedale Pro (Iag Group LTD.)
11.3.4 Dynaudio
11.3.5 Saramonic International
11.3.6 Samson Technologies
11.3.7 Beyerdynamic
11.3.8 Mipro Electronics
11.3.9 Yorkville Sound
11.3.10 Qsc, LLC
12 Appendix (Page No. - 122)
12.1 Insights of Industry Experts
12.2 Discussion Guide
12.3 Knowledge Store: Marketsandmarkets’ Subscription Portal
12.4 Available Customizations
12.5 Related Reports
12.6 Author Details
List of Tables (96 Tables)
Table 1 Sound Reinforcement Market, By Product Type, 2017–2024 (USD Million)
Table 2 Market for Microphones, By Format, 2017–2024 (USD Million)
Table 3 Market for Microphones, By End User, 2017–2024 (USD Million)
Table 4 Market for Microphones, By Region, 2017–2024 (USD Million)
Table 5 Market for Professional Speakers, By End User, 2017–2024 (USD Million)
Table 6 Market for Professional Speakers, By Format, 2017–2024 (USD Million)
Table 7 Market for Professional Speakers, By Region, 2017–2024 (USD Million)
Table 8 Market for Audio Sound Mixers, By Format, 2017–2024 (USD Million)
Table 9 Market for Audio Mixers, By End User, 2017–2024 (USD Million)
Table 10 Market for Audio Mixers, By Region, 2017–2024 (USD Million)
Table 11 Market for Power Amplifier, By Format, 2017–2024 (USD Million)
Table 12 Market for Power Amplifier, By End User, 2017–2024 (USD Million)
Table 13 Market for Power Amplifier, By Region, 2017–2024 (USD Million)
Table 14 Market for Audio Signal Processors, By Format, 2017–2024 (USD Million)
Table 15 Market for Audio Signal Processors, By Region, 2017–2024 (USD Million)
Table 16 Market for Audio Signal Processors, By End User, 2017–2024 (USD Million)
Table 17 Market for Others, By Format, 2017–2024 (USD Million)
Table 18 Market for Others, By End User, 2017–2024 (USD Million)
Table 19 Market for Others, By Region, 2017–2024 (USD Million)
Table 20 Market, By Format, 2017–2024 (USD Million)
Table 21 Analog Market, By Product Type, 2017–2024 (USD Million)
Table 22 Digital Market, By Product Type, 2017–2024 (USD Million)
Table 23 Market, By End User, 2017–2024 (USD Million)
Table 24 Market for Corporate, By Product Type, 2017–2024 (USD Million)
Table 25 Market for Corporate, By Region, 2017–2024 (USD Million)
Table 26 Market for Corporate, By North American Countries, 2017–2024 (USD Million)
Table 27 Market for Corporate, By European Countries, 2017–2024 (USD Million)
Table 28 Market for Corporate, By APAC Countries, 2017–2024 (USD Million)
Table 29 Market for Corporate, By RoW, 2017–2024 (USD Million)
Table 30 Market for Large Venues & Events, By Product Type, 2017–2024 (USD Million)
Table 31 Market for Large Venues & Events, By Region, 2017–2024 (USD Million)
Table 32 Market for Large Venues & Events, By North American Countries, 2017–2024 (USD Million)
Table 33 Market for Large Venues & Events, By European Countries, 2017–2024 (USD Million)
Table 34 Market for Large Venues & Events, By APAC Countries, 2017–2024 (USD Million)
Table 35 Market for Large Venues & Events, By RoW, 2017–2024 (USD Million)
Table 36 Market for Educational Institutions, By Product Type, 2017–2024 (USD Million)
Table 37 Market for Educational Institutions, By Region, 2017–2024 (USD Million)
Table 38 Market for Educational Institutions, By North American Countries, 2017–2024 (USD Million)
Table 39 Market for Educational Institutions, By European Countries, 2017–2024 (USD Million)
Table 40 Market for Educational Institutions, By APAC Countries, 2017–2024 (USD Million)
Table 41 Market for Educational Institutions, By RoW Region, 2017–2024 (USD Million)
Table 42 Market for Government, By Product Type, 2017–2024 (USD Million)
Table 43 Market for Government, By Region, 2017–2024 (USD Million)
Table 44 Market for Government, By North American Countries, 2017–2024 (USD Million)
Table 45 Market for Government, By European Countries, 2017–2024 (USD Million)
Table 46 Market for Government, By APAC Countries, 2017–2024 (USD Million)
Table 47 Market for Government, By RoW, 2017–2024 (USD Million)
Table 48 Market for Studio & Broadcasting, By Product Type, 2017–2024 (USD Million)
Table 49 Market for Studio & Broadcasting, By Region, 2017–2024 (USD Million)
Table 50 Market for Studio & Broadcasting, By North American Countries, 2017–2024 (USD Million)
Table 51 Market for Studio & Broadcasting, By European Countries, 2017–2024 (USD Million)
Table 52 Market for Studio & Broadcasting, By APAC Countries, 2017–2024 (USD Million)
Table 53 Market for Studio & Broadcasting, By RoW, 2017–2024 (USD Million)
Table 54 Market for Hospitality, By Product Type, 2017–2024 (USD Million)
Table 55 Market for Hospitality, By Region, 2017–2024 (USD Million)
Table 56 Market for Hospitality, By North American Countries, 2017–2024 (USD Million)
Table 57 Market for Hospitality, By European Countries, 2017–2024 (USD Million)
Table 58 Market for Hospitality, By APAC Countries, 2017–2024 (USD Million)
Table 59 Market for Hospitality, By RoW, 2017–2024 (USD Million)
Table 60 Market for Others, By Product Type, 2017–2024 (USD Million)
Table 61 Market for Others, By Region, 2017–2024 (USD Million)
Table 62 Market for Others, By North American Countries, 2017–2024 (USD Million)
Table 63 Market for Others, By European Countries, 2017–2024 (USD Million)
Table 64 Market for Others, By APAC Countries, 2017–2024 (USD Million)
Table 65 Market for Others, By RoW, 2017–2024 (USD Million)
Table 66 Market, By Region, 2017–2024 (USD Million)
Table 67 Market in North America, By Country, 2017–2024 (USD Million)
Table 68 Market in North America, By Product Type, 2017–2024 (USD Million)
Table 69 Market in North America, By End User, 2017–2024 (USD Million)
Table 70 Market in US, By End User, 2017–2024 (USD Million)
Table 71 Market in Canada, By End User, 2017–2024 (USD Million)
Table 72 Market in Mexico, By End User, 2017–2024 (USD Million)
Table 73 Market in Europe, By Country, 2017–2024 (USD Million)
Table 74 Market in Europe, By Product Type, 2017–2024 (USD Million)
Table 75 Market in Europe, By End User, 2017–2024 (USD Million)
Table 76 Market in Germany, By End User, 2017–2024 (USD Million)
Table 77 Market in UK, By End User, 2017–2024 (USD Million)
Table 78 Market in France, By End User, 2017–2024 (USD Million)
Table 79 Market in Italy, By End User, 2017–2024 (USD Million)
Table 80 Market in RoE, By End User, 2017–2024 (USD Million)
Table 81 Market in APAC, By Country, 2017–2024 (USD Million)
Table 82 Market in APAC, By Product Type, 2017–2024 (USD Million)
Table 83 Market in APAC, By End User, 2017–2024 (USD Million)
Table 84 Market in China, By End User, 2017–2024 (USD Million)
Table 85 Market in Japan, By End User, 2017–2024 (USD Million)
Table 86 Market in India, By End User, 2017–2024 (USD Million)
Table 87 Market in RoAPAC, By End User, 2017–2024 (USD Million)
Table 88 Market in RoW, By Region, 2017–2024 (USD Million)
Table 89 Market in RoW, By Product Type, 2017–2024 (USD Million)
Table 90 Market in RoW, By End User, 2017–2024 (USD Million)
Table 91 Market in Mea, By End User, 2017–2024 (USD Million)
Table 92 Market in South America, By End User, 2017–2024 (USD Million)
Table 93 Product Launches and Developments (2018–2019)
Table 94 Partnerships & Collaborations (2019)
Table 95 Expansions (2017–2019)
Table 96 Acquisitions (2018)
List of Figures (29 Figures)
Figure 1 Sound Reinforcement Market Segmentation
Figure 2 Market: Process Flow of Market Size Estimation
Figure 3 Market: Research Design
Figure 4 Data Triangulation Methodology
Figure 5 Market in Terms of Value (2017–2024)
Figure 6 Microphones Market to Grow at Highest CAGR From 2019 to 2024
Figure 7 Large Venues & Events to Hold Largest Size of Market During Forecast Period
Figure 8 Digital Segment to Witness Higher CAGR in Market, in Terms of Value, During Forecast Period
Figure 9 North America Held Largest Share in Market, in Terms of Value, in 2018
Figure 10 Market for Corporate to Grow at Highest CAGR From 2019 to 2024
Figure 11 Large Venues & Events to Record Largest Share of Professional Speaker Market During Forecast Period
Figure 12 Microphones to Grow at Highest CAGR for Corporate Sector During Forecast Period
Figure 13 Professional Speaker Holds Largest Share of Market, By 2024
Figure 14 China Expected to Hold Largest Shareholders of Market in APAC By 2024
Figure 15 US to Hold Largest Share of Market, By 2019
Figure 16 Market: Drivers, Restraints, Opportunities, and Challenges
Figure 17 Market Drivers and Their Impact
Figure 18 Market Restraints and Their Impact
Figure 19 Market Opportunities and Their Impact
Figure 20 Market Challengess and Their Impact
Figure 21 APAC to Witness Highest CAGR in Market During 2019–2024
Figure 22 North America: Market Snapshot
Figure 23 Europe: Market Snapshot
Figure 24 APAC: Market Snapshot
Figure 25 Key Growth Strategies Adopted By Top Companies, 2017–2019
Figure 26 Market Ranking of Top Players in Market, 2018
Figure 27 Market (Global) Competitive Leadership Mapping, 2018
Figure 28 Sony: Company Snapshot
Figure 29 Yamaha: Company Snapshot
The study involved the estimation of the current size of the sound reinforcement market. Exhaustive secondary research was conducted to collect information on the market, as well as its peer and parent markets. The next step involved the validation of these findings, assumptions, and sizing by the industry experts across the value chain through primary research. Both, top-down and bottom-up approaches were employed to estimate the overall size of the market. Thereafter, market breakdown and data triangulation were used to estimate the size of various segments and subsegments of the market.
Secondary Research
In the secondary research process, various secondary sources were referred to for identifying and collecting information important for this study on the sound reinforcement market. These secondary sources included the National Association of Music Merchants (NAMM); the Institute of Electrical and Electronics Engineers; the European Imaging and Sound Association (EISA); the Audio Engineering Society (AES); journals; press releases, and financials of companies; white papers, certified publications, and articles by recognized authors; directories; and databases.
Primary Research
In the primary research process, various primary sources from both supply and demand sides were interviewed to obtain qualitative and quantitative information important for this report. Primary sources from the supply side included industry experts such as chief executive officers (CEOs), vice presidents (VPs), marketing directors, technology and innovation directors, and related executives from key companies and organizations operating in the sound reinforcement market. After complete market engineering (including calculations regarding the market statistics, market breakdown, market size estimations, market forecasting, and data triangulation), extensive primary research was conducted to gather information as well as verify and validate the critical numbers that were obtained.
To know about the assumptions considered for the study, download the pdf brochure
Market Size Estimation
In the complete market engineering process, both top-down and bottom-up approaches were implemented, along with several data triangulation methods, to estimate and validate the size of the sound reinforcement market and other dependent markets and submarkets listed in this report.
- Key players in the markets were identified through extensive secondary research.
- The supply chain of the industry and the market size, in terms of value, were determined through primary and secondary research processes.
- All percentage shares, splits, and breakdowns were determined using secondary sources and verified through primary sources.
Data Triangulation
After arriving at the overall market size from the estimation process explained above, the overall market was split into several segments and subsegments. The market breakdown and data triangulation procedures were employed, wherever applicable, to complete the overall market engineering process and arrive at exact statistics for all segments and subsegments. The data was triangulated by studying various factors and trends related to different verticals, identified from both demand and supply sides. Along with this, the market size was validated using both top-down and bottom-up approaches.
Following are the major objectives of the study:
- To define, describe, and forecast the sound reinforcement market, in terms of value, based on product type, format, end user, and geography
- To forecast the market size, in terms of value for various segments with respect to 4 main regions, namely, North America, Europe, Asia Pacific (APAC), and the Rest of the World (RoW)
- To provide detailed information and analysis of major factors such as drivers, restraints, opportunities, and challenges influencing the growth of the market
- To strategically analyze the micromarkets with respect to individual growth trends, future prospects, and contributions to the overall market
- To provide a detailed overview of the value chain of the ecosystem of the sound reinforcement market
- To analyze opportunities in the market for stakeholders by identifying high-growth segments of the sound reinforcement market
- To strategically profile key players and comprehensively analyze their market position in terms of ranking and core competencies, along with detailed competitive landscape for the market leaders
- To analyze growth strategies such as product launches and developments, acquisitions, expansions, and agreements adopted by major players in the sound reinforcement market
Available Customizations
With the given market data, MarketsandMarkets offers customizations according to the specific requirements of companies. The following customization options are available for this report:
- Market size for 2021 and 2023 based on product type, format, end user, and geography
- Detailed analysis and profiling of additional market players (up to 5)


Growth opportunities and latent adjacency in Sound Reinforcement Market