Glass Fiber Reinforced Concrete (GFRC) Market by Process (Spray, Premix, and Hybrid), Application (Commercial construction, Residential Construction and Civil & Other Infrastructure Construction), and Region - Global Forecast to 2023


[110 Pages Report] Glass fiber reinforced concrete (GFRC or GRC) is a cement-based concrete material, which is reinforced with alkali-resistant glass fibers. GFRC can be formed into thin sectioned lightweight elements and used as a precast that can be customized into a multitude of finishes, textures, and shapes according to requirements. GFRC is characterized by properties such as corrosion, heat resistant, moldability, design flexibility, and ease of handling & installation, which results in low maintenance cost and long product life.
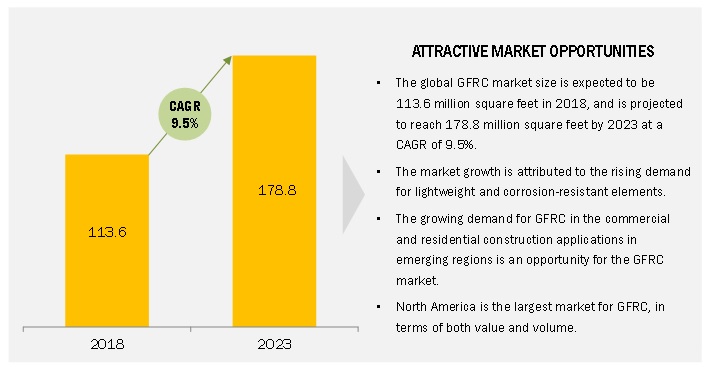
The GFRC market was valued at USD 1.83 billion in 2017 and is projected to reach USD 3.32 billion by 2023, at a CAGR of 10.5% during the forecast period. Additionally, the GFRC market was valued at 113.6 million square feet (MSF) in 2018 and is expected to reach 178.8 million square feet (MSF) by 2023 at a CAGR of 9.5%. Increasing demand for fire and weather-resistant fiber, design flexibility, dimensional stability, ease of handling, and rapid installation will drive the growth of the GFRC market during the forecast period. Increasing construction projects in developed and emerging economies are also contributing to the growth of the GFRC market on a global scale.
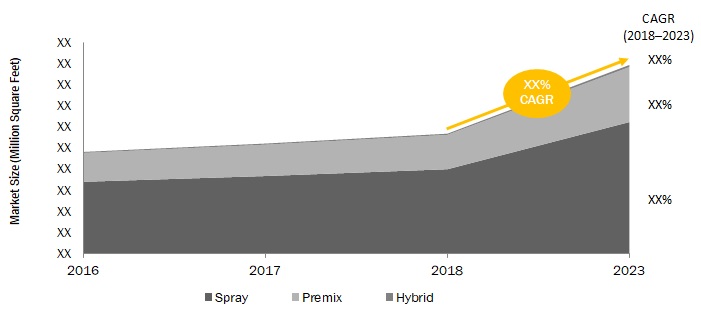
Spray process to lead the global glass fiber reinforced concrete market during the forecast period
Spray was the leading process for the GFRC market in 2017. Spray process is mainly used to produce elements such as cladding, rood facades, external facades, and wall panels. Commercial construction utilizes large volumes of these elements; hence, there is an increasing demand in the commercial construction application. Design flexibility, ease of handling, and rapid installation are some of the factors that are increasing the demand for spray-based GFRC in the commercial construction application.
Commercial construction application to drive the GFRC market during the forecast period
Commercial construction utilizes a large volume of GFRC in different forms, such as facades, columns and capitals, claddings, and wall panels. GFRC ensures a consistent finish, design flexibility, fire and weather resistance properties, and ease of handling, which results in its rapid installation, high aesthetic appeal, low maintenance, and long product life.
North America to dominate the GFRC market during the forecast period
North America and APAC are the leading markets for GFRC. The growing demand for lightweight precast elements with fire and weather resistance and rapid installation is increasing the demand for GFRC in these regions. GFRC has high demand in commercial construction, mainly due to its features such as design flexibility, aesthetic appeal, and long product life. With the increase in foreign direct investment (FDI) in the construction and infrastructure sectors, the demand for GFRC in emerging economies is projected to grow significantly.
Market Dynamics
Driver: Reduced construction time and cost
Precast concrete construction offers significantly reduced construction time. Reduction in time also results in a reduction of human labor, which leads to cost-saving. Precast components are produced in factories under a controlled environment, enabling easy adjustments and real-time monitoring. Unlike cast-in-situ construction, precast uses fewer resources such as cement, fiber reinforcement, water, energy, and human labor, thereby generating less waste in the factory and at the construction site. Precast construction allows parts of an entire building to be made even before the completion of the foundation for the same. Modular construction takes only four to eight weeks to be completed and assembled. At the same time, the conventional on-site constructed buildings require twice the time for the construction of a similar-sized structure. Improved quality and productivity, shortened construction time, and reduced waste generation makes this type of construction method cheaper, which makes it a preferable choice for end-users.
Restraint: Economic downturn in major regions on a global scale
The demand for precast building components is entirely dependent on the demand for new construction, which is directly related to the economic condition of any country or region as a whole. After the recession in the global financial market, the demand for new construction lost priority in regions such as Europe and North America. Unemployment and low disposable income radically affected the GDPs of the countries in these regions. In 2015, with the decline in GDPs, major European countries witnessed a deficiency in the number of infrastructural activities, and the demand for new construction was negligible. This affected the construction industry adversely, which, in turn, is expected to generate a negative impact on the GFRC market.
Opportunity: Rise in new construction projects in emerging economies such as China and India
Owing to their growing population, rapid urbanization, changing lifestyle, and industrialization. Developing regions such as APAC, Latin America, and the Middle East are emerging as the hotspots for the construction sector. Latin American countries such as Brazil, Argentina, and Colombia, as well as African countries such as South Africa, have witnessed rapid development in recent years. Due to an increase in the GDP of these countries, urbanization has mainly increased, presenting a substantial growth opportunity in the adoption of the precast concrete technique, which is a comparatively new concept in these countries. Therefore, the demand for GFRC in these countries is expected to grow considerably during the forecast period.
Challenge: High production and labor cost
GFRC is an expensive material, owing to its high production and labor costs. For large-scale consumption of GFRC, the prices are required to be reduced at an affordable level. This can be achieved by replacing expensive raw materials with economical options. Cost reduction can also be achieved through more automation in the production process and high production rate through advancement in technologies. The cost of GFRC can be lowered by more automation in the production process.
Scope of the Report
|
Report Metric |
Details |
|
Market size available for years |
2018�2023 |
|
Base year considered |
2017 |
|
Forecast period |
2018�2023 |
|
Forecast units |
USD Million (Value), Million Square Feet (Volume) |
|
Segments covered |
Process, Application, and Region |
|
Geographies covered |
North America, Asia Pacific, Europe, and Rest of the World. |
|
Companies covered |
This research report categorizes the GFRC market based on process, application, and region. It forecasts revenue growth and analyzes trends in each of these submarkets.
By Process:
- Spray
- Premix
- Hybrid
By Application:
- Commercial Construction
- Residential Construction
- Civil & Other Infrastructure Construction
By Region
- North America (US, Canada)
- Europe (Germany, UK, France, Spain, Italy, Switzerland, Sweden, RoE)
- Asia Pacific (APAC) (China, Japan, India, South Korea, Malaysia, Rest of APAC)
- The Middle East & Africa (MEA) (Saudi Arabia, South Africa, UAE, Rest of Middle East & Africa)
- Latin America (Argentina, Brazil, Mexico, Rest of Latin America)
Key Market Players
Ultratech Cement Ltd. (India), Formglas Products Ltd. (Canada), Willis Construction Co., Inc. (US), Clark Pacific (US), Loveld (Belgium)
Key Questions Addressed In This Report:
- What are the growth prospects of the GFRC market? What is the current scenario and how it is expected to grow in the future?
- What are the upcoming technologies/products that are expected to have a significant impact on the market in the future?
- What are the primary challenges in the GFRC market at a regional and global level?
- What are the key factors that are expected to drive the fastest-growing segment of the market in the next five years?
To speak to our analyst for a discussion on the above findings, click Speak to Analyst
 Exclusive indicates content/data unique to MarketsandMarkets and not available with any competitors.
Table of Contents
1 Introduction (Page No. - 15)
1.1 Objectives of the Study
1.2 Market Definition
1.3 Market Scope
1.3.1 Regional Segmentation
1.3.2 Years Considered for the Study
1.4 Currency
1.5 Unit Considered
1.6 Limitations
1.7 Stakeholders
2 Research Methodology (Page No. - 18)
2.1 Research Data
2.1.1 Secondary Data
2.1.1.1 Key Data From Secondary Sources
2.1.2 Primary Data
2.1.2.1 Key Data From Primary Sources
2.1.2.2 Key Industry Insights
2.1.2.3 Breakdown of Primary Interviews
2.2 Market Size Estimation
2.2.1 Bottom-Up Approach
2.2.2 Top-Down Approach
2.3 Data Triangulation
2.4 Assumptions
3 Executive Summary (Page No. - 26)
4 Premium Insights (Page No. - 29)
4.1 Attractive Opportunities in the GFRC Market
4.2 GFRC Market, By Process
4.3 GFRC Market, By Application and Region
4.4 GFRC Market, By Country
5 Market Overview (Page No. - 31)
5.1 Introduction
5.2 Market Dynamics
5.2.1 Drivers
5.2.1.1 Reduced Construction Time and Cost
5.2.1.2 Upsurge in Demand for Corrosion-Resistant Materials
5.2.2 Restraints
5.2.2.1 Economic Downturn in Major Regions
5.2.3 Opportunities
5.2.3.1 Rise in New Construction Projects in Emerging Economies Such as China and India
5.2.4 Challenges
5.2.4.1 High Production and Labor Cost
5.2.4.2 Lack of Awareness About Precast Concrete Method Among End Users
5.3 Porter�s Five Forces Analysis
5.3.1 Threat of New Entrants
5.3.2 Threat of Substitutes
5.3.3 Bargaining Power of Suppliers
5.3.4 Bargaining Power of Buyers
5.3.5 Intensity of Competitive Rivalry
6 Macroeconomic Overview and Key Trends (Page No. - 36)
6.1 Introduction
6.2 Trends and Forecast of GDP
6.3 Trends and Forecast of the Construction Industry
7 GFRC Market, By Process (Page No. - 42)
7.1 Introduction
7.2 Spray
7.3 Premix
7.4 Hybrid
8 GFRC Market, By Application (Page No. - 49)
8.1 Introduction
8.2 Commercial Construction
8.2.1 Institutions
8.2.2 Hospitals
8.2.3 Offices
8.2.4 Airports
8.2.5 Others
8.3 Residential Construction
8.4 Civil & Other Infrastructure Construction
8.4.1 Bridges/ Highways/ Tunnels/ Railways
8.4.2 Defense
9 GFRC Market, By Region (Page No. - 57)
9.1 Introduction
9.2 North America
9.2.1 By Application
9.2.2 By Process
9.2.3 By Country
9.2.3.1 US
9.2.3.1.1 By Application
9.2.3.2 Canada
9.2.3.2.1 By Application
9.3 Europe
9.3.1 By Application
9.3.2 By Process
9.3.3 By Country
9.3.3.1 France
9.3.3.1.1 By Application
9.3.3.2 Germany
9.3.3.2.1 By Application
9.3.3.3 Italy
9.3.3.3.1 By Application
9.3.3.4 Spain
9.3.3.4.1 By Application
9.3.3.5 Switzerland
9.3.3.5.1 By Application
9.3.3.6 Sweden
9.3.3.6.1 By Application
9.3.3.7 UK
9.3.3.7.1 By Application
9.3.3.8 Rest of Europe
9.3.3.8.1 By Application
9.4 APAC
9.4.1 By Application
9.4.2 By Process
9.4.3 By Country
9.4.3.1 China
9.4.3.1.1 By Application
9.4.3.2 Japan
9.4.3.2.1 By Application
9.4.3.3 India
9.4.3.3.1 By Application
9.4.3.4 South Korea
9.4.3.4.1 By Application
9.4.3.5 Malaysia
9.4.3.5.1 By Application
9.4.3.6 Rest of APAC
9.4.3.6.1 By Application
9.5 Middle East & Africa
9.5.1 By Application
9.5.2 By Process
9.5.3 By Country
9.5.3.1 Saudi Arabia
9.5.3.1.1 By Application
9.5.3.2 UAE
9.5.3.2.1 By Application
9.5.3.3 South Africa
9.5.3.3.1 By Application
9.5.3.4 Rest of Middle East & Africa
9.5.3.4.1 By Application
9.6 Latin America
9.6.1 By Application
9.6.2 By Process
9.6.3 By Country
9.6.3.1 Brazil
9.6.3.1.1 By Application
9.6.3.2 Mexico
9.6.3.2.1 By Application
9.6.3.3 Argentina
9.6.3.3.1 By Application
9.6.3.4 Rest of Latin America
9.6.3.4.1 By Application
10 Company Profiles (Page No. - 92)
(Business Overview, Products Offered, SWOT Analysis, and MnM View)*
10.1 Ultratech Cement Ltd.
10.2 Formglas Products Ltd.
10.3 Willis Construction Co. Inc.
10.4 Clark Pacific
10.5 Loveld
10.6 Fibrex
10.7 Betofiber A.S.
10.8 Stromberg Architectural
10.9 Bb Fiberbeton
10.10 Nanjing Beilida New Material System Engineering Co., Ltd.
10.11 Other Players
10.11.1 Generale Prefabbricati S.P.A.
10.11.2 Bcm Grc Limited
10.11.3 Arabian Tile Company Ltd.
10.11.4 Quattro Design Solutions
10.11.5 Glass Reinforced Concrete UK Ltd
*Details on Business Overview, Products Offered, SWOT Analysis, and MnM View Might Not Be Captured in Case of Unlisted Companies.
11 Appendix (Page No. - 104)
11.1 Discussion Guide
11.2 Introducing RT: Real-Time Market Intelligence
11.3 Knowledge Store: Marketsandmarkets� Subscription Portal
11.4 Available Customizations
11.5 Related Reports
11.6 Author Details
List of Tables (102 Tables)
Table 1 Trends and Forecast of GDP, 2018�2023 (USD Billion)
Table 2 Contribution of the Construction Industry in North America, 2015�2022 (USD Billion)
Table 3 Contribution of the Construction Industry in Europe, 2015�2022 (USD Billion)
Table 4 Contribution of the Construction Industry in APAC, 2015�2022 (USD Billion)
Table 5 Contribution of the Construction Industry in the Middle East, 2015�2022 (USD Billion)
Table 6 Contribution of the Construction Industry in Latin America, 2015�2022 (USD Billion)
Table 7 GFRC Market Size, By Process, 2016�2023 (Million Square Feet)
Table 8 GFRC Market Size, By Process, 2016�2023 (USD Million)
Table 9 Spray-Based GFRC Market Size, By Region, 2016�2023 (Million Square Feet )
Table 10 Spray-Based GFRC Market Size, By Region, 2016�2023 (USD Million)
Table 11 Premix-Based GFRC Market Size, By Region, 2016�2023 (Million Square Feet)
Table 12 Premix-Based GFRC Market Size, By Region , 2016�2023 (USD Million)
Table 13 Hybrid-Based GFRC Market Size, By Region, 2016�2023 (Million Square Feet)
Table 14 Hybrid-Based GFRC Market Size, By Region, 2016�2023 (USD Million)
Table 15 GFRC Market Size, By Application, 2016�2023 (Million Square Feet)
Table 16 GFRC Market Size, By Application, 2016�2023 (USD Million)
Table 17 GFRC Market Size in Commercial Construction, By Region, 2016�2023 (Million Square Feet)
Table 18 GFRC Market Size in Commercial Construction, By Region, 2016�2023 (USD Million)
Table 19 GFRC Market Size in Residential Construction, By Region, 2016�2023 (Million Square Feet)
Table 20 GFRC Market Size in Residential Construction, By Region, 2016�2023 (USD Million)
Table 21 GFRC Market Size in Civil & Other Infrastructure Construction, By Region, 2016�2023 (Million Square Feet)
Table 22 GFRC Market Size in Civil & Other Infrastructure Construction, By Region, 2016�2023 (USD Million)
Table 23 GFRC Market Size, By Region, 2016�2023 (Million Square Feet)
Table 24 GFRC Market Size, By Region, 2016�2023 (USD Million)
Table 25 North America: GFRC Market Size, By Application, 2016�2023 (Million Square Feet)
Table 26 North America: GFRC Market Size, By Application, 2016�2023 (USD Million)
Table 27 North America: GFRC Market Size, By Process, 2016�2023 (Million Square Feet)
Table 28 North America: GFRC Market Size, By Process, 2016�2023 (USD Million)
Table 29 North America: GFRC Market Size, By Country, 2016�2023 (Million Square Feet)
Table 30 North America: GFRC Market Size, By Country, 2016�2023 (USD Million)
Table 31 US: GFRC Market Size, By Application, 2016�2023 (Million Square Feet)
Table 32 US: GFRC Market Size, By Application, 2016�2023 (USD Million)
Table 33 Canada: GFRC Market Size, By Application, 2016�2023 (Million Square Feet)
Table 34 Canada: GFRC Market Size, By Application, 2016�2023 (USD Million)
Table 35 Europe: GFRC Market Size, By Application, 2016�2023 (Million Square Feet)
Table 36 Europe: GFRC Market Size, By Application, 2016�2023 (USD Million)
Table 37 Europe: GFRC Market Size, By Process, 2016�2023 (Million Square Feet)
Table 38 Europe: GFRC Market Size, By Process, 2016�2023 (USD Million)
Table 39 Europe: GFRC Market Size, By Country, 2016�2023 (Million Square Feet)
Table 40 Europe: GFRC Market Size, By Country, 2016�2023 (USD Million)
Table 41 France: GFRC Market Size, By Application, 2016�2023 (Million Square Feet)
Table 42 France: GFRC Market Size, By Application, 2016�2023 (USD Million)
Table 43 Germany: GFRC Market Size, By Application, 2016�2023 (Million Square Feet)
Table 44 Germany: GFRC Market Size, By Application, 2016�2023 (USD Million)
Table 45 Italy: GFRC Market Size, By Application, 2016�2023 (Million Square Feet)
Table 46 Italy: GFRC Market Size, By Application, 2016�2023 (USD Million)
Table 47 Spain: GFRC Market Size, By Application, 2016�2023 (Million Square Feet)
Table 48 Spain: GFRC Market Size, By Application, 2016�2023 (USD Million)
Table 49 Switzerland: GFRC Market Size, By Application, 2016�2023 (Million Square Feet)
Table 50 Switzerland: GFRC Market Size, By Application, 2016�2023 (USD Million)
Table 51 Sweden: GFRC Market Size, By Application, 2016�2023 (Million Square Feet)
Table 52 Sweden: GFRC Market Size, By Application, 2016�2023 (USD Million)
Table 53 UK: GFRC Market Size, By Application, 2016�2023 (Million Square Feet)
Table 54 UK: GFRC Market Size, By Application, 2016�2023 (USD Million)
Table 55 Rest of Europe: GFRC Market Size, By Application, 2016�2023 (Million Square Feet)
Table 56 Rest of Europe: GFRC Market Size, By Application, 2016�2023 (USD Million)
Table 57 APAC: GFRC Market Size, By Application, 2016�2023 (Million Square Feet)
Table 58 APAC: GFRC Market Size, By Application, 2016�2023 (USD Million)
Table 59 APAC: GFRC Market Size, By Process, 2016�2023 (Million Square Feet)
Table 60 APAC: GFRC Market Size, By Process, 2016�2023 (USD Million)
Table 61 APAC: GFRC Market Size, By Country, 2016�2023 (Million Square Feet)
Table 62 APAC: GFRC Market Size, By Country, 2016�2023 (USD Million)
Table 63 China: GFRC Market Size, By Application, 2016�2023 (Million Square Feet)
Table 64 China: GFRC Market Size, By Application, 2016�2023 (USD Million)
Table 65 Japan: GFRC Market Size, By Application, 2016�2023 (Million Square Feet)
Table 66 Japan: GFRC Market Size, By Application, 2016�2023 (USD Million)
Table 67 India: GFRC Market Size, By Application, 2016�2023 (Million Square Feet)
Table 68 India: GFRC Market Size, By Application, 2016�2023 (USD Million)
Table 69 South Korea: GFRC Market Size, By Application, 2016�2023 (Million Square Feet)
Table 70 South Korea: GFRC Market Size, By Application, 2016�2023 (USD Million)
Table 71 Malaysia: GFRC Market Size, By Application, 2016�2023 (Million Square Feet)
Table 72 Malaysia: GFRC Market Size, By Application, 2016�2023 (USD Million)
Table 73 Rest of APAC: GFRC Market Size, By Application, 2016�2023 (Million Square Feet)
Table 74 Rest of APAC: GFRC Market Size, By Application, 2016�2023 (USD Million)
Table 75 Middle East & Africa: GFRC Market Size, By Application, 2016�2023 (Million Square Feet)
Table 76 Middle East & Africa: GFRC Market Size, By Application, 2016�2023 (USD Million)
Table 77 Middle East & Africa: GFRC Market Size, By Process, 2016�2023 (Million Square Feet)
Table 78 Middle East & Africa: GFRC Market Size, By Process, 2016�2023 (USD Million)
Table 79 Middle East & Africa: GFRC Market Size, By Country, 2016�2023 (Million Square Feet)
Table 80 Middle East & Africa: GFRC Market Size, By Country, 2016�2023 (USD Million)
Table 81 Saudi Arabia: GFRC Market Size, By Application, 2016�2023 (Million Square Feet)
Table 82 Saudi Arabia: GFRC Market Size, By Application, 2016�2023 (USD Million)
Table 83 UAE: GFRC Market Size, By Application, 2016�2023 (Million Square Feet)
Table 84 UAE: GFRC Market Size, By Application, 2016�2023 (USD Million)
Table 85 South Africa: GFRC Market Size, By Application, 2016�2023 (Million Square Feet)
Table 86 South Africa: GFRC Market Size, By Application, 2016�2023 (USD Million)
Table 87 Rest of Middle East & Africa: GFRC Market Size, By Application, 2016�2023 (Million Square Feet)
Table 88 Rest of Middle East & Africa: GFRC Market Size, By Application, 2016�2023 (USD Million)
Table 89 Latin America: GFRC Market Size, By Application, 2016�2023 (Million Square Feet)
Table 90 Latin America: GFRC Market Size, By Application, 2016�2023 (USD Million)
Table 91 Latin America: GFRC Market Size, By Process, 2016�2023 (Million Square Feet)
Table 92 Latin America: GFRC Market Size, By Process, 2016�2023 (USD Million)
Table 93 Latin America: GFRC Market Size, By Country, 2016�2023 (Million Square Feet)
Table 94 Latin America: GFRC Market Size, By Country, 2016�2023 (USD Million)
Table 95 Brazil: GFRC Market Size, By Application, 2016�2023 (Million Square Feet)
Table 96 Brazil: GFRC Market Size, By Application, 2016�2023 (USD Million)
Table 97 Mexico: GFRC Market Size, By Application, 2016�2023 (Million Square Feet)
Table 98 Mexico: GFRC Market Size, By Application, 2016�2023 (USD Million)
Table 99 Argentina: GFRC Market Size, By Application, 2016�2023 (Million Square Feet)
Table 100 Argentina: GFRC Market Size, By Application, 2016�2023 (USD Million)
Table 101 Rest of Latin America: GFRC Market Size, By Application, 2016�2023 (Million Square Feet)
Table 102 Rest of Latin America: GFRC Market Size, By Application, 2016�2023 (USD Million)
List of Figures (34 Figures)
Figure 1 GFRC Market Segmentation
Figure 2 GFRC Market: Research Design
Figure 3 Bottom-Up Approach
Figure 4 Top-Down Approach
Figure 5 GFRC Market: Data Triangulation
Figure 6 Spray Process to Lead the GFRC Market
Figure 7 Commercial Construction Application to Drive the GFRC Market
Figure 8 North America Led the GFRC Market in 2017
Figure 9 Growth Opportunities in the GFRC Market Between 2018 and 2023
Figure 10 Spray-Based GFRC to Lead the Market
Figure 11 APAC Led the GFRC Market
Figure 12 China to Register the Highest CAGR
Figure 13 Factors Governing the GFRC Market
Figure 14 GFRC Market: Porter�s Five Forces Analysis
Figure 15 Contribution of the Construction Industry in North America, 2017 vs 2022 (USD Billion)
Figure 16 Contribution of the Construction Industry in Europe, 2017 vs 2022 (USD Billion)
Figure 17 Contribution of the Construction Industry in APAC, 2017 vs 2022 (USD Billion)
Figure 18 Contribution of the Construction Industry in the Middle East, 017 vs 2022 (USD Billion)
Figure 19 Contribution of the Construction Industry in Latin America, 2017 vs 2022 (USD Billion)
Figure 20 Spray to Be the Leading Process for GFRC
Figure 21 North America to Be the Leading Spray-Based GFRC Market
Figure 22 North America to Be the Leading Premix-Based GFRC Market
Figure 23 North America to Be the Leading Hybrid-Based GFRC Market
Figure 24 Commercial Construction to Be the Leading Application of GFRC
Figure 25 North American GFRC Market to Contribute the Largest Share in Commercial Construction Application
Figure 26 North American GFRC Market to Contribute the Largest Share in Residential Construction Application
Figure 27 APAC to Be the Fastest-Growing GFRC Market in Civil & Other Infrastructure Construction Application
Figure 28 Regional Snapshot: GFRC Market
Figure 29 North America: GFRC Market Snapshot
Figure 30 Europe: GFRC Market Snapshot
Figure 31 APAC: GFRC Market Snapshot
Figure 32 Saudi Arabia to Be the Largest GFRC Market in Middle East & Africa
Figure 33 Brazil is the Largest GFRC Market in Latin America
Figure 34 Ultratech Cement Limited: Company Snapshot


Growth opportunities and latent adjacency in Glass Fiber Reinforced Concrete (GFRC) Market