Space Launch Services Market

Space Launch Services Market by Service Type (Pre-launch, Post Launch), Payload (Satellite, Human Spacecraft, Cargo, and Space Probes), End User (Commercial, Military and Government), Orbit, Launch Vehicle, Launch type and Region - Global Forecast to 2027

Report Code: AS 5800 Aug, 2022, by marketsandmarkets.com

The Space Launch Services Market size is projected to reach USD 29.6 billion by 2027, at a CAGR of 15.1% during the forecast period.

The growth of Space Launch Services Industry can be attributed to the increasing demand for payload launches from various end users, including commercial and government sectors, military organizations, space agencies, defense organizations, satellite operators, and private companies.
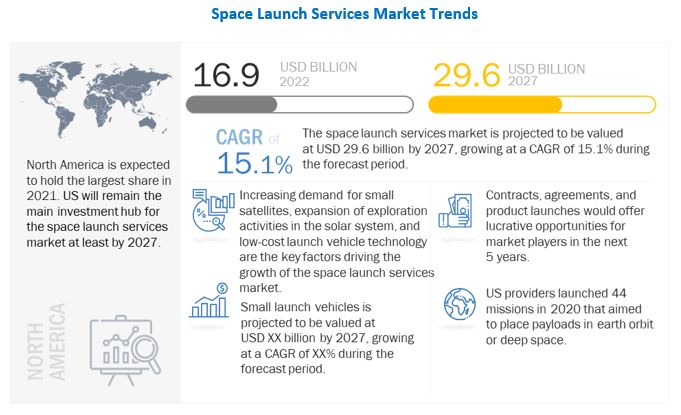
Space Launch Services Market

To know about the assumptions considered for the study, Request for Free Sample Report

Covid-19 Impact on Space launch services Market

The COVID-19 pandemic has caused a large-scale impact on economies across the world. The global manufacturing of space launch vehicles, components, and assembly lines have been impacted. COVID-19 has led to several challenges for many industries. The Aerospace & defense industry is no exception to that. The budget allotted to the defense sector has been reduced by several countries due to the COVID-19 pandemic. This puts most research projects on hold. The export of space launch services to several countries in the Middle East, Africa, and Latin America has also been reduced. All these scenarios affect the development of space launch services.

Space launch services Market Segment Overview

Military and Government segment of the Space Launch Services Market by End user, to grow at highest CAGR during the forecast period

The Military and Government segment is projected to be USD 24,139 million by 2027, at a higher CAGR of 15.1% during the forecast period. The trend of miniaturization of technologies and increasing capabilities of small satellites propel the demand for space launch services.

Small lift launch segment to command the Space Launch Services Market by launch vehicle, during the forecast period

The small lift launch vehicles (<350,000 KG) segment is expected to reach USD 19,672 million by 2027 at a CAGR of 14.6% from 2022 to 2027. The small lift launch vehicles segment is witnessing high growth, owing to an increase in deployment of small satellites and cube satellites for commercial end users and increasing demand for small satellite constellations.

The North America market is projected to contribute the largest share from 2022 to 2027
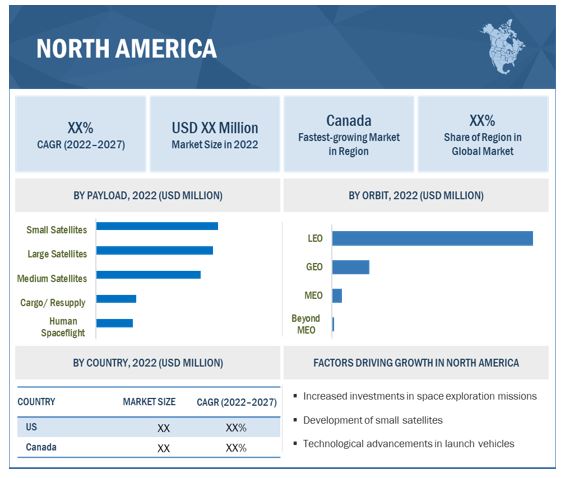
Space Launch Services Market by Region

To know about the assumptions considered for the study, download the pdf brochure

Launcher Recoverability

Launcher recoverability technology refers to the utilization of the partial recoverable lower stages of the launch vehicle and is developing further.

The technology is in the design, development, and testing stage, and after overcoming reliability issues, it is expected to increase launcher reliability and reduce launch costs in the long term. The recovered hardware parts of launch vehicles can be damaged while falling back into the sea and are required to be rectified before the launch vehicle can be used again. Also, the hardware to be reused needs to undergo stricter quality control measures compared to conventional disposable launcher systems.

Top 5 Key Players in Space launch services Companies

  • Space X (US),
  • Arianespace (France),
  • Northrop Grumman Corp. (US),
  • United Launch Alliance (US),
  • Rocket Lab (US) and
  • China Aerospace Science and Technology Corporation (China)

Space launch services Market Scope

Report Metric

Details

Estimated Market Size USD 16.9 billion
Projected Market Size USD 29.6 billion
Growth Rate 15.1%

Market size available for years

2018–2027

Base year considered

2021

Forecast period

2022-2027

Forecast units

Value (USD Billion)

Segments covered

By service type, By payload, By orbit, By launch vehicle type, By launch type, and By end use

Geographies covered

North America, Europe, Asia Pacific, and Rest of the World

Companies covered

SpaceX (US), Arianespace (France),  China Aerospace Science and Technology Corporation (China), United Launch  Alliance (US), Northrop Grumman Corporation (US)

Space launch services Market Dynamics

Driver: Increased deployment of small satellites

Over the past few years, space companies have started production of low-cost small/miniaturized satellites, which enable them to provide services equivalent to major companies that conventionally serve government agencies or public sector industries.

One of the factors responsible for the growth of the satellite industry is the increase in the adoption of small satellites for applications such as Earth observation, communication, and scientific research and the increasing focus on reducing total mission costs.

As launch service providers decide the cost of launch based on the weight of the spacecraft, spacecraft manufacturers are focused on miniaturizing the size of satellites. Small satellites tend to cost less, especially in cases where mission payloads have fewer demanding requirements, which enables a reduction in the size of the launch vehicle and thus the fuel need. In addition, technological advancements, such as reusable launch vehicles designed by SpaceX (US), are expected to further enhance the capabilities of satellites at a significantly lower cost. As satellite launch costs decline, the number of satellite launches is expected to increase.

Restraint : Lack of dedicated launch vehicles

Small satellites are carried as secondary payloads and do not have dedicated launch vehicles. Furthermore, as secondary payloads, small satellite missions are restricted by the lack of control of the launch schedule and destination orbit of the vehicle.

This is due to constraints on the volume and pressure of the stored propellant, primarily for the protection of the primary payload, and the requirement of antenna systems for primary payloads, which may restrict the launch of small satellite payloads in more suitable or favorable mission orbits. Moreover, the primary payload may need a pre-programmed orbital velocity and be placed in a specified orbit, limiting launch windows for small satellite missions. This also limits the fulfillment of the mission requirement for small satellites in some applications.

Therefore, the potential use of small satellites in various applications is dependent on the availability of reliable launch vehicles with a requisite range of performance capabilities. However, current launch vehicle performance capabilities do not effectively span the range of potential payloads.

Opportunity: Technological upgrades in space industry

The high development cost of satellites and other spacecraft has always been a major hindrance to the growth of the space industry. Due to technologies, such as the miniaturization of satellites and payloads, manufacturers seek to leverage cost reduction while performing key operations in the value chain.

Defense domains across the globe are also seeking less expensive multifunctional spacecraft. Recoverable launch vehicles are another technology that is a major opportunity for the space industry. Such technologies have made launches easier and cheaper, driving the growth of the space launch services market.

Challenges: Scarce intellectual assets 

The tremendous success of recent space exploration missions by space agencies in the Asia Pacific, such as the Indian Space and Research Organization (ISRO) and the China National Space Administration (CNSA), can be attributed to a large number of qualified scientists and personnel with relevant key skills in the region. Critical space operations rely heavily on intellectual assets, incorporating research & development, patents, software, human resources, and new organizational structures. These assets are strategic factors in value creation for firms.

However, the expansion of the services sector, globalization, deregulation, and the emergence of new information and communication technologies has resulted in the scarcity of intellectual assets across the globe. Countries such as Morocco, South Africa, Nigeria, Somalia, Kenya, Bangladesh, Nepal, and Bhutan, among others, have scarce intellectual assets in terms of qualified personnel for space exploration programs. This has resulted in a lack of space exploration programs in these countries, limiting the growth of the space launch services market.

Space launch services Market Segment Categorization

The study categorizes the space launch services market based on Application, Mobility, Size, Mode of Operation, System, and Region.

Based on Service Type, the space launch services market has been segmented as follows:

  • Pre-launch
  • Post launch

Based on Payloaad, the space launch services market has been segmented as follows:

  • Satellite
  • Stratolite
  • Cargo
  • Human Spaceflights
  • Space Probes

Based on the Orbit, the space launch services market has been segmented as follows:

  • LEO
  • MEO
  • GEO
  • Beyond GEO

Based on the Launch Vehicle Type, space launch services market has been segmented as follows:

  • Small-lift Launch Vehicle
  • Medium to Heavy Launch Vehicle

Based on the Launch Type, space launch services market has been segmented as follows:

  • Re-usable
  • Single Use

Based on the End Use, space launch services market has been segmented as follows:

  • Commercial
  • Military

Based on the region, space launch services market has been segmented as follows:

  • North America
  • Europe
  • Asia Pacific
  • Rest of the World (RoW)

Rest of the World includes Latin America, and Africa

Recent Developments

  • In March 2022, Rocket Lab (US) has successfully deployed a second Synthetic Aperture Radar (SAR) satellite to orbit for data and solutions provider Synspective, bringing the total number of satellites deployed by Rocket Lab to 110. In January 2018, Rocket Lab (USA) has launched Electron rocket into space under USD 5 million.
  • NASA is working with the private sector on its Artemis program, which intends to land people on the moon by 2024. The human landers for the mission will be created by SpaceX, Blue Origin, and Dynetics (US), according to a NASA announcement made in April 2020.

Frequently Asked Questions (FAQ):

To speak to our analyst for a discussion on the above findings, click Speak to Analyst


TABLE OF CONTENTS
 
1 INTRODUCTION (Page No. - 29)
    1.1 STUDY OBJECTIVES
    1.2 MARKET DEFINITION
    1.3 STUDY SCOPE
           1.3.1 MARKET SEGMENTATION
                    FIGURE 1 MARKET SEGMENTATION
           1.3.2 REGIONAL SCOPE
           1.3.3 YEARS CONSIDERED
    1.4 INCLUSIONS AND EXCLUSIONS
    1.5 CURRENCY
    1.6 USD EXCHANGE RATES
    1.7 LIMITATIONS
    1.8 STAKEHOLDERS
    1.9 SUMMARY OF CHANGES
 
2 RESEARCH METHODOLOGY (Page No. - 34)
    2.1 RESEARCH DATA
           FIGURE 2 RESEARCH FLOW
           FIGURE 3 RESEARCH DESIGN
           2.1.1 SECONDARY DATA
                    2.1.1.1 Secondary sources
           2.1.2 PRIMARY DATA
                    2.1.2.1 Key data from primary source
           2.1.3 KEY PRIMARY SOURCES
                    2.1.3.1 Breakdown of primaries
                               FIGURE 4 BREAKDOWN OF PRIMARY INTERVIEWS: BY COMPANY TYPE, DESIGNATION, AND REGION
    2.2 DEMAND- AND SUPPLY-SIDE ANALYSIS
           2.2.1 DEMAND-SIDE INDICATORS
                    2.2.1.1 Growing demand for commercial NGSO launches
                               FIGURE 5 SATELLITES LAUNCHED, BY ORBIT (2020-2021)
                    2.2.1.2 Rising demand for EO and telecommunication applications
                               FIGURE 6 SATELLITE ORBITAL LAUNCHES, BY COUNTRY, IN UNITS (2017–2027)
           2.2.2 SUPPLY-SIDE INDICATORS
                    2.2.2.1 Advancements in RLV technology
    2.3 MARKET SIZE ESTIMATION
           2.3.1 BOTTOM-UP APPROACH
                    FIGURE 7 MARKET SIZE ESTIMATION METHODOLOGY: BOTTOM-UP APPROACH
                    2.3.1.1 Market size estimation and methodology
                               TABLE 1 MARKET SIZE ESTIMATION METHODOLOGY: BOTTOM-UP APPROACH
                    2.3.1.2 Regional split of market
           2.3.2 TOP-DOWN APPROACH
                    FIGURE 8 MARKET SIZE ESTIMATION METHODOLOGY: TOP-DOWN APPROACH
    2.4 MARKET BREAKDOWN AND DATA TRIANGULATION
           FIGURE 9 DATA TRIANGULATION
    2.5 RESEARCH ASSUMPTIONS
    2.6 GROWTH RATE ASSUMPTIONS
    2.7 RISKS
 
3 EXECUTIVE SUMMARY (Page No. - 44)
    FIGURE 10 SPACE LAUNCH SERVICES MARKET, BY PAYLOAD, 2022 VS. 2027 (USD BILLION) 36
    FIGURE 11 MARKET, BY GOVERNMENT END USE, 2022 VS. 2027(USD BILLION)
    FIGURE 12 MARKET, BY REGION, 2022 VS. 2027 (USD BILLION) 37
 
4 PREMIUM INSIGHTS (Page No. - 47)
    4.1 ATTRACTIVE OPPORTUNITIES IN MARKET, 2022–2027
           FIGURE 13 RISING DEPLOYMENT OF SMALL SATELLITES AND SIGNIFICANT INVESTMENT BY VENTURE COMPANIES FOR SPACE EXPLORATION MISSIONS
    4.2 SPACE LAUNCH SERVICES MARKET, BY END USER
           FIGURE 14 GOVERNMENT SEGMENT TO LEAD MARKET DURING FORECAST PERIOD
    4.3 MARKET, BY LAUNCH TYPE
           FIGURE 15 REUSABLE SEGMENT TO COMMAND HIGHEST GROWTH DURING FORECAST PERIOD
    4.4 MARKET, BY SATELLITE
           FIGURE 16 SMALL SATELLITES TO BE DOMINANT DURING FORECAST PERIOD
    4.5 MARKET, BY COUNTRY
           FIGURE 17 UK ESTIMATED TO HAVE HIGHEST CAGR IN MARKET DURING 2022–2027
 
5 MARKET OVERVIEW (Page No. - 50)
    5.1 INTRODUCTION
    5.2 MARKET DYNAMICS
           FIGURE 18 MARKET: DRIVERS, RESTRAINTS, OPPORTUNITIES, AND CHALLENGES
           5.2.1 DRIVERS
                    5.2.1.1 Increased deployment of small satellites
                               TABLE 2 KEY INFORMATION ON LEO AND MEO CONSTELLATIONS (OPERATIONAL)
                               TABLE 3 KEY INFORMATION ON LEO AND MEO CONSTELLATIONS (DEVELOPMENT)
                    5.2.1.2 Investments by venture companies
                               TABLE 4 GLOBAL TOP VC INVESTORS IN SPACE TECHNOLOGY SINCE 2010
                               FIGURE 19 VENTURE CAPITAL INVESTMENTS IN SPACE INDUSTRY, 2010
                    5.2.1.3 Focus on reducing mission costs
                    5.2.1.4 Increased demand for space tourism
                               FIGURE 20 GLOBAL REVENUE OF SPACE TRAVEL AND TOURISM, (2021–2030)
           5.2.2 RESTRAINTS
                    5.2.2.1 Lack of dedicated launch vehicles
                    5.2.2.2 Lack of measures for disposal of orbital debris
           5.2.3 OPPORTUNITIES
                    5.2.3.1 Technological upgrades in space industry
                    5.2.3.2 Government investments in space technology
           5.2.4 CHALLENGES
                    5.2.4.1 Scarce intellectual assets
                    5.2.4.2 Emissions due to space missions
                    5.2.4.3 Concerns over space debris
    5.3 AVERAGE SELLING PRICE
           TABLE 5 SPACE LAUNCH SERVICES: AVERAGE LAUNCH COST
    5.4 VALUE CHAIN ANALYSIS
           FIGURE 21 VALUE CHAIN ANALYSIS
           5.4.1 UPSTREAM PLAYERS
           5.4.2 MANUFACTURERS
           5.4.3 LAUNCH SERVICE PROVIDERS
           5.4.4 DOWNSTREAM PLAYERS
           5.4.5 GOVERNMENT AGENCIES
           5.4.6 SATELLITE OPERATORS
    5.5 MARKET ECOSYSTEM MAP
           FIGURE 22 MARKET ECOSYSTEM
           5.5.1 PROMINENT COMPANIES
           5.5.2 PRIVATE AND SMALL ENTERPRISES
           5.5.3 END USERS
    5.6 TRENDS/DISRUPTIONS IMPACTING CUSTOMER BUSINESSES
           FIGURE 23 REVENUE SHIFT AND NEW REVENUE POCKETS FOR SATELLITE SYSTEM MANUFACTURERS
    5.7 OPERATIONAL DATA
           TABLE 6 GLOBAL SMALL SATELLITE LAUNCH VOLUME, BY MASS, 2018–2021
           TABLE 7 ORBITAL LAUNCHES, BY COUNTRY, 2017–2022
    5.8 PORTER’S FIVE FORCES ANALYSIS FOR SATELLITE LAUNCH SERVICES MARKET
           FIGURE 24 MARKET: PORTER’S FIVE FORCE ANALYSIS
           5.8.1 MARKET: PORTER’S FIVE FORCE ANALYSIS
           5.8.2 THREATS OF NEW ENTRANTS
           5.8.3 THREAT OF SUBSTITUTES
           5.8.4 BARGAINING POWERS OF SUPPLIERS
           5.8.5 BARGAINING POWERS OF BUYERS
           5.8.6 INTENSITY OF COMPETITIVE RIVALRY
    5.9 TARIFF AND REGULATORY LANDSCAPE
           5.9.1 REGULATORY BODIES, GOVERNMENT AGENCIES, AND OTHER ORGANIZATIONS
                    5.9.1.1 UN Office of Outer Space Affairs (UNOOSA)
                    5.9.1.2 UN Committee on the Peaceful Uses of Outer Space (COPUOS)
                               TABLE 8 UN SPACE TREATIES
                    5.9.1.3 North America
                    5.9.1.4 Europe
                    5.9.1.5 Asia Pacific
    5.10 KEY CONFERENCES AND EVENTS IN 2022–2023
           TABLE 9 MARKET: DETAILED LIST OF CONFERENCES AND EVENTS
 
6 INDUSTRY TRENDS (Page No. - 66)
    6.1 INTRODUCTION
    6.2 TECHNOLOGY TRENDS
           6.2.1 LAUNCHER RECOVERABILITY
           6.2.2 REUSABLE ROCKETS
           6.2.3 ADDITIVE MANUFACTURING
           6.2.4 FLEXIBLE LAUNCH SERVICES
           6.2.5 SPACECRAFT PROPULSION
           6.2.6 ADVANCED PAYLOAD SYSTEMS
           6.2.7 IN-ORBIT SERVICES
           6.2.8 PROPELLANT TECHNOLOGIES
           6.2.9 UPPER STAGE AND SPACECRAFT ORBIT RAISING TECHNOLOGIES
    6.3 USE CASE OF SLS MARKET
           6.3.1 BOOM IN SPACE EXPLORATION
           6.3.2 ADVANCEMENT IN SATELLITE COMMUNICATION
           6.3.3 SPACE ROBOTICS AND SERVICING
           6.3.4 DEVELOPMENTS IN REMOTE SENSING
           6.3.5 IMPROVEMENTS IN SPACE ENGINEERING
           6.3.6 INCREASE IN SPACE MINING
    6.4 IMPACT OF MEGATRENDS
           6.4.1 REUSABLE ROCKETS REDUCE LAUNCH COST
           6.4.2 ENHANCED SMALL SATELLITE LAUNCHES
           6.4.3 SPACE TOURISM
    6.5 INNOVATION AND PATENT REGISTRATIONS
 
7 SPACE LAUNCH SERVICES MARKET, BY END USER (Page No. - 71)
    7.1 INTRODUCTION
           FIGURE 25 MILITARY AND GOVERNMENT SEGMENT TO ACQUIRE HIGHER MARKET SHARE DURING FORECAST PERIOD
           TABLE 10 MARKET, BY END USER, 2018–2021 (USD MILLION)
           TABLE 11 MARKET, BY END USER, 2022–2027 (USD MILLION)
    7.2 COMMERCIAL
           7.2.1 OBSERVATION
           7.2.2 COMMUNICATION
           7.2.3 SCIENTIFIC R&D
           7.2.4 OTHERS (CIVIL, ETC.)
    7.3 MILITARY AND GOVERNMENT
           7.3.1 DEPARTMENT OF DEFENSE AND INTELLIGENCE AGENCIES
           7.3.2 NATIONAL SPACE AGENCIES
           7.3.3 SEARCH AND RESCUE ENTITIES
           7.3.4 NATIONAL MAPPING AND TOPOGRAPHIC AGENCIES
 
8 SPACE LAUNCH SERVICES MARKET, BY LAUNCH VEHICLE (Page No. - 76)
    8.1 INTRODUCTION
           FIGURE 26 MEDIUM TO HEAVY VEHICLES (>350,000 KG) SEGMENT EXPECTED TO GROW AT HIGHER CAGR DURING FORECAST PERIOD
           TABLE 12 MARKET, BY LAUNCH VEHICLE, 2018–2021 (USD MILLION)
           TABLE 13 MARKET, BY LAUNCH VEHICLE, 2022–2027 (USD MILLION)
    8.2 SMALL LIFT LAUNCH VEHICLES (<350,000 KG)
    8.3 MEDIUM TO HEAVY VEHICLES (>350,000 KG)
 
9 SPACE LAUNCH SERVICES MARKET, BY LAUNCH TYPE (Page No. - 79)
    9.1 INTRODUCTION
           FIGURE 27 SINGLE USE SEGMENT TO GROW AT HIGHEST RATE DURING FORECAST PERIOD
           TABLE 14 MARKET, BY LAUNCH TYPE, 2018–2021 (USD MILLION)
           TABLE 15 MARKET, BY LAUNCH TYPE, 2022–2027 (USD MILLION)
    9.2 SINGLE USE
    9.3 REUSABLE
 
10 SPACE LAUNCH SERVICES MARKET, BY ORBIT (Page No. - 82)
     10.1 INTRODUCTION
             FIGURE 28 LOW EARTH ORBIT SEGMENT EXPECTED TO GROW AT HIGHEST CAGR DURING FORECAST PERIOD
             TABLE 16 SPACE LAUNCH VEHICLES MARKET, BY ORBIT, 2018–2022 (USD MILLION)
             TABLE 17 SPACE LAUNCH VEHICLES MARKET, BY ORBIT, 2022–2027 (USD MILLION)
     10.2 LOW EARTH ORBIT (LEO)
     10.3 MEDIUM EARTH ORBIT (MEO)
     10.4 GEOSTATIONARY EARTH ORBIT (GEO)
     10.5 BEYOND GEOSTATIONARY EARTH ORBIT
 
11 SPACE LAUNCH SERVICES MARKET, BY PAYLOAD (Page No. - 86)
     11.1 INTRODUCTION
             FIGURE 29 SMALL SATELLITE SEGMENT EXPECTED TO GROW AT HIGHEST RATE DURING FORECAST PERIOD
             TABLE 18 MARKET, BY PAYLOAD, 2018–2021 (USD MILLION)
             TABLE 19 MARKET, BY PAYLOAD, 2022–2027 (USD MILLION)
     11.2 SATELLITES
             11.2.1 SMALL SATELLITES (1–500 KG)
                        11.2.1.1 Nanosatellites
                        11.2.1.2 Microsatellites
                        11.2.1.3 Minisatellites
             11.2.2 MEDIUM SATELLITES (500–2,500 KG)
             11.2.3 LARGE SATELLITES (>2,500 KG)
     11.3 CARGO
     11.4 HUMAN SPACECRAFT
     11.5 SPACE PROBES
 
12 SPACE LAUNCH SERVICES MARKET, BY SERVICE TYPE (Page No. - 91)
     12.1 INTRODUCTION
     12.2 PRE LAUNCH
             12.2.1 INTEGRATION
             12.2.2 MANUFACTURERS
             12.2.3 WAREHOUSING
             12.2.4 LAUNCH ACQUISITION AND COORDINATION
             12.2.5 MANAGEMENT SERVICES
             12.2.6 INTEGRATION AND LOGISTICS
             12.2.7 ASSEMBLING
             12.2.8 COMPONENT AND PART SUPPLIERS
             12.2.9 TRACKING, DATA, AND TELEMETRY SUPPORT
             12.2.10 INSURANCE
     12.3 POST LAUNCH
             12.3.1 LAUNCH AND EARLY OPERATIONS PHASE (LEOP)
             12.3.2 RESUPPLY MISSIONS
             12.3.3 VALUE-ADDED SERVICES
             12.3.4 PAYLOAD OPERATORS
             12.3.5 STABILIZATION
             12.3.6 OTHERS
 
13 REGIONAL ANALYSIS (Page No. - 94)
     13.1 INTRODUCTION
             FIGURE 30 SPACE LAUNCH SERVICES MARKET: REGIONAL SNAPSHOT
             TABLE 20 MARKET, BY REGION, 2018–2021 (USD MILLION)
             TABLE 21 MARKET, BY REGION, 2022–2027 (USD MILLION)
     13.2 NORTH AMERICA
             FIGURE 31 NORTH AMERICA: SPACE LAUNCH SERVICES MARKET SNAPSHOT
             TABLE 22 NORTH AMERICA: MARKET, BY PAYLOAD, 2018–2021 (USD MILLION)
             TABLE 23 NORTH AMERICA: MARKET, BY PAYLOAD, 2022–2027 (USD MILLION)
             TABLE 24 NORTH AMERICA: MARKET, BY ORBIT, 2018–2021 (USD MILLION)
             TABLE 25 NORTH AMERICA: MARKET, BY ORBIT, 2022–2027 (USD MILLION)
             TABLE 26 NORTH AMERICA: MARKET, BY LAUNCH VEHICLE, 2018–2021 (USD MILLION)
             TABLE 27 NORTH AMERICA: MARKET, BY LAUNCH VEHICLE, 2022–2027 (USD MILLION)
             TABLE 28 NORTH AMERICA: MARKET, BY END USER, 2018–2021 (USD MILLION)
             TABLE 29 NORTH AMERICA: MARKET, BY END USER, 2022–2027 (USD MILLION)
             TABLE 30 NORTH AMERICA: MARKET, BY COUNTRY, 2018–2021 (USD MILLION)
             TABLE 31 NORTH AMERICA: MARKET, BY COUNTRY, 2022–2027 (USD MILLION)
             13.2.1 US
                        TABLE 32 US: MARKET, BY PAYLOAD, 2018–2021 (USD MILLION)
                        TABLE 33 US: MARKET, BY PAYLOAD, 2022–2027 (USD MILLION)
                        TABLE 34 US: MARKET, BY END USER, 2018–2021 (USD MILLION)
                        TABLE 35 US: MARKET, BY END USER, 2022–2027 (USD MILLION)
             13.2.2 CANADA
                        TABLE 36 CANADA: MARKET, BY PAYLOAD, 2018–2021 (USD MILLION)
                        TABLE 37 CANADA: MARKET, BY PAYLOAD, 2022–2027 (USD MILLION)
                        TABLE 38 CANADA: MARKET, BY END USER, 2018–2021 (USD MILLION)
                        TABLE 39 CANADA: MARKET, BY END USER, 2022–2027 (USD MILLION)
     13.3 EUROPE
             FIGURE 32 EUROPE: SPACE LAUNCH SERVICES MARKET SNAPSHOT
             TABLE 40 EUROPE: MARKET, BY PAYLOAD, 2018–2021 (USD MILLION)
             TABLE 41 EUROPE: MARKET, BY PAYLOAD, 2022–2027 (USD MILLION)
             TABLE 42 EUROPE: MARKET, BY ORBIT, 2018–2021 (USD MILLION)
             TABLE 43 EUROPE: MARKET, BY ORBIT, 2022–2027 (USD MILLION)
             TABLE 44 EUROPE: MARKET, BY LAUNCH VEHICLE, 2018–2021 (USD MILLION)
             TABLE 45 EUROPE: MARKET, BY LAUNCH VEHICLE, 2022–2027 (USD MILLION)
             TABLE 46 EUROPE: MARKET, BY END USER, 2018–2021 (USD MILLION)
             TABLE 47 EUROPE: MARKET, BY END USER, 2022–2027 (USD MILLION)
             TABLE 48 EUROPE: MARKET, BY COUNTRY, 2018–2021 (USD MILLION)
             TABLE 49 EUROPE: MARKET, BY COUNTRY, 2022–2027 (USD MILLION)
             13.3.1 RUSSIA
                        TABLE 50 RUSSIA: MARKET, BY PAYLOAD, 2018–2021 (USD MILLION)
                        TABLE 51 RUSSIA: MARKET, BY PAYLOAD, 2022–2027 (USD MILLION)
                        TABLE 52 RUSSIA: MARKET, BY END USER, 2018–2021 (USD MILLION)
                        TABLE 53 RUSSIA: MARKET, BY END USER, 2022–2027 (USD MILLION)
             13.3.2 FRANCE
                        TABLE 54 FRANCE: MARKET, BY PAYLOAD, 2018–2021 (USD MILLION)
                        TABLE 55 FRANCE: MARKET, BY PAYLOAD, 2022–2027 (USD MILLION)
                        TABLE 56 FRANCE: MARKET, BY END USER, 2018–2021 (USD MILLION)
                        TABLE 57 FRANCE: MARKET, BY END USER, 2022–2027 (USD MILLION)
             13.3.3 GERMANY
                        TABLE 58 GERMANY: MARKET, BY PAYLOAD, 2018–2021 (USD MILLION)
                        TABLE 59 GERMANY: MARKET, BY PAYLOAD, 2022–2027 (USD MILLION)
                        TABLE 60 GERMANY: MARKET, BY END USER, 2018–2021 (USD MILLION)
                        TABLE 61 GERMANY: MARKET, BY END USER, 2022–2027 (USD MILLION)
             13.3.4 UK
                        TABLE 62 UK: MARKET, BY PAYLOAD, 2018–2021 (USD MILLION)
                        TABLE 63 UK: MARKET, BY PAYLOAD, 2022–2027 (USD MILLION)
                        TABLE 64 UK: MARKET, BY END USER, 2018–2021 (USD MILLION)
                        TABLE 65 UK: MARKET, BY END USER, 2022–2027 (USD MILLION)
             13.3.5 ITALY
                        TABLE 66 ITALY: MARKET, BY PAYLOAD, 2018–2021 (USD MILLION)
                        TABLE 67 ITALY: MARKET SIZE, BY PAYLOAD, 2022–2027 (USD MILLION)
                        TABLE 68 ITALY: MARKET, BY END USER, 2018–2021 (USD MILLION)
                        TABLE 69 ITALY: MARKET, BY END USER, 2022–2027 (USD MILLION)
             13.3.6 REST OF EUROPE
     13.4 ASIA PACIFIC
             FIGURE 33 ASIA PACIFIC: MARKET SNAPSHOT
             TABLE 70 ASIA PACIFIC: MARKET, BY PAYLOAD, 2018–2021 (USD MILLION)
             TABLE 71 ASIA PACIFIC: MARKET, BY PAYLOAD, 2022–2027 (USD MILLION)
             TABLE 72 ASIA PACIFIC: MARKET, BY ORBIT, 2018–2021 (USD MILLION)
             TABLE 73 ASIA PACIFIC: MARKET, BY ORBIT, 2022–2027 (USD MILLION)
             TABLE 74 ASIA PACIFIC: MARKET, BY LAUNCH VEHICLE, 2018–2021 (USD MILLION)
             TABLE 75 ASIA PACIFIC: MARKET, BY LAUNCH VEHICLE, 2022–2027 (USD MILLION)
             TABLE 76 ASIA PACIFIC: MARKET, BY END USER, 2018–2021 (USD MILLION)
             TABLE 77 ASIA PACIFIC: MARKET, BY END USER, 2022–2027 (USD MILLION)
             TABLE 78 ASIA PACIFIC: MARKET, BY COUNTRY, 2018–2021 (USD MILLION)
             TABLE 79 ASIA PACIFIC: MARKET, BY COUNTRY, 2022–2027 (USD MILLION)
             13.4.1 CHINA
                        TABLE 80 CHINA: SPACE LAUNCH SERVICES MARKET, BY PAYLOAD, 2018–2021 (USD MILLION)
                        TABLE 81 CHINA: MARKET, BY PAYLOAD, 2022–2027 (USD MILLION)
                        TABLE 82 CHINA: MARKET, BY END USER, 2018–2021 (USD MILLION)
                        TABLE 83 CHINA: MARKET, BY END USER, 2022–2027 (USD MILLION)
             13.4.2 JAPAN
                        TABLE 84 JAPAN: SPACE LAUNCH SERVICES MARKET, BY PAYLOAD, 2018–2021 (USD MILLION)
                        TABLE 85 JAPAN: MARKET, BY PAYLOAD, 2022–2027 (USD MILLION)
                        TABLE 86 JAPAN: MARKET, BY END USER, 2018–2021 (USD MILLION)
                        TABLE 87 JAPAN: MARKET, BY END USER, 2022–2027 (USD MILLION)
             13.4.3 INDIA
                        TABLE 88 INDIA: SPACE LAUNCH SERVICES MARKET, BY PAYLOAD, 2018–2021 (USD MILLION)
                        TABLE 89 INDIA: MARKET, BY PAYLOAD, 2022–2027 (USD MILLION)
                        TABLE 90 INDIA: MARKET, BY END USER, 2018–2021 (USD MILLION)
                        TABLE 91 INDIA: MARKET, BY END USER, 2022–2027 (USD MILLION)
             13.4.4 NEW ZEALAND
                        TABLE 92 NEW ZEALAND: SPACE LAUNCH SERVICES MARKET, BY PAYLOAD, 2018–2021 (USD MILLION)
                        TABLE 93 NEW ZEALAND: MARKET, BY PAYLOAD, 2022–2027 (USD MILLION)
                        TABLE 94 NEW ZEALAND: MARKET, BY END USER, 2018–2021 (USD MILLION)
                        TABLE 95 NEW ZEALAND: MARKET, BY END USER, 2022–2027 (USD MILLION)
             13.4.5 SOUTH KOREA
                        TABLE 96 SOUTH KOREA: SPACE LAUNCH SERVICES MARKET, BY PAYLOAD, 2018–2021 (USD MILLION)
                        TABLE 97 SOUTH KOREA: MARKET, BY PAYLOAD, 2022–2027 (USD MILLION)
                        TABLE 98 SOUTH KOREA: MARKET, BY END USER, 2018–2021 (USD MILLION)
                        TABLE 99 SOUTH KOREA: MARKET, BY END USER, 2022–2027 (USD MILLION)
     13.5 REST OF THE WORLD
             TABLE 100 REST OF THE WORLD: SPACE LAUNCH SERVICES MARKET, BY PAYLOAD, 2018–2021 (USD MILLION)
             TABLE 101 REST OF THE WORLD: MARKET, BY PAYLOAD, 2022–2027 (USD MILLION)
             TABLE 102 REST OF THE WORLD: MARKET, BY ORBIT, 2018–2021 (USD MILLION)
             TABLE 103 REST OF THE WORLD: MARKET, BY ORBIT, 2022–2027 (USD MILLION)
             TABLE 104 REST OF THE WORLD: MARKET, BY LAUNCH VEHICLE, 2018–2021 (USD MILLION)
             TABLE 105 REST OF THE WORLD: MARKET, BY LAUNCH VEHICLE, 2022–2027 (USD MILLION)
             TABLE 106 REST OF THE WORLD: MARKET, BY END USER, 2018–2021 (USD MILLION)
             TABLE 107 REST OF THE WORLD: MARKET, BY END USER, 2022–2027 (USD MILLION)
             TABLE 108 REST OF THE WORLD: MARKET, BY REGION, 2018–2021 (USD MILLION)
             TABLE 109 REST OF THE WORLD: MARKET, BY REGION, 2022–2027 (USD MILLION)
             13.5.1 MIDDLE EAST & AFRICA
                        TABLE 110 MIDDLE EAST: SPACE LAUNCH SERVICES MARKET, BY PAYLOAD, 2018–2021 (USD MILLION)
                        TABLE 111 MIDDLE EAST: MARKET, BY PAYLOAD, 2022–2027 (USD MILLION)
                        TABLE 112 MIDDLE EAST: MARKET, BY END USER, 2018–2021 (USD MILLION)
                        TABLE 113 MIDDLE EAST: MARKET, BY END USER, 2022–2027 (USD MILLION)
             13.5.2 LATIN AMERICA
                        TABLE 114 LATIN AMERICA: MARKET, BY PAYLOAD, 2018–2021 (USD MILLION)
                        TABLE 115 LATIN AMERICA: MARKET, BY PAYLOAD, 2022–2027 (USD MILLION)
                        TABLE 116 LATIN AMERICA: MARKET, BY END USER, 2018–2021 (USD MILLION)
                        TABLE 117 LATIN AMERICA: MARKET, BY END USER, 2022–2027 (USD MILLION)
 
14 COMPETITIVE LANDSCAPE (Page No. - 140)
     14.1 INTRODUCTION 
             TABLE 118 KEY DEVELOPMENTS BY LEADING PLAYERS IN SPACE LAUNCH SERVICES MARKET BETWEEN JANUARY 2018 AND JUNE 2022
     14.2 MARKET SHARE ANALYSIS OF LEADING PLAYERS, 2021 
             TABLE 119 DEGREE OF COMPETITION
             FIGURE 34 MARKET SHARE OF KEY PLAYERS IN SPACE LAUNCH SERVICES MARKET, 2021
             FIGURE 35 COLLECTIVE REVENUE SHARE OF TOP SIX PLAYERS
     14.3 RANK ANALYSIS IN 2021 
             FIGURE 36 REVENUE SHARE OF TOP FIVE PLAYERS IN SPACE LAUNCH SERVICES MARKET IN 2021
             TABLE 120 COMPANY REGION FOOTPRINT
             TABLE 121 COMPANY MOBILITY FOOTPRINT
     14.4 COMPETITIVE EVALUATION QUADRANT 
             14.4.1 STARS
             14.4.2 PERVASIVE PLAYERS
             14.4.3 EMERGING LEADERS
             14.4.4 PARTICIPANTS
                        FIGURE 37 SPACE LAUNCH SERVICES MARKET COMPETITIVE LEADERSHIP MAPPING, 2021
     14.5 COMPETITIVE BENCHMARKING 
             14.5.1 PROGRESSIVE COMPANIES
             14.5.2 RESPONSIVE COMPANIES
             14.5.3 STARTING BLOCKS
             14.5.4 DYNAMIC COMPANIES
                        FIGURE 38 SPACE LAUNCH SERVICES MARKET COMPETITIVE LEADERSHIP MAPPING (SME)
     14.6 DETAILED LIST AND COMPETITIVE BENCHMARKING OF KEY STARTUPS/SMES 
                        TABLE 122 SPACE LAUNCH SERVICES MARKET: DETAILED LIST OF KEY STARTUPS/SMES
     14.7 COMPETITIVE SCENARIO 
             14.7.1 PRODUCT LAUNCHES
                        TABLE 123 SPACE LAUNCH SERVICES MARKET: PRODUCT LAUNCHES, JANUARY 2018–JUNE 2022
             14.7.2 DEALS
                        TABLE 124 SPACE LAUNCH SERVICES MARKET: DEALS, JANUARY 2018–JUNE 2022
             14.7.3 OTHER DEVELOPMENTS
                        TABLE 125 SPACE LAUNCH SERVICES MARKET: OTHER DEVELOPMENTS, JANUARY 2018–JUNE 2022
 
15 COMPANY PROFILES (Page No. - 156)
     15.1 INTRODUCTION 
(Business overview, Products/Solutions/Services offered, Recent Developments, MnM view, Key strengths, Strategic choices, Weaknesses and competitive threats) *  
     15.2 KEY PLAYERS 
             15.2.1 CHINA AEROSPACE SCIENCE AND TECHNOLOGY CORPORATION
                        TABLE 126 CHINA AEROSPACE SCIENCE AND TECHNOLOGY CORPORATION: BUSINESS OVERVIEW
                        TABLE 127 CHINA AEROSPACE SCIENCE AND TECHNOLOGY CORPORATION: NEW PRODUCT LAUNCHES
             15.2.2 SPACEX
                        TABLE 128 SPACEX: BUSINESS OVERVIEW
                        TABLE 129 SPACEX: NEW PRODUCT LAUNCHES
                        TABLE 130 SPACEX: DEALS
             15.2.3 UNITED LAUNCH ALLIANCE
                        TABLE 131 UNITED LAUNCH ALLIANCE: BUSINESS OVERVIEW
                        TABLE 132 UNITED LAUNCH ALLIANCE: NEW PRODUCT LAUNCHES
                        TABLE 133 UNITED LAUNCH ALLIANCE: DEALS
             15.2.4 NORTHROP GRUMMAN CORPORATION
                        TABLE 134 NORTHROP GRUMMAN CORPORATION: BUSINESS OVERVIEW
                        FIGURE 39 NORTHROP GRUMMAN CORPORATION: COMPANY SNAPSHOT
                        TABLE 135 NORTHROP GRUMMAN CORPORATION: DEALS
             15.2.5 THE BOEING COMPANY
                        TABLE 136 THE BOEING COMPANY: BUSINESS OVERVIEW
                        FIGURE 40 THE BOEING COMPANY: COMPANY SNAPSHOT
                        TABLE 137 THE BOEING COMPANY: NEW PRODUCT LAUNCHES
                        TABLE 138 THE BOEING COMPANY: DEALS
             15.2.6 MITSUBISHI HEAVY INDUSTRIES
                        TABLE 139 MITSUBISHI HEAVY INDUSTRIES: BUSINESS OVERVIEW
                        FIGURE 41 MITSUBISHI HEAVY INDUSTRIES: COMPANY SNAPSHOT
                        TABLE 140 MITSUBISHI HEAVY INDUSTRIES: NEW PRODUCT LAUNCHES
                        TABLE 141 MITSUBISHI HEAVY INDUSTRIES: DEALS
             15.2.7 ANTRIX
                        TABLE 142 ANTRIX: BUSINESS OVERVIEW
                        FIGURE 42 ANTRIX: COMPANY SNAPSHOT
                        TABLE 143 ANTRIX: NEW PRODUCT LAUNCHES
                        TABLE 144 ANTRIX: DEALS
             15.2.8 ARIANESPACE
                        TABLE 145 ARIANESPACE: BUSINESS OVERVIEW
                        TABLE 146 ARIANESPACE: NEW PRODUCT LAUNCHES
                        TABLE 147 ARIANESPACE: DEALS
             15.2.9 BLUE ORIGIN
                        TABLE 148 BLUE ORIGIN: BUSINESS OVERVIEW
                        TABLE 149 BLUE ORIGIN: NEW PRODUCT LAUNCHES
                        TABLE 150 BLUE ORIGIN: DEALS
             15.2.10 CHINA GREAT WALL INDUSTRY
                        TABLE 151 CHINA GREAT WALL INDUSTRY: BUSINESS OVERVIEW
                        TABLE 152 CHINA GREAT WALL INDUSTRY: NEW PRODUCT LAUNCHES
             15.2.11 ILS INTERNATIONAL LAUNCH SERVICES
                        TABLE 153 ILS INTERNATIONAL LAUNCH SERVICES: BUSINESS OVERVIEW
                        TABLE 154 ILS INTERNATIONAL LAUNCH SERVICES: NEW PRODUCT LAUNCHES
             15.2.12 LOCKHEED MARTIN
                        TABLE 155 LOCKHEED MARTIN: BUSINESS OVERVIEW
                        FIGURE 43 LOCKHEED MARTIN: COMPANY SNAPSHOT
                        TABLE 156 LOCKHEED MARTIN: NEW PRODUCT LAUNCHES
                        TABLE 157 LOCKHEED MARTIN: DEALS
             15.2.13 ASTRA SPACE
                        TABLE 158 ASTRA SPACE: BUSINESS OVERVIEW
                        TABLE 159 ASTRA SPACE: DEALS
             15.2.14 SWEDISH SPACE CORPORATION (SSC)
                        TABLE 160 SWEDISH SPACE CORPORATION: BUSINESS OVERVIEW
                        FIGURE 44 SWEDISH SPACE CORPORATION: COMPANY SNAPSHOT
                        TABLE 161 SWEDISH SPACE CORPORATION: NEW PRODUCT LAUNCHES
                        TABLE 162 SWEDISH SPACE CORPORATION: DEALS
             15.2.15 ROCKET LAB
                        TABLE 163 ROCKET LAB: BUSINESS OVERVIEW
                        FIGURE 45 ROCKET LAB: COMPANY SNAPSHOT
                        TABLE 164 ROCKET LAB: NEW PRODUCT LAUNCHES
                        TABLE 165 ROCKET LAB: DEALS
             15.2.16 FIREFLY AEROSPACE
                        TABLE 166 FIREFLY AEROSPACE: BUSINESS OVERVIEW
                        TABLE 167 FIREFLY AEROSPACE: NEW PRODUCT LAUNCHES
                        TABLE 168 FIREFLY AEROSPACE: DEALS
             15.2.17 RELATIVITY SPACE
                        TABLE 169 RELATIVITY AEROSPACE: BUSINESS OVERVIEW
                        TABLE 170 RELATIVITY AEROSPACE: NEW PRODUCT LAUNCHES
                        TABLE 171 RELATIVITY AEROSPACE: DEALS
             15.2.18 DAWN AEROSPACE
                        TABLE 172 DAWN AEROSPACE: BUSINESS OVERVIEW
                        TABLE 173 DAWN AEROSPACE: NEW PRODUCT LAUNCHES
                        TABLE 174 DAWN AEROSPACE: DEALS
             15.2.19 GRAVITILAB AEROSPACE SERVICES
                        TABLE 175 GRAVITILAB AEROSPACE SERVICES: BUSINESS OVERVIEW
                        TABLE 176 GRAVITILAB AEROSPACE SERVICES
             15.2.20 CNIM AIR SPACE
                        TABLE 177 CNIM AIR SPACE: BUSINESS OVERVIEW
                        TABLE 178 CNIM AIR SPACE: NEW PRODUCT LAUNCHES
                        TABLE 179 CNIM AIR SPACE: DEALS
             15.2.21 VIRGIN ORBIT
                        TABLE 180 VIRGIN ORBIT: BUSINESS OVERVIEW
                        TABLE 181 VIRGIN ORBIT: NEW PRODUCT LAUNCHES
                        TABLE 182 VIRGIN ORBIT: DEALS
             15.2.22 SIERRA SPACE
                        TABLE 183 SIERRA SPACE: BUSINESS OVERVIEW
                        TABLE 184 SIERRA SPACE: NEW PRODUCT LAUNCHES
                        TABLE 185 SIERRA SPACE: DEALS
             15.2.23 EUROCKOT
                        TABLE 186 EUROCKOT: BUSINESS OVERVIEW
                        TABLE 187 EUROCKOT: NEW PRODUCT LAUNCHES
             15.2.24 ISC KOSMOTRAS
                        TABLE 188 ISC KOSMOTRAS: BUSINESS OVERVIEW
                        TABLE 189 ISC KOSMOTRAS: DEALS
*Details on Business overview, Products/Solutions/Services offered, Recent Developments, MnM view, Key strengths, Strategic choices, Weaknesses and competitive threats might not be captured in case of unlisted companies.  
 
16 APPENDIX (Page No. - 199)
     16.1 DISCUSSION GUIDE 
     16.2 KNOWLEDGESTORE: MARKETSANDMARKETS’ SUBSCRIPTION PORTAL 
     16.3 CUSTOMIZATION OPTIONS 
     16.4 RELATED REPORTS 
     16.5 AUTHOR DETAILS 
 

The study involved four major activities in estimating the current size of the space launch services market. Exhaustive secondary research was done to collect information on the market, peer market, and parent market. The next step was to validate these findings, assumptions, and sizing with industry experts across the value chain through primary research. Both top-down and bottom-up approaches were employed to estimate the complete market size. After that, market breakdown and data triangulation were used to estimate the market size of segments and subsegments.

Secondary Research

In the secondary research process, various sources were referred to for identifying and collecting information for this study. The secondary sources included government sources, such as SIPRI; corporate filings such as annual reports, press releases, and investor presentations of companies; white papers, journals, and certified publications; and articles from recognized authors, directories, and databases.

Primary Research

In the primary research process, various primary sources from both supply and demand sides were interviewed to obtain qualitative and quantitative information on the market. The primary sources from the supply side included various industry experts, such as Chief X Officers (CXOs), Vice Presidents (VPs), Directors, from business development, marketing, product development/innovation teams, and related key executives from space launch services vendors; system integrators; component providers; distributors; and key opinion leaders.

Primary interviews were conducted to gather insights such as market statistics, data of revenue collected from the products and services, market breakdowns, market size estimations, market forecasting, and data triangulation. Primary research also helped understand the various trends related to technology, application, vertical, and region. Stakeholders from the demand side, such as CIOs, CTOs, and CSOs, and installation teams of the customer/end users who are using space launch services were interviewed to understand the buyer’s perspective on the suppliers, products, component providers, and their current usage of space launch services and future outlook of their business which will affect the overall market.
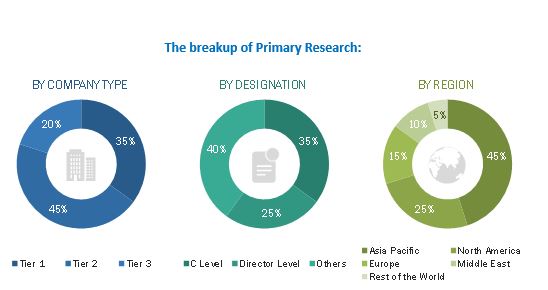
Space Launch Services Market Size, and Share

To know about the assumptions considered for the study, download the pdf brochure

COMPANY NAME

DESIGNATION

Surrey Satellite Technology Ltd.

Head of International Business

Manatsu Space

Co-Founder

YSPM, LLC

CEO & Principal Consultant

Market Size Estimation

Both top-down and bottom-up approaches were used to estimate and validate the total size of the space launch services market. These methods were also used extensively to estimate the size of various segments and subsegments of the market. The research methodology used to estimate the market size included the following:

  • Key players in the industry and market were identified through extensive secondary research of their product matrix and geographical presence and developments undertaken by them.
  • All percentage shares, splits, and breakdowns were determined using secondary sources and verified through primary sources.

Global space launch services market Size: Bottom-Up Approach
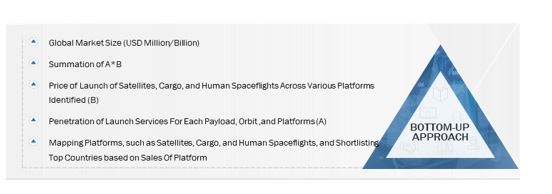
Space Launch Services Market Size, and Bottom-Up Approach

Data Triangulation

After arriving at the overall size of the space launch services market using the market size estimation processes explained above, the market was split into several segments and subsegments. To complete the overall market engineering process and arrive at the exact statistics of each market segment and subsegment, data triangulation, and market breakdown procedures were employed, wherever applicable. The data was triangulated by studying various factors and trends from demand as well as supply sides of the space launch services market.

Report Objectives

  • To define, describe, and forecast the space launch services market by service type, payload, orbit, launch vehicle type, launch type, end use, and region
  • To analyze the demand- and supply-side indicators influencing the growth of the space launch services market
  • To provide in-depth market intelligence regarding key market dynamics, such as drivers, restraints, opportunities, and industry-specific challenges, which influence the growth of the space launch services market
  • To forecast the size of various segments of the space launch services market across five main regions, namely, North America, Europe, Asia Pacific, and Rest of the World.
  • To analyze micromarkets 1 with respect to individual growth trends, prospects, and their contribution to the space launch services market
  • To analyze technological advancements and new product launches in the space launch services market
  • To strategically profile key players in the space launch services market and comprehensively analyze their core competencies 2
  • To identify products and key developments of leading companies operating in the space launch services market
  • To provide a comprehensive analysis of business and corporate strategies adopted by key players operating in the space launch services market
  • To provide a detailed competitive landscape of the space launch services market, along with market share ranking of leading players in the market

Available Customizations:

With the given market data, MarketsandMarkets offers customizations according to the specific requirements of companies.

Product Analysis

  • Product matrix, which gives a detailed comparison of the product portfolio of each company

Company Information

  • Detailed analysis and profiles of additional market players (up to 5)
Custom Market Research Services

We will customize the research for you, in case the report listed above does not meet with your exact requirements. Our custom research will comprehensively cover the business information you require to help you arrive at strategic and profitable business decisions.

Request Customization

Instant Answers with GPT - Ask Now!

Ask real questions. Get complete answers !
Report Code
AS 5800
Published ON
Aug, 2022
Choose License Type
BUY NOW
  • SHARE
X
Request Customization
Speak to Analyst
Speak to Analyst
OR FACE-TO-FACE MEETING
PERSONALIZE THIS RESEARCH
  • Triangulate with your Own Data
  • Get Data as per your Format and Definition
  • Gain a Deeper Dive on a Specific Application, Geography, Customer or Competitor
  • Any level of Personalization
REQUEST A FREE CUSTOMIZATION
LET US HELP YOU!
  • What are the Known and Unknown Adjacencies Impacting the Space Launch Services Market
  • What will your New Revenue Sources be?
  • Who will be your Top Customer; what will make them switch?
  • Defend your Market Share or Win Competitors
  • Get a Scorecard for Target Partners
CUSTOMIZED WORKSHOP REQUEST
  • Call Us
  • +1-888-600-6441 (Corporate office hours)
  • +1-888-600-6441 (US/Can toll free)
  • +44-800-368-9399 (UK office hours)
CONNECT WITH US
ABOUT TRUST ONLINE
©2024 MarketsandMarkets Research Private Ltd. All rights reserved
DMCA.com Protection Status Website Feedback