Supply Chain Security Market

Report Code TC 7947
Published in Jan, 2025, By MarketsandMarkets™
Download PDF

Choose License Type

Buy Report Now Inquire Before Buying

Supply Chain Security Market by Hardware (IoT Sensors, RFID Tags & Readers, GPS Trackers), Software (Risk Management, Threat Intelligence, Blockchain-Based Solutions), Security Type (Data Locality & Protection, Fraud Prevention) - Global Forecast to 2030


Overview

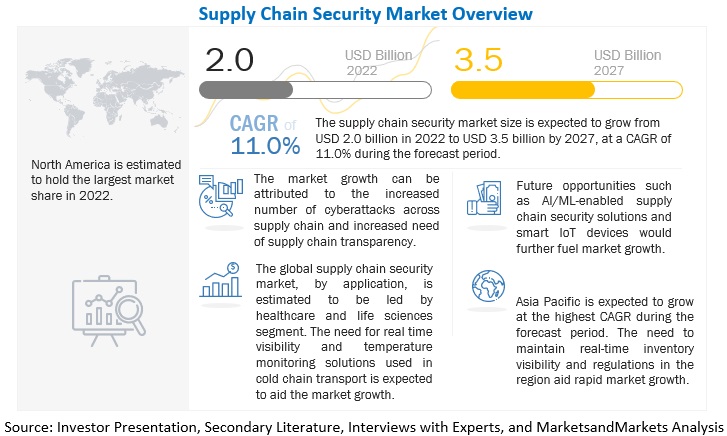
The global Supply Chain Security market size is projected to grow from USD 2.52 billion in 2024 to USD 5.14 billion by 2030 at a Compound Annual Growth Rate (CAGR) of 12.6% during the forecast period. The rising frequency of cyberattacks on third-party networks, such as ransomware and phishing, is a major driver of market expansion, pushing businesses to upgrade their security frameworks. This requirement is exacerbated by stringent rules such as GDPR in Europe and India's National Logistics Policy, which require compliance and risk mitigation. Simultaneously, the exponential growth of eCommerce and the broad deployment of IoT devices, such as RFID tags and sensors, are addressing issues like counterfeiting and data breaches. Furthermore, increasing stakeholder expectations for ethical sourcing and transparency are driving demand, while the fast adoption of AI and IoT technology allows for real-time monitoring, predictive risk management, and improved supply chain visibility.

Supply Chain Security Market

Attractive Opportunities in the Supply Chain Security Market

ASIA PACIFIC

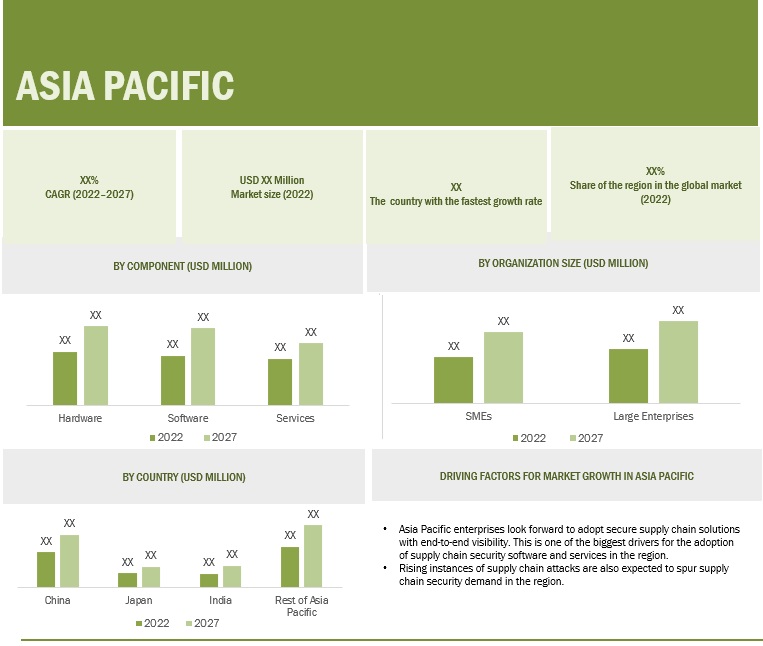
Market growth in the Asia Pacific is attributed to rapid industrialization, the booming manufacturing sector, and the exponential growth of eCommerce. The region's expanding trade networks, rising cross-border commerce, and increasing incidents of supply chain disruptions are compelling organizations to adopt robust supply chain security solutions

Limited awareness about supply chain security among organizations and third-party risks and insider threats are expected to pose a challenge to the growth of this market.

Rapid growth in the e-commerce sector, advancing risk prediction and management in supply chains, and increasing IoT devices in the supply chain are factors expected to provide lucrative opportunities for market players.

Rising incidences of cyberattacks across supply chains, growing need for supply chain transparency, upsurge and innovation in advanced technologies, and regulatory compliance and stringent government mandates are key factors driving the market growth.

The supply chain security market in Europe is driven by stringent regulatory frameworks like GDPR and Europe’s reliance on cross-border trade which underscores the need for supply chain security solutions.

Impact of AI on Supply Chain Security Market

The integration of AI and generative AI (Gen AI) into the Supply Chain Security market enhances threat detection, replicates the threat and risk scenarios, and improve the decision making processes by using advanced data analysis. This helps in reshaping the supply chain management into a more driven and dynamic system. Generative AI algorithms helps in investigating spot trends, transaction data, and abnormalities, along with highly possible fraud cases in supply chain. With such advancement, organizations will easily prevent financial losses, maintain the integrity of their supply chain processes, and also safeguard their company’s brand.

Supply Chain Security Market Impact

Global Supply Chain Security Market Dynamics

Driver: Upsurge and innovation in technology

Emerging and new technologies such as AI, IoT, blockchain, and predictive analytics have become very popular because of which there is an increased demand for enhanced supply chain security solutions. For example, UPS along with Inxeption has created Zippy which is a blockchain based platform which uses blockchain technology to provide end-to-end visibility and traceability of items across the supply chain. It guarantees that all transactions are securely documented, authenticated, and confirmed, lowering the risk of fraud and increasing consumer trust. Similarly AI helps in analyzing large data sets which helps in enhancing the visibility of the supply chain. Along with this, AI powered supply chain security solutions help companies track the supplies in real time which ensures transparency and ethical sourcing practices. The integration of these technologies with the supply chain security solutions addresses the security issues, reduces operational inefficiencies, and enhances customer’s trust driving the supply chain security market globally.

Restraint: Budgetary constraints among small and emerging startups in developing economies

The budget for managing cybersecurity requirement grows at a higher rate than the planned budget to address them. Many smaller companies do not have enough budget and specialized and expert resources to protect their IT infrastructure and network from cybersecurity attacks and breaches. Shortage of capital funding is considered to be one of the restraining factor for SMEs adopting the supply chain security model. Developing countries present in regions like Asia Pacific, Middle East and Africa, and Latin America often face difficulties in acquiring finance and appropriate funding to adopt supply chain security solutions for their business. The capital funding in these countries is often obtained for safeguarding business critical operations, which leaves very less or no funding at all for enhancing advanced supply chain security solutions.


Opportunity: Increasing IoT devices in the supply chain

IoT technology has the capability to alter operations by delivering real-time data on inventory levels, shipment tracking, and equipment conditions and because of this, it is increasingly being used in the supply chain. Businesses are benefitting from the greater operational visibility, predictive maintenance, and easier inventory management that comes from using IoT technology.  For instance, IoT sensors monitor the location and condition of commodities and predictive maintenance lowers downtime by detecting equipment problems before they occur. Inspite of that, because of the increased dependency on IoT devices new dangers are created. IoT-enabled sensors and devices frequently handle sensitive data like order numbers and supplier connections, making them possible targets for hackers. Unauthorized access, data breaches, and sensitive information manipulation underscore the critical necessity for strong security measures including encryption, authentication, and secure firmware upgrades. The increasing usage of IoT in supply chain operations creates a big potential for the supply chain security market to develop new solutions to address these risks. Many companies are using the IoT technology. For example, Nissan uses an IoT supply chain to link its multiple industrial units, and Amazon is using a fleet of IoT-enabled robots for warehouse management operations by scanning the QR code on packages. Technologies such as Identity of Things (IDoT) help improve trust and security in IoT ecosystems by verifying device authenticity and protecting data integrity. As organizations increasingly add IoT devices to optimize their operations, the need for holistic IoT security solutions will fuel development and innovation in the supply chain security industry.

Challenge: Limited awareness about supply chain security among organizations

The supply chain is undergoing a digital revolution, which includes work automation and optimizing IoT processes. This has rendered the sector more vulnerable to attacks and breaches. As a result, firms in the supply chain industry must engage in cybersecurity training and scenario-based tabletop evaluations of incident response strategies. Companies often realize too late that a lot of cyberattacks happen as a result of human actions. Because of this reason, training personnel should be a key priority for every company's supply chain security strategy. However, most organizations confess to providing cybersecurity awareness training to their staff after ransomware attacks. Employees are considered to be an organization's first defense but still many organizations lack a well-trained workforce and suitable cybersecurity infrastructure to protect themselves from supply chain threats. This limited awareness about supply chain security and lack of a well-trained workforce creates challenges for the supply chain security market.

Global Supply Chain Security Market Ecosystem Analysis
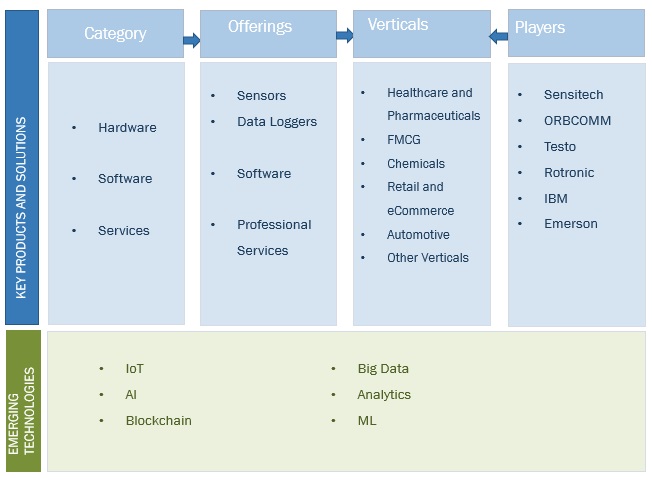
The combination of Hardware providers, solution providers, and service providers, along with application areas such as healthcare and pharmaceuticals, FMCG, chemicals, retail and eCommerce, automotive, and others make a complete supply chain security ecosystem. Regulatory authorities and standardization bodies also play an important role in influencing market trends, innovations, and an organization's Supply Chain Security strategies.

Top Companies in Supply Chain Security Market

Note: The ecosystem is not exhaustive and has been derived on a best-efforts basis. Source: Secondary Literature, Interviews with Experts, and MarketsandMarkets Analysis


By application area, the retail & eCommerce segment is to grow at the highest CAGR during the forecast period.

Retail & eCommerce sector is projected to grow at the highest CAGR because of a rapid digital transformation and an increased reliance on complex, global supply chains. The exponential rise of eCommerce, propelled by the pandemic, has prompted companies to use new technologies such as AI, blockchain, and IoT to protect their supply chains from escalating dangers such as cyberattacks, data breaches, and forged products. With the rise of online shopping, businesses confront increased risks in logistics, payment systems, and inventory management, necessitating strong supply chain security solutions to secure sensitive customer data, assure operational continuity, and defend brand reputation. Furthermore, legal demands such as GDPR and PCI-DSS require eCommerce players to create comprehensive security frameworks. Further, innovations in real-time tracking, risk assessment, and fraud detection are fueling the adoption of supply chain security systems in the retail and eCommerce sector.

By organization size, the large enterprises segment accounts for the largest market size during the forecast period

Large organizations dominate the Supply Chain Security Market because of their extensive and complicated supply chain networks that span many geographies and involve various stakeholders, suppliers, and logistical partners. These companies are potential targets for cyberattacks, data breaches, and disruptions, therefore supply chain security is a top focus for reducing financial, operational, and reputational threats. Large organizations with vast resources and budgets tends to invest in advanced technologies such as blockchain, AI-driven threat detection, IoT-enabled monitoring, and real-time risk analytics to provide complete visibility and security across their supply chains. Furthermore, large enterprises frequently face strict regulatory compliance requirements, such as GDPR, CCPA, and ISO standards, necessitating the implementation of strong security systems. Large organizations are also largely involved in global operations which expose them to geopolitical threats, counterfeiting, and third-party vulnerabilities, resulting in a stronger requirement for complete supply chain security solutions.

By region, North America accounts for the highest market share during the forecast period

North America has the largest market size due to its highly developed economy, strong technical infrastructure, and the presence of prominent supply chain security solution offering companies like IBM, Oracle, and Emerson, among others. North America leads the way in the adoption of advanced technologies like blockchain, AI, IoT, and cloud-based solutions for real-time supply chain monitoring. Furthermore, severe regulatory frameworks, such as the CISA Supply Chain Risk Management Guidelines in the United States and the National Institute of Standards and Technology (NIST) requirements, require businesses to incorporate sophisticated supply chain security measures. Further, North America's focus on innovation and compliance puts it to the top of the global market for supply chain security solutions.

HIGHEST MARKET SIZE IN 2024-2030
CANADA FASTEST GROWING MARKET IN THE REGION
Supply Chain Security Market by region

Recent Developments of Supply Chain Security Market

  • In October 2024, Emerson expanded its Ovation Automation Platform with enhanced cybersecurity capabilities in partnership with Nozomi Networks. This enhancement improves the security of power and water supply chains by integrating advanced OT and IoT security solutions, ensuring greater resilience and operational visibility.
  • In September 2024, Oracle announced new user experience enhancements within Oracle Fusion Cloud SCM, leveraging AI to increase workforce productivity, expand visibility, accelerate processes, and prioritize actions to drive results, thereby enhancing supply chain security.
  • In November 2023, Sensitech launched a cloud-based solution within the SensiWatch platform to monitor outbound shipments in real-time, extending cold chain visibility to the last mile. This innovation ensures the quality of perishable goods by providing continuous cargo monitoring from distribution centers to final destinations.
  • In July 2023, IBM collaborated with The National Association of Boards of Pharmacy (NABP) to launch Pulse by NABP which is a digital platform to enhance transparency and safety in the U.S. drug supply chain. Pulse helps in bringing visibility to the drug supply chain and also helps safeguard patients from forged or substandard prescription medications.

Key Market Players

List of Top Supply Chain Security Market Companies

The Supply Chain Security Market is dominated by a few major players that have a wide regional presence. The major players in the Supply Chain Security Market are

  • IBM (US)
  • Emerson (US)
  • Oracle (US)
  • NXP Semiconductors (Netherlands)
  • Testo (Germany)
  • ORBCOMM (US)
  • Sensitech (US)
  • Elpro (Switzerland)
  • Rotronic (Switzerland)
  • Berlinger & Co (Switzerland)

Want to explore hidden markets that can drive new revenue in Supply Chain Security Market?

Scope of the Report

Report Attribute Details
Market size available for years 2018-2030
Base year considered 2023
Forecast period 2024–2030
Forecast units Value (USD Million/USD Billion) 
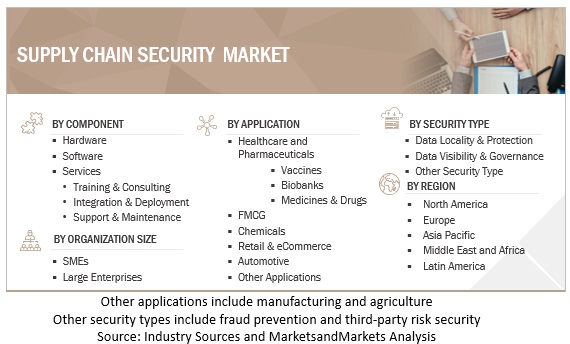
Segments Covered By Offering, Security Type, Organization Size, Application Areas, and Region.
Regions covered North America, Europe, Asia Pacific, Middle East and Africa, Latin America


Key Questions Addressed by the Report

What are the opportunities in the global Supply Chain Security market?
Rapid growth in the e-commerce sector, advancement in risk prediction and management for supply chains, and increasing adoption of IoT devices create opportunities for the Supply Chain Security market.
What is the definition of the Supply Chain Security market?
According to MarketsandMarkets, a supply chain security system combines traditional supply chain management practices with security measures and focuses on the risk management of external suppliers, vendors, logistics, and transportation. Supply chain security activities aim to enhance the security/ protection of the supply chain from terrorism, piracy, and theft. Supply chain security solutions help businesses identify, analyze, and mitigate supply chain risks with real-time visibility and transparency. This, in turn, helps businesses make faster, accurate, and informed decisions.
Which region is expected to show the highest Supply Chain Security market share?
North America is expected to account for the largest market share during the forecast period.
What are the major market players covered in the report?
Major vendors include IBM (US), Emerson (US), Oracle (US), NXP Semiconductors (Netherlands), Testo (Germany), ORBCOMM (US), Sensitech (US), Elpro (Switzerland), Rotronic (Switzerland), Berlinger & Co (Switzerland), Monnit (US), Cold Chain Technologies (US), LogTag Recorders (New Zealand), Dickson (US), Signatrol (UK) and other key players.
What is the current size of the global Supply Chain Security market?
The global Supply Chain Security market size is projected to grow from USD 2.52 Billion in 2024 to USD 5.14 Billion by 2030 at a Compound Annual Growth Rate (CAGR) of 12.6% during the forecast period.


Personalize This Research

  • Triangulate with your Own Data
  • Get Data as per your Format and Definition
  • Gain a Deeper Dive on a Specific Application, Geography, Customer or Competitor
  • Any level of Personalization
Request A Free Customisation

Let Us Help You

  • What are the Known and Unknown Adjacencies Impacting the Supply Chain Security Market
  • What will your New Revenue Sources be?
  • Who will be your Top Customer; what will make them switch?
  • Defend your Market Share or Win Competitors
  • Get a Scorecard for Target Partners
Customized Workshop Request

Table of Contents

Exclusive indicates content/data unique to MarketsandMarkets and not available with any competitors.

TITLE
PAGE NO
INTRODUCTION
34
RESEARCH METHODOLOGY
39
EXECUTIVE SUMMARY
49
PREMIUM INSIGHTS
52
MARKET OVERVIEW AND INDUSTRY TRENDS
57
  • 5.1 INTRODUCTION
  • 5.2 MARKET DYNAMICS
    DRIVERS
    - Rising incidences of cyberattacks across supply chains
    - Growing need for supply chain transparency
    - Upsurge and innovation in advanced technologies
    - Regulatory compliance and stringent government mandates
    RESTRAINTS
    - Budgetary constraints among small and emerging start-ups in developing economies
    - Shortage of skilled professionals
    OPPORTUNITIES
    - Rapid growth in eCommerce sector
    - Advancing risk prediction and management in supply chains
    - Increasing IoT devices in supply chain
    CHALLENGES
    - Limited awareness about supply chain security among organizations
    - Third-party risks and insider threats
  • 5.3 CASE STUDY ANALYSIS
    IONIX EMPOWERED E.ON TO SECURE DIGITAL SUPPLY CHAIN AND STRENGTHEN CYBER DEFENSES
    COLD CHAIN TECHNOLOGIES SECURED TEMPERATURE-SENSITIVE LOGISTICS WITH PARKOURSC’S REAL-TIME MONITORING PLATFORM
    SENSITECH ENABLED CORNERSTONE LOGISTICS TO ENHANCE SUPPLY CHAIN SECURITY WITH REAL-TIME CARGO MONITORING
    IBM ENHANCED SUPPLY CHAIN SECURITY WITH TRANSPARENT SUPPLY CHAIN INITIATIVE
    GLOBAL MANUFACTURER ENHANCED HIGH-VALUE ELECTRONICS SHIPMENT SECURITY WITH TIVE'S REAL-TIME TRACKING
  • 5.4 VALUE CHAIN ANALYSIS
    COMPONENT
    PLANNING & DESIGNING
    INFRASTRUCTURE DEVELOPMENT
    SYSTEM INTEGRATION
    CONSULTATION
    END USERS
  • 5.5 ECOSYSTEM ANALYSIS
  • 5.6 PORTER’S FIVE FORCES ANALYSIS
    THREAT OF NEW ENTRANTS
    BARGAINING POWER OF SUPPLIERS
    BARGAINING POWER OF BUYERS
    THREAT OF SUBSTITUTES
    INTENSITY OF COMPETITIVE RIVALRY
  • 5.7 PRICING ANALYSIS
    AVERAGE SELLING PRICE OF PRODUCT, BY KEY PLAYER, 2024
    INDICATIVE PRICING ANALYSIS OF PRODUCT, BY KEY PLAYER, 2024
  • 5.8 TECHNOLOGY ANALYSIS
    KEY TECHNOLOGIES
    - IoT & RFID
    - Blockchain
    - Edge computing
    COMPLEMENTARY TECHNOLOGIES
    - Digital twins
    - Big data analytics
    - Quantum Key Distribution (QKD)
    ADJACENT TECHNOLOGIES
    - Warehouse automation
    - Transportation Management Systems (TMS)
    - ERP systems
  • 5.9 PATENT ANALYSIS
    LIST OF MAJOR PATENTS
  • 5.10 TRADE ANALYSIS
    IMPORT SCENARIO OF RADAR AND RADIO NAVIGATIONAL SYSTEMS FOR REAL-TIME TRACKING AND ASSET SECURITY, 2019–2023 (USD BILLION)
    EXPORT SCENARIO OF RADAR AND RADIO NAVIGATIONAL SYSTEMS FOR REAL-TIME TRACKING AND ASSET SECURITY, 2019–2023 (USD BILLION)
  • 5.11 TRENDS/DISRUPTIONS IMPACTING CUSTOMER BUSINESS
  • 5.12 TARIFFS AND REGULATORY LANDSCAPE
    TARIFFS RELATED TO SUPPLY CHAIN SECURITY
    REGULATORY IMPLICATIONS AND INDUSTRY STANDARDS
    - European Union Aviation Safety Agency (EASA)
    - Responsible Minerals Initiative (RMI)
    - World Health Organization (WHO)
    - Cybersecurity Supply Chain Risk Management (C-SCRM)
    - National Credit Union Administration (NCUA)
    - National Counterintelligence and Security Center (NCSC)
    REGULATORY BODIES, GOVERNMENT AGENCIES, AND OTHER ORGANIZATIONS
  • 5.13 KEY STAKEHOLDERS AND BUYING CRITERIA
    KEY STAKEHOLDERS IN BUYING PROCESS
    BUYING CRITERIA
  • 5.14 KEY CONFERENCES AND EVENTS, 2025–2026
  • 5.15 INVESTMENT AND FUNDING SCENARIO
  • 5.16 IMPACT OF GENERATIVE AI ON SUPPLY CHAIN SECURITY MARKET
    GENERATIVE AI
    TOP USE CASES AND MARKET POTENTIAL IN MARKET
    - Key use cases
    IMPACT OF GENERATIVE AI ON INTERCONNECTED AND ADJACENT ECOSYSTEMS
    - IoT & RFID
    - Blockchain
    - Digital twins
    - Big data analytics
    - Edge computing
    - Quantum Key Distribution (QKD)
SUPPLY CHAIN SECURITY MARKET, BY OFFERING
102
  • 6.1 INTRODUCTION
    OFFERINGS: SUPPLY CHAIN SECURITY MARKET DRIVERS
  • 6.2 HARDWARE COMPONENTS
    HARDWARE DEVICES TO ENSURE REAL-TIME TRACKING AND TRACING OF ASSETS IN SUPPLY CHAIN
    IOT SENSORS & DEVICES
    - Need to transform supply chain management by offering real-time monitoring and enhanced operational control to drive market
    - Temperature sensors
    - Humidity sensors
    - Motion detectors
    - Vibration & shock sensors
    - Pressure sensors
    RFID TAGS & READERS
    - RFID to improve supply chain accuracy, reduce operational costs, and enhance resilience
    - Active RFID tags
    - Passive RFID tags
    - UHF (Ultra High Frequency) RFID systems
    - High Frequency (HF) and Low Frequency (LF) systems
    GPS TRACKERS
    - GPS technology to offer robust solution for improving security, operational efficiency, and customer satisfaction
    - Vehicle trackers
    - Portable asset trackers
    - Advanced GPS modules with IoT integration
    NETWORK SECURITY HARDWARE
    - Need to safeguard critical infrastructure and ensure seamless operations from cyber threats and disruptions to propel market
    - Firewalls
    - Intrusion Detection and Prevention Systems (IDPS)
    - Hardware Security Modules (HSMs) for key management
  • 6.3 SOFTWARE SOLUTIONS
    SOFTWARE INNOVATIONS TO EMPOWER BUSINESSES TO ANTICIPATE RISKS, STREAMLINE PROCESSES, AND MAINTAIN SECURE AND RESILIENT SUPPLY CHAIN NETWORKS
    RISK MANAGEMENT PLATFORMS
    - Need to strengthen supply chain security market by equipping organizations with tools to identify, assess, and mitigate risks effectively to fuel market growth
    - Vulnerability assessment tools
    - Predictive analytics software
    - Incident response & reporting systems
    THREAT INTELLIGENT SYSTEMS
    - Need to fortify organizations by offering actionable insights into vulnerabilities and potential attack vectors to accelerate market growth
    - AI-powered threat detection tools
    - Malware analysis platforms
    - Threat hunting systems
    BLOCKCHAIN-BASED SOLUTIONS
    - Blockchain-based solutions to offer unparalleled transparency, traceability, and trust, addressing critical vulnerabilities
    - Smart contracts for supply chain integrity
    - Distributed Ledger Platforms (DLPs)
    - Blockchain-as-a-Service (BaaS) tools
    SUPPLY CHAIN VISIBILITY TOOLS
    - Supply chain visibility tools to enhance security and efficiency by providing real-time insights into movement of goods, information, and transactions
    - Real-time tracking dashboards
    - Supplier collaboration platforms
    - Automated compliance monitoring software
  • 6.4 SERVICES
    INCREASED DEMAND FOR SERVICES TO EFFECTIVELY IMPLEMENT SUPPLY CHAIN SECURITY SOLUTIONS
    TRAINING & CONSULTING
    - Training services to help users adopt supply chain security solutions efficiently
    INTEGRATION & DEPLOYMENT
    - Need for formulating and implementing supply chain security strategies, preventing revenue losses, minimizing risks, and enhancing security to foster market growth
    SUPPORT & MAINTENANCE
    - Need for technical assistance and post-maintenance services to solve critical issues to drive market
    MANAGED SERVICES
    - Need for proactive threat detection and risk mitigation to boost market growth
SUPPLY CHAIN SECURITY MARKET, BY SECURITY TYPE
130
  • 7.1 INTRODUCTION
    SECURITY TYPES: MARKET DRIVERS
  • 7.2 DATA LOCALITY & PROTECTION
    DATA LOCALITY & PROTECTION TO ENSURE SAFE, SECURE, AND TRANSPARENT SUPPLY CHAINS
  • 7.3 DATA VISIBILITY & GOVERNANCE
    DATA GOVERNANCE TO ENHANCE VISIBILITY AND TRANSPARENCY FOR INCREASED SECURITY
  • 7.4 FRAUD PREVENTION & THIRD-PARTY RISK MANAGEMENT
    FRAUD PREVENTION AND ADVANCED RISK MANAGEMENT TO BOLSTER MARKET GROWTH
SUPPLY CHAIN SECURITY MARKET, BY ORGANIZATION SIZE
136
  • 8.1 INTRODUCTION
    ORGANIZATION SIZES: MARKET DRIVERS
  • 8.2 SMALL AND MEDIUM-SIZED ENTERPRISES
    GOVERNMENT TO PROMOTE SUPPLY CHAIN SECURITY SOLUTIONS AMONG SMALL AND MEDIUM-SIZED ENTERPRISES
  • 8.3 LARGE ENTERPRISES
    SUPPLY CHAIN SECURITY SOLUTIONS TO PREVENT CYBERATTACKS, DATA THEFTS, AND UNAUTHORIZED ACCESS
SUPPLY CHAIN SECURITY MARKET, BY APPLICATION AREA
141
  • 9.1 INTRODUCTION
    APPLICATION AREAS: MARKET DRIVERS
  • 9.2 HEALTHCARE & PHARMACEUTICALS
    NEED TO REDUCE MISSED DELIVERY DUE TO WEAK SUPPLY CHAIN SECURITY TO BOOST MARKET GROWTH
  • 9.3 FMCG
    SUPPLY CHAIN SECURITY SOLUTIONS TO PROVIDE REAL-TIME VISIBILITY AND PREVENT CYBERATTACKS
  • 9.4 CHEMICALS
    LOGISTICS TO REPRESENT HIGH COSTS DUE TO DISTANT LOCATIONS
  • 9.5 RETAIL & ECOMMERCE
    RISE IN OMNICHANNEL RETAILING, ECOMMERCE, AND MOBILITY TO FOSTER MARKET GROWTH
  • 9.6 AUTOMOTIVE
    SHIFTING MARKET CONDITIONS, LIBERALIZATION, COST PRESSURE, AND INFUSION OF TRENDING TECHNOLOGIES TO DRIVE MARKET
  • 9.7 OTHER APPLICATION AREAS
SUPPLY CHAIN SECURITY MARKET, BY REGION
151
  • 10.1 INTRODUCTION
  • 10.2 NORTH AMERICA
    NORTH AMERICA: MARKET DRIVERS
    NORTH AMERICA: MACROECONOMIC OUTLOOK
    US
    - Rapid technological advancements, robust infrastructure, and increasing demand for secure solutions to drive market
    CANADA
    - Strategic investments, technological innovations, and government initiatives chain to propel market
  • 10.3 EUROPE
    EUROPE: SUPPLY CHAIN SECURITY MARKET DRIVERS
    EUROPE: MACROECONOMIC OUTLOOK
    UK
    - Adoption of advanced technologies and rise in supply chain attacks to propel market
    GERMANY
    - Increased supply chain breaches to drive demand for supply chain security solutions
    FRANCE
    - Industrial and logistics projects to increase need for supply chain security solutions
    ITALY
    - Italy to strengthen supply chain security with sustainability, digital innovation, and labor law reform initiatives
    REST OF EUROPE
  • 10.4 ASIA PACIFIC
    ASIA PACIFIC: MARKET DRIVERS
    ASIA PACIFIC: MACROECONOMIC OUTLOOK
    CHINA
    - Rise of supply chain digitization, IT embracement, and data analysis growth to drive market
    JAPAN
    - New management culture termed Supply Chain Management 4.0 to fuel demand for market growth
    INDIA
    - Manufacturing and logistics sectors to integrate IoT, cloud computing, and AI/ML to secure supply chains
    SINGAPORE
    - Need to build resilient supply chains through innovations and strategies to foster market growth
    REST OF ASIA PACIFIC
  • 10.5 MIDDLE EAST & AFRICA
    MIDDLE EAST & AFRICA: SUPPLY CHAIN SECURITY MARKET DRIVERS
    MIDDLE EAST & AFRICA: MACROECONOMIC OUTLOOK
    GCC COUNTRIES
    - Technological innovations and supply chain advancements to accelerate market growth
    - UAE
    - KSA
    - Rest of GCC Countries
    SOUTH AFRICA
    - Increased online purchases to intensify management and security of supply chains to drive market
    REST OF MIDDLE EAST & AFRICA
  • 10.6 LATIN AMERICA
    LATIN AMERICA: SUPPLY CHAIN SECURITY MARKET DRIVERS
    LATIN AMERICA: MACROECONOMIC OUTLOOK
    BRAZIL
    - Rising cyberattacks on food and medical supply chain to drive market
    MEXICO
    - Border uncertainties, inadequate warehouse capacity, and security concerns to lead to increasing demand for supply chain security
    REST OF LATIN AMERICA
COMPETITIVE LANDSCAPE
240
  • 11.1 KEY PLAYER STRATEGIES/RIGHT TO WIN
  • 11.2 BRAND COMPARISON
  • 11.3 COMPANY VALUATION AND FINANCIAL METRICS
    COMPANY VALUATION
    FINANCIAL METRICS
  • 11.4 REVENUE ANALYSIS, 2019–2023
  • 11.5 MARKET SHARE ANALYSIS, 2023
  • 11.6 COMPANY EVALUATION MATRIX: KEY PLAYERS, 2023
    STARS
    EMERGING LEADERS
    PERVASIVE PLAYERS
    PARTICIPANTS
    COMPANY FOOTPRINT: KEY PLAYERS, 2023
    - Company footprint
    - Regional footprint
    - Offering footprint
    - Security type footprint
    - Vertical footprint
  • 11.7 COMPANY EVALUATION MATRIX: START-UPS/SMES, 2023
    PROGRESSIVE COMPANIES
    RESPONSIVE COMPANIES
    DYNAMIC COMPANIES
    STARTING BLOCKS
    COMPETITIVE BENCHMARKING: KEY START-UPS/SMES
    - Detailed list of key start-ups/SMEs
    - Competitive benchmarking of key start-ups/SMEs
  • 11.8 COMPETITIVE SCENARIO AND TRENDS
    PRODUCT LAUNCHES & ENHANCEMENTS
    DEALS
COMPANY PROFILES
268
  • 12.1 INTRODUCTION
  • 12.2 KEY PLAYERS
    IBM
    - Business overview
    - Products/Solutions/Services offered
    - Recent developments
    - MnM view
    EMERSON
    - Business overview
    - Products/Solutions/Services offered
    - Recent developments
    - MnM view
    ORACLE
    - Business overview
    - Products/Solutions/Services offered
    - Recent developments
    - MnM view
    NXP SEMICONDUCTORS
    - Business overview
    - Products/Solutions/Services offered
    - Recent developments
    - MnM view
    TESTO
    - Business overview
    - Products/Solutions/Services offered
    - MnM view
    ORBCOMM
    - Business overview
    - Products/Solutions/Services offered
    - Recent developments
    SENSITECH
    - Business overview
    - Products/Solutions/Services offered
    - Recent developments
    ELPRO
    - Business overview
    - Products/Solutions/Services offered
    - Recent developments
    ROTRONIC
    - Business overview
    - Products/Solutions/Services offered
    BERLINGER & CO. AG
    - Business overview
    - Products/Solutions/Services offered
    - Recent developments
  • 12.3 OTHER KEY PLAYERS
    MONNIT
    COLD CHAIN TECHNOLOGIES
    LOGTAG RECORDERS
    DICKSON
    SIGNATROL
    HANWELL SOLUTIONS
    CONTROLANT
    ROAMBEE
    OMEGA COMPLIANCE
    TAGBOX SOLUTIONS
    C2A SECURITY
    SAFETRACES
    TIVE
    ALTANA AI
    FOURKITES
ADJACENT MARKETS
323
  • 13.1 INTRODUCTION
  • 13.2 LIMITATIONS
  • 13.3 SUPPLY CHAIN SECURITY MARKET ECOSYSTEM AND ADJACENT MARKETS
  • 13.4 SUPPLY CHAIN MANAGEMENT MARKET
    SUPPLY CHAIN MANAGEMENT MARKET, BY COMPONENT
    SUPPLY CHAIN MANAGEMENT MARKET, BY DEPLOYMENT MODE
    SUPPLY CHAIN MANAGEMENT MARKET, BY ORGANIZATION SIZE
    SUPPLY CHAIN MANAGEMENT MARKET, BY VERTICAL
    SUPPLY CHAIN MANAGEMENT MARKET, BY REGION
  • 13.5 COLD CHAIN MONITORING MARKET
    COLD CHAIN MONITORING MARKET, BY TEMPERATURE TYPE
    COLD CHAIN MONITORING MARKET, BY OFFERING
    COLD CHAIN MONITORING MARKET, BY LOGISTIC
    COLD CHAIN MONITORING MARKET, BY APPLICATION
    COLD CHAIN MONITORING MARKET, BY REGION
APPENDIX
331
  • 14.1 DISCUSSION GUIDE
  • 14.2 KNOWLEDGESTORE: MARKETSANDMARKETS’ SUBSCRIPTION PORTAL
  • 14.3 CUSTOMIZATION OPTIONS
  • 14.4 RELATED REPORTS
  • 14.5 AUTHOR DETAILS
LIST OF TABLES
 
  • TABLE 1 USD EXCHANGE RATES, 2019–2023
  • TABLE 2 FACTOR ANALYSIS
  • TABLE 3 SUPPLY CHAIN SECURITY MARKET GROWTH, 2024–2030 (USD MILLION, Y-O-Y)
  • TABLE 4 MARKET: ECOSYSTEM
  • TABLE 5 PORTER’S FIVE FORCES’ IMPACT ON MARKET
  • TABLE 6 AVERAGE SELLING PRICE OF PRODUCT, BY KEY PLAYER, 2024
  • TABLE 7 INDICATIVE PRICING ANALYSIS OF PRODUCT, BY KEY PLAYER, 2024
  • TABLE 8 TARIFFS RELATED TO SUPPLY CHAIN SECURITY PRODUCTS, 2023
  • TABLE 9 NORTH AMERICA: LIST OF REGULATORY BODIES, GOVERNMENT AGENCIES, AND OTHER ORGANIZATIONS
  • TABLE 10 EUROPE: LIST OF REGULATORY BODIES, GOVERNMENT AGENCIES, AND OTHER ORGANIZATIONS
  • TABLE 11 ASIA PACIFIC: LIST OF REGULATORY BODIES, GOVERNMENT AGENCIES, AND OTHER ORGANIZATIONS
  • TABLE 12 REST OF THE WORLD: LIST OF REGULATORY BODIES, GOVERNMENT AGENCIES, AND OTHER ORGANIZATIONS
  • TABLE 13 INFLUENCE OF STAKEHOLDERS ON BUYING PROCESS FOR TOP THREE VERTICALS
  • TABLE 14 INFLUENCE OF BUYING CRITERIA ON TOP THREE INDUSTRY VERTICALS IN SUPPLY CHAIN SECURITY MARKET
  • TABLE 15 MARKET: LIST OF CONFERENCES AND EVENTS, 2025–2026
  • TABLE 16 MARKET, BY OFFERING, 2018–2023 (USD MILLION)
  • TABLE 17 MARKET, BY OFFERING, 2024–2030 (USD MILLION)
  • TABLE 18 HARDWARE COMPONENTS: MARKET, BY REGION, 2018–2023 (USD MILLION)
  • TABLE 19 HARDWARE COMPONENTS: MARKET, BY REGION, 2024–2030 (USD MILLION)
  • TABLE 20 MARKET, BY HARDWARE COMPONENT, 2018–2023 (USD MILLION)
  • TABLE 21 MARKET, BY HARDWARE COMPONENT, 2024–2030 (USD MILLION)
  • TABLE 22 IOT SENSORS & DEVICES: SUPPLY CHAIN SECURITY MARKET, BY REGION, 2018–2023 (USD MILLION)
  • TABLE 23 IOT SENSORS & DEVICES: MARKET, BY REGION, 2024–2030 (USD MILLION)
  • TABLE 24 RFID TAGS & READERS: MARKET, BY REGION, 2018–2023 (USD MILLION)
  • TABLE 25 RFID TAGS & READERS: MARKET, BY REGION, 2024–2030 (USD MILLION)
  • TABLE 26 GPS TRACKERS: MARKET, BY REGION, 2018–2023 (USD MILLION)
  • TABLE 27 GPS TRACKERS: MARKET, BY REGION, 2024–2030 (USD MILLION)
  • TABLE 28 NETWORK SECURITY HARDWARE: MARKET, BY REGION, 2018–2023 (USD MILLION)
  • TABLE 29 NETWORK SECURITY HARDWARE: MARKET, BY REGION, 2024–2030 (USD MILLION)
  • TABLE 30 MARKET, BY SOFTWARE SOLUTION, 2018–2023 (USD MILLION)
  • TABLE 31 MARKET, BY SOFTWARE SOLUTION, 2024–2030 (USD MILLION)
  • TABLE 32 RISK MANAGEMENT PLATFORMS: MARKET, BY REGION, 2018–2023 (USD MILLION)
  • TABLE 33 RISK MANAGEMENT PLATFORMS: MARKET, BY REGION, 2024–2030 (USD MILLION)
  • TABLE 34 THREAT INTELLIGENCE SYSTEMS: MARKET, BY REGION, 2018–2023 (USD MILLION)
  • TABLE 35 THREAT INTELLIGENCE SYSTEMS: MARKET, BY REGION, 2024–2030 (USD MILLION)
  • TABLE 36 BLOCKCHAIN-BASED SOLUTIONS: MARKET, BY REGION, 2018–2023 (USD MILLION)
  • TABLE 37 BLOCKCHAIN-BASED SOLUTIONS: MARKET, BY REGION, 2024–2030 (USD MILLION)
  • TABLE 38 SUPPLY CHAIN VISIBILITY TOOLS: MARKET, BY REGION, 2018–2023 (USD MILLION)
  • TABLE 39 SUPPLY CHAIN VISIBILITY TOOLS: MARKET, BY REGION, 2024–2030 (USD MILLION)
  • TABLE 40 MARKET, BY SERVICE, 2018–2023 (USD MILLION)
  • TABLE 41 MARKET, BY SERVICE, 2024–2030 (USD MILLION)
  • TABLE 42 TRAINING & CONSULTING: SUPPLY CHAIN SECURITY MARKET, BY REGION, 2018–2023 (USD MILLION)
  • TABLE 43 TRAINING & CONSULTING: MARKET, BY REGION, 2024–2030 (USD MILLION)
  • TABLE 44 INTEGRATION & DEPLOYMENT: MARKET, BY REGION, 2018–2023 (USD MILLION)
  • TABLE 45 INTEGRATION & DEPLOYMENT: MARKET, BY REGION, 2024–2030 (USD MILLION)
  • TABLE 46 SUPPORT & MAINTENANCE: MARKET, BY REGION, 2018–2023 (USD MILLION)
  • TABLE 47 SUPPORT & MAINTENANCE: MARKET, BY REGION, 2024–2030 (USD MILLION)
  • TABLE 48 MANAGED SERVICES: MARKET, BY REGION, 2018–2023 (USD MILLION)
  • TABLE 49 MANAGED SERVICES: MARKET, BY REGION, 2024–2030 (USD MILLION)
  • TABLE 50 MARKET, BY SECURITY TYPE, 2018–2023 (USD MILLION)
  • TABLE 51 MARKET, BY SECURITY TYPE, 2024–2030 (USD MILLION)
  • TABLE 52 DATA LOCALITY & PROTECTION: MARKET, BY REGION, 2018–2023 (USD MILLION)
  • TABLE 53 DATA LOCALITY & PROTECTION: MARKET, BY REGION, 2024–2030 (USD MILLION)
  • TABLE 54 DATA VISIBILITY & GOVERNANCE: MARKET, BY REGION, 2018–2023 (USD MILLION)
  • TABLE 55 DATA VISIBILITY & GOVERNANCE: MARKET, BY REGION, 2024–2030 (USD MILLION)
  • TABLE 56 FRAUD PREVENTION & THIRD-PARTY RISK MANAGEMENT: MARKET, BY REGION, 2018–2023 (USD MILLION)
  • TABLE 57 FRAUD PREVENTION & THIRD-PARTY RISK MANAGEMENT: MARKET, BY REGION, 2024–2030 (USD MILLION)
  • TABLE 58 SUPPLY CHAIN SECURITY MARKET, BY ORGANIZATION SIZE, 2018–2023 (USD MILLION)
  • TABLE 59 MARKET, BY ORGANIZATION SIZE, 2024–2030 (USD MILLION)
  • TABLE 60 SMALL & MEDIUM-SIZED ENTERPRISES: MARKET, BY REGION, 2018–2023 (USD MILLION)
  • TABLE 61 SMALL & MEDIUM-SIZED ENTERPRISES: MARKET, BY REGION, 2024–2030 (USD MILLION)
  • TABLE 62 LARGE ENTERPRISES: MARKET, BY REGION, 2018–2023 (USD MILLION)
  • TABLE 63 LARGE ENTERPRISES: MARKET, BY REGION, 2024–2030 (USD MILLION)
  • TABLE 64 MARKET, BY APPLICATION AREA, 2018–2023 (USD MILLION)
  • TABLE 65 MARKET, BY APPLICATION AREA, 2024–2030 (USD MILLION)
  • TABLE 66 HEALTHCARE & PHARMACEUTICALS: MARKET, BY REGION, 2018–2023 (USD MILLION)
  • TABLE 67 HEALTHCARE & PHARMACEUTICALS: MARKET, BY REGION, 2024–2030 (USD MILLION)
  • TABLE 68 FMCG: MARKET, BY REGION, 2018–2023 (USD MILLION)
  • TABLE 69 FMCG: MARKET, BY REGION, 2024–2030 (USD MILLION)
  • TABLE 70 CHEMICALS: SUPPLY CHAIN SECURITY MARKET, BY REGION, 2018–2023 (USD MILLION)
  • TABLE 71 CHEMICALS: MARKET, BY REGION, 2024–2030 (USD MILLION)
  • TABLE 72 RETAIL & ECOMMERCE: MARKET, BY REGION, 2018–2023 (USD MILLION)
  • TABLE 73 RETAIL & ECOMMERCE: MARKET, BY REGION, 2024–2030 (USD MILLION)
  • TABLE 74 AUTOMOTIVE: MARKET, BY REGION, 2018–2023 (USD MILLION)
  • TABLE 75 AUTOMOTIVE: MARKET, BY REGION, 2024–2030 (USD MILLION)
  • TABLE 76 OTHER APPLICATION AREAS: MARKET, BY REGION, 2018–2023 (USD MILLION)
  • TABLE 77 OTHER APPLICATION AREAS: MARKET, BY REGION, 2024–2030 (USD MILLION)
  • TABLE 78 MARKET, BY REGION, 2018–2023 (USD MILLION)
  • TABLE 79 MARKET, BY REGION, 2024–2030 (USD MILLION)
  • TABLE 80 NORTH AMERICA: SUPPLY CHAIN SECURITY MARKET, BY OFFERING, 2018–2023 (USD MILLION)
  • TABLE 81 NORTH AMERICA: MARKET, BY OFFERING, 2024–2030 (USD MILLION)
  • TABLE 82 NORTH AMERICA: MARKET, BY HARDWARE COMPONENT, 2018–2023 (USD MILLION)
  • TABLE 83 NORTH AMERICA: MARKET, BY HARDWARE COMPONENT, 2024–2030 (USD MILLION)
  • TABLE 84 NORTH AMERICA: MARKET, BY SOFTWARE SOLUTION, 2018–2023 (USD MILLION)
  • TABLE 85 NORTH AMERICA: MARKET, BY SOFTWARE SOLUTION, 2024–2030 (USD MILLION)
  • TABLE 86 NORTH AMERICA: MARKET, BY SERVICE, 2018–2023 (USD MILLION)
  • TABLE 87 NORTH AMERICA: MARKET, BY SERVICE, 2024–2030 (USD MILLION)
  • TABLE 88 NORTH AMERICA: MARKET, BY SECURITY TYPE, 2018–2023 (USD MILLION)
  • TABLE 89 NORTH AMERICA: MARKET, BY SECURITY TYPE, 2024–2030 (USD MILLION)
  • TABLE 90 NORTH AMERICA: MARKET, BY ORGANIZATION SIZE, 2018–2023 (USD MILLION)
  • TABLE 91 NORTH AMERICA: MARKET, BY ORGANIZATION SIZE, 2024–2030 (USD MILLION)
  • TABLE 92 NORTH AMERICA: MARKET, BY APPLICATION AREA, 2018–2023 (USD MILLION)
  • TABLE 93 NORTH AMERICA: MARKET, BY APPLICATION AREA, 2024–2030 (USD MILLION)
  • TABLE 94 NORTH AMERICA: SUPPLY CHAIN SECURITY, BY COUNTRY, 2018–2023 (USD MILLION)
  • TABLE 95 NORTH AMERICA: SUPPLY CHAIN SECURITY, BY COUNTRY, 2024–2030 (USD MILLION)
  • TABLE 96 US: SUPPLY CHAIN SECURITY MARKET, BY OFFERING, 2018–2023 (USD MILLION)
  • TABLE 97 US: MARKET, BY OFFERING, 2024–2030 (USD MILLION)
  • TABLE 98 US: MARKET, BY SECURITY TYPE, 2018–2023 (USD MILLION)
  • TABLE 99 US: MARKET, BY SECURITY TYPE, 2024–2030 (USD MILLION)
  • TABLE 100 US: MARKET, BY ORGANIZATION SIZE, 2018–2023 (USD MILLION)
  • TABLE 101 US: MARKET, BY ORGANIZATION SIZE, 2024–2030 (USD MILLION)
  • TABLE 102 US: MARKET, BY APPLICATION AREA, 2018–2023 (USD MILLION)
  • TABLE 103 US: MARKET, BY APPLICATION AREA, 2024–2030 (USD MILLION)
  • TABLE 104 CANADA: MARKET, BY OFFERING, 2018–2023 (USD MILLION)
  • TABLE 105 CANADA: MARKET, BY OFFERING, 2024–2030 (USD MILLION)
  • TABLE 106 CANADA: MARKET, BY SECURITY TYPE, 2018–2023 (USD MILLION)
  • TABLE 107 CANADA: MARKET, BY SECURITY TYPE, 2024–2030 (USD MILLION)
  • TABLE 108 CANADA: MARKET, BY ORGANIZATION SIZE, 2018–2023 (USD MILLION)
  • TABLE 109 CANADA: MARKET, BY ORGANIZATION SIZE, 2024–2030 (USD MILLION)
  • TABLE 110 CANADA: MARKET, BY APPLICATION AREA, 2018–2023 (USD MILLION)
  • TABLE 111 CANADA: MARKET, BY APPLICATION AREA, 2024–2030 (USD MILLION)
  • TABLE 112 EUROPE: SUPPLY CHAIN SECURITY MARKET, BY OFFERING, 2018–2023 (USD MILLION)
  • TABLE 113 EUROPE: MARKET, BY OFFERING, 2024–2030 (USD MILLION)
  • TABLE 114 EUROPE: MARKET, BY HARDWARE COMPONENT, 2018–2023 (USD MILLION)
  • TABLE 115 EUROPE: MARKET, BY HARDWARE COMPONENT, 2024–2030 (USD MILLION)
  • TABLE 116 EUROPE: MARKET, BY SOFTWARE SOLUTION, 2018–2023 (USD MILLION)
  • TABLE 117 EUROPE: MARKET, BY SOFTWARE SOLUTION, 2024–2030 (USD MILLION)
  • TABLE 118 EUROPE: MARKET, BY SERVICE, 2018–2023 (USD MILLION)
  • TABLE 119 EUROPE: MARKET, BY SERVICE, 2024–2030 (USD MILLION)
  • TABLE 120 EUROPE: MARKET, BY SECURITY TYPE, 2018–2023 (USD MILLION)
  • TABLE 121 EUROPE: MARKET, BY SECURITY TYPE, 2024–2030 (USD MILLION)
  • TABLE 122 EUROPE: MARKET, BY ORGANIZATION SIZE, 2018–2023 (USD MILLION)
  • TABLE 123 EUROPE: MARKET, BY ORGANIZATION SIZE, 2024–2030 (USD MILLION)
  • TABLE 124 EUROPE: MARKET, BY APPLICATION AREA, 2018–2023 (USD MILLION)
  • TABLE 125 EUROPE: MARKET, BY APPLICATION AREA, 2024–2030 (USD MILLION)
  • TABLE 126 EUROPE: SUPPLY CHAIN SECURITY, BY COUNTRY, 2018–2023 (USD MILLION)
  • TABLE 127 EUROPE: SUPPLY CHAIN SECURITY, BY COUNTRY, 2024–2030 (USD MILLION)
  • TABLE 128 UK: SUPPLY CHAIN SECURITY MARKET, BY OFFERING, 2018–2023 (USD MILLION)
  • TABLE 129 UK: MARKET, BY OFFERING, 2024–2030 (USD MILLION)
  • TABLE 130 UK: MARKET, BY SECURITY TYPE, 2018–2023 (USD MILLION)
  • TABLE 131 UK: MARKET, BY SECURITY TYPE, 2024–2030 (USD MILLION)
  • TABLE 132 UK: MARKET, BY ORGANIZATION SIZE, 2018–2023 (USD MILLION)
  • TABLE 133 UK: MARKET, BY ORGANIZATION SIZE, 2024–2030 (USD MILLION)
  • TABLE 134 UK: MARKET, BY APPLICATION AREA, 2018–2023 (USD MILLION)
  • TABLE 135 UK: MARKET, BY APPLICATION AREA, 2024–2030 (USD MILLION)
  • TABLE 136 GERMANY: SUPPLY CHAIN SECURITY MARKET, BY OFFERING, 2018–2023 (USD MILLION)
  • TABLE 137 GERMANY: MARKET, BY OFFERING, 2024–2030 (USD MILLION)
  • TABLE 138 GERMANY: MARKET, BY SECURITY TYPE, 2018–2023 (USD MILLION)
  • TABLE 139 GERMANY: MARKET, BY SECURITY TYPE, 2024–2030 (USD MILLION)
  • TABLE 140 GERMANY: MARKET, BY ORGANIZATION SIZE, 2018–2023 (USD MILLION)
  • TABLE 141 GERMANY: MARKET, BY ORGANIZATION SIZE, 2024–2030 (USD MILLION)
  • TABLE 142 GERMANY: MARKET, BY APPLICATION AREA, 2018–2023 (USD MILLION)
  • TABLE 143 GERMANY: MARKET, BY APPLICATION AREA, 2024–2030 (USD MILLION)
  • TABLE 144 FRANCE: MARKET, BY OFFERING, 2018–2023 (USD MILLION)
  • TABLE 145 FRANCE: MARKET, BY OFFERING, 2024–2030 (USD MILLION)
  • TABLE 146 FRANCE: MARKET, BY SECURITY TYPE, 2018–2023 (USD MILLION)
  • TABLE 147 FRANCE: MARKET, BY SECURITY TYPE, 2024–2030 (USD MILLION)
  • TABLE 148 FRANCE: MARKET, BY ORGANIZATION SIZE, 2018–2023 (USD MILLION)
  • TABLE 149 FRANCE: MARKET, BY ORGANIZATION SIZE, 2024–2030 (USD MILLION)
  • TABLE 150 FRANCE: MARKET, BY APPLICATION AREA, 2018–2023 (USD MILLION)
  • TABLE 151 FRANCE: MARKET, BY APPLICATION AREA, 2024–2030 (USD MILLION)
  • TABLE 152 ITALY: SUPPLY CHAIN SECURITY MARKET, BY OFFERING, 2018–2023 (USD MILLION)
  • TABLE 153 ITALY: MARKET, BY OFFERING, 2024–2030 (USD MILLION)
  • TABLE 154 ITALY: MARKET, BY SECURITY TYPE, 2018–2023 (USD MILLION)
  • TABLE 155 ITALY: MARKET, BY SECURITY TYPE, 2024–2030 (USD MILLION)
  • TABLE 156 ITALY: MARKET, BY ORGANIZATION SIZE, 2018–2023 (USD MILLION)
  • TABLE 157 ITALY: MARKET, BY ORGANIZATION SIZE, 2024–2030 (USD MILLION)
  • TABLE 158 ITALY: MARKET, BY APPLICATION AREA, 2018–2023 (USD MILLION)
  • TABLE 159 ITALY: MARKET, BY APPLICATION AREA, 2024–2030 (USD MILLION)
  • TABLE 160 REST OF EUROPE: MARKET, BY OFFERING, 2018–2023 (USD MILLION)
  • TABLE 161 REST OF EUROPE: MARKET, BY OFFERING, 2024–2030 (USD MILLION)
  • TABLE 162 REST OF EUROPE: MARKET, BY SECURITY TYPE, 2018–2023 (USD MILLION)
  • TABLE 163 REST OF EUROPE: MARKET, BY SECURITY TYPE, 2024–2030 (USD MILLION)
  • TABLE 164 REST OF EUROPE: MARKET, BY ORGANIZATION SIZE, 2018–2023 (USD MILLION)
  • TABLE 165 REST OF EUROPE: MARKET, BY ORGANIZATION SIZE, 2024–2030 (USD MILLION)
  • TABLE 166 REST OF EUROPE: MARKET, BY APPLICATION AREA, 2018–2023 (USD MILLION)
  • TABLE 167 REST OF EUROPE: MARKET, BY APPLICATION AREA, 2024–2030 (USD MILLION)
  • TABLE 168 ASIA PACIFIC: SUPPLY CHAIN SECURITY MARKET, BY OFFERING, 2018–2023 (USD MILLION)
  • TABLE 169 ASIA PACIFIC: MARKET, BY OFFERING, 2024–2030 (USD MILLION)
  • TABLE 170 ASIA PACIFIC: MARKET, BY HARDWARE COMPONENT, 2018–2023 (USD MILLION)
  • TABLE 171 ASIA PACIFIC: MARKET, BY HARDWARE COMPONENT, 2024–2030 (USD MILLION)
  • TABLE 172 ASIA PACIFIC: MARKET, BY SOFTWARE SOLUTION, 2018–2023 (USD MILLION)
  • TABLE 173 ASIA PACIFIC: MARKET, BY SOFTWARE SOLUTION, 2024–2030 (USD MILLION)
  • TABLE 174 ASIA PACIFIC: MARKET, BY SERVICE, 2018–2023 (USD MILLION)
  • TABLE 175 ASIA PACIFIC: MARKET, BY SERVICE, 2024–2030 (USD MILLION)
  • TABLE 176 ASIA PACIFIC: MARKET, BY SECURITY TYPE, 2018–2023 (USD MILLION)
  • TABLE 177 ASIA PACIFIC: MARKET, BY SECURITY TYPE, 2024–2030 (USD MILLION)
  • TABLE 178 ASIA PACIFIC: MARKET, BY ORGANIZATION SIZE, 2018–2023 (USD MILLION)
  • TABLE 179 ASIA PACIFIC: MARKET, BY ORGANIZATION SIZE, 2024–2030 (USD MILLION)
  • TABLE 180 ASIA PACIFIC: MARKET, BY APPLICATION AREA, 2018–2023 (USD MILLION)
  • TABLE 181 ASIA PACIFIC: MARKET, BY APPLICATION AREA, 2024–2030 (USD MILLION)
  • TABLE 182 ASIA PACIFIC: SUPPLY CHAIN SECURITY, BY COUNTRY, 2018–2023 (USD MILLION)
  • TABLE 183 ASIA PACIFIC: SUPPLY CHAIN SECURITY, BY COUNTRY, 2024–2030 (USD MILLION)
  • TABLE 184 CHINA: SUPPLY CHAIN SECURITY MARKET, BY OFFERING, 2018–2023 (USD MILLION)
  • TABLE 185 CHINA: MARKET, BY OFFERING, 2024–2030 (USD MILLION)
  • TABLE 186 CHINA: MARKET, BY SECURITY TYPE, 2018–2023 (USD MILLION)
  • TABLE 187 CHINA: MARKET, BY SECURITY TYPE, 2024–2030 (USD MILLION)
  • TABLE 188 CHINA: MARKET, BY ORGANIZATION SIZE, 2018–2023 (USD MILLION)
  • TABLE 189 CHINA: MARKET, BY ORGANIZATION SIZE, 2024–2030 (USD MILLION)
  • TABLE 190 CHINA: MARKET, BY APPLICATION AREA, 2018–2023 (USD MILLION)
  • TABLE 191 CHINA: MARKET, BY APPLICATION AREA, 2024–2030 (USD MILLION)
  • TABLE 192 JAPAN: MARKET, BY OFFERING, 2018–2023 (USD MILLION)
  • TABLE 193 JAPAN: MARKET, BY OFFERING, 2024–2030 (USD MILLION)
  • TABLE 194 JAPAN: MARKET, BY SECURITY TYPE, 2018–2023 (USD MILLION)
  • TABLE 195 JAPAN: MARKET, BY SECURITY TYPE, 2024–2030 (USD MILLION)
  • TABLE 196 JAPAN: MARKET, BY ORGANIZATION SIZE, 2018–2023 (USD MILLION)
  • TABLE 197 JAPAN: MARKET, BY ORGANIZATION SIZE, 2024–2030 (USD MILLION)
  • TABLE 198 JAPAN: MARKET, BY APPLICATION AREA, 2018–2023 (USD MILLION)
  • TABLE 199 JAPAN: MARKET, BY APPLICATION AREA, 2024–2030 (USD MILLION)
  • TABLE 200 INDIA: MARKET, BY OFFERING, 2018–2023 (USD MILLION)
  • TABLE 201 INDIA: MARKET, BY OFFERING, 2024–2030 (USD MILLION)
  • TABLE 202 INDIA: MARKET, BY SECURITY TYPE, 2018–2023 (USD MILLION)
  • TABLE 203 INDIA: MARKET, BY SECURITY TYPE, 2024–2030 (USD MILLION)
  • TABLE 204 INDIA: MARKET, BY ORGANIZATION SIZE, 2018–2023 (USD MILLION)
  • TABLE 205 INDIA: MARKET, BY ORGANIZATION SIZE, 2024–2030 (USD MILLION)
  • TABLE 206 INDIA: MARKET, BY APPLICATION AREA, 2018–2023 (USD MILLION)
  • TABLE 207 INDIA: MARKET, BY APPLICATION AREA, 2024–2030 (USD MILLION)
  • TABLE 208 SINGAPORE: SUPPLY CHAIN SECURITY MARKET, BY OFFERING, 2018–2023 (USD MILLION)
  • TABLE 209 SINGAPORE: MARKET, BY OFFERING, 2024–2030 (USD MILLION)
  • TABLE 210 SINGAPORE: MARKET, BY SECURITY TYPE, 2018–2023 (USD MILLION)
  • TABLE 211 SINGAPORE: MARKET, BY SECURITY TYPE, 2024–2030 (USD MILLION)
  • TABLE 212 SINGAPORE: MARKET, BY ORGANIZATION SIZE, 2018–2023 (USD MILLION)
  • TABLE 213 SINGAPORE: MARKET, BY ORGANIZATION SIZE, 2024–2030 (USD MILLION)
  • TABLE 214 SINGAPORE: MARKET, BY APPLICATION AREA, 2018–2023 (USD MILLION)
  • TABLE 215 SINGAPORE: MARKET, BY APPLICATION AREA, 2024–2030 (USD MILLION)
  • TABLE 216 REST OF ASIA PACIFIC: MARKET, BY OFFERING, 2018–2023 (USD MILLION)
  • TABLE 217 REST OF ASIA PACIFIC: MARKET, BY OFFERING, 2024–2030 (USD MILLION)
  • TABLE 218 REST OF ASIA PACIFIC: MARKET, BY SECURITY TYPE, 2018–2023 (USD MILLION)
  • TABLE 219 REST OF ASIA PACIFIC: MARKET, BY SECURITY TYPE, 2024–2030 (USD MILLION)
  • TABLE 220 REST OF ASIA PACIFIC: MARKET, BY ORGANIZATION SIZE, 2018–2023 (USD MILLION)
  • TABLE 221 REST OF ASIA PACIFIC: MARKET, BY ORGANIZATION SIZE, 2024–2030 (USD MILLION)
  • TABLE 222 REST OF ASIA PACIFIC: MARKET, BY APPLICATION AREA, 2018–2023 (USD MILLION)
  • TABLE 223 REST OF ASIA PACIFIC: MARKET, BY APPLICATION AREA, 2024–2030 (USD MILLION)
  • TABLE 224 MIDDLE EAST & AFRICA: SUPPLY CHAIN SECURITY MARKET, BY OFFERING, 2018–2023 (USD MILLION)
  • TABLE 225 MIDDLE EAST & AFRICA: MARKET, BY OFFERING, 2024–2030 (USD MILLION)
  • TABLE 226 MIDDLE EAST & AFRICA: MARKET, BY HARDWARE COMPONENT, 2018–2023 (USD MILLION)
  • TABLE 227 MIDDLE EAST & AFRICA: MARKET, BY HARDWARE COMPONENT, 2024–2030 (USD MILLION)
  • TABLE 228 MIDDLE EAST & AFRICA: MARKET, BY SOFTWARE SOLUTION, 2018–2023 (USD MILLION)
  • TABLE 229 MIDDLE EAST & AFRICA: MARKET, BY SOFTWARE SOLUTION, 2024–2030 (USD MILLION)
  • TABLE 230 MIDDLE EAST & AFRICA: MARKET, BY SERVICE, 2018–2023 (USD MILLION)
  • TABLE 231 MIDDLE EAST & AFRICA: MARKET, BY SERVICE, 2024–2030 (USD MILLION)
  • TABLE 232 MIDDLE EAST & AFRICA: MARKET, BY SECURITY TYPE, 2018–2023 (USD MILLION)
  • TABLE 233 MIDDLE EAST & AFRICA: MARKET, BY SECURITY TYPE, 2024–2030 (USD MILLION)
  • TABLE 234 MIDDLE EAST & AFRICA: MARKET, BY ORGANIZATION SIZE, 2018–2023 (USD MILLION)
  • TABLE 235 MIDDLE EAST & AFRICA: MARKET, BY ORGANIZATION SIZE, 2024–2030 (USD MILLION)
  • TABLE 236 MIDDLE EAST & AFRICA: MARKET, BY APPLICATION AREA, 2018–2023 (USD MILLION)
  • TABLE 237 MIDDLE EAST & AFRICA: MARKET, BY APPLICATION AREA, 2024–2030 (USD MILLION)
  • TABLE 238 MIDDLE EAST & AFRICA: SUPPLY CHAIN SECURITY, BY COUNTRY, 2018–2023 (USD MILLION)
  • TABLE 239 MIDDLE EAST & AFRICA: SUPPLY CHAIN SECURITY, BY COUNTRY, 2024–2030 (USD MILLION)
  • TABLE 240 GCC COUNTRIES: SUPPLY CHAIN SECURITY MARKET, BY OFFERING, 2018–2023 (USD MILLION)
  • TABLE 241 GCC COUNTRIES: MARKET, BY OFFERING, 2024–2030 (USD MILLION)
  • TABLE 242 GCC COUNTRIES: MARKET, BY SECURITY TYPE, 2018–2023 (USD MILLION)
  • TABLE 243 GCC COUNTRIES: MARKET, BY SECURITY TYPE, 2024–2030 (USD MILLION)
  • TABLE 244 GCC COUNTRIES: MARKET, BY ORGANIZATION SIZE, 2018–2023 (USD MILLION)
  • TABLE 245 GCC COUNTRIES: MARKET, BY ORGANIZATION SIZE, 2024–2030 (USD MILLION)
  • TABLE 246 GCC COUNTRIES: MARKET, BY APPLICATION AREA, 2018–2023 (USD MILLION)
  • TABLE 247 GCC COUNTRIES: MARKET, BY APPLICATION AREA, 2024–2030 (USD MILLION)
  • TABLE 248 GCC COUNTRIES: SUPPLY CHAIN SECURITY, BY COUNTRY, 2018–2023 (USD MILLION)
  • TABLE 249 GCC COUNTRIES: SUPPLY CHAIN SECURITY, BY COUNTRY, 2024–2030 (USD MILLION)
  • TABLE 250 SOUTH AFRICA: SUPPLY CHAIN SECURITY MARKET, BY OFFERING, 2018–2023 (USD MILLION)
  • TABLE 251 SOUTH AFRICA: MARKET, BY OFFERING, 2024–2030 (USD MILLION)
  • TABLE 252 SOUTH AFRICA: MARKET, BY SECURITY TYPE, 2018–2023 (USD MILLION)
  • TABLE 253 SOUTH AFRICA: MARKET, BY SECURITY TYPE, 2024–2030 (USD MILLION)
  • TABLE 254 SOUTH AFRICA: MARKET, BY ORGANIZATION SIZE, 2018–2023 (USD MILLION)
  • TABLE 255 SOUTH AFRICA: MARKET, BY ORGANIZATION SIZE, 2024–2030 (USD MILLION)
  • TABLE 256 SOUTH AFRICA: MARKET, BY APPLICATION AREA, 2018–2023 (USD MILLION)
  • TABLE 257 SOUTH AFRICA: MARKET, BY APPLICATION AREA, 2024–2030 (USD MILLION)
  • TABLE 258 REST OF MIDDLE EAST & AFRICA: MARKET, BY OFFERING, 2018–2023 (USD MILLION)
  • TABLE 259 REST OF MIDDLE EAST & AFRICA: MARKET, BY OFFERING, 2024–2030 (USD MILLION)
  • TABLE 260 REST OF MIDDLE EAST & AFRICA: MARKET, BY SECURITY TYPE, 2018–2023 (USD MILLION)
  • TABLE 261 REST OF MIDDLE EAST & AFRICA: MARKET, BY SECURITY TYPE, 2024–2030 (USD MILLION)
  • TABLE 262 REST OF MIDDLE EAST & AFRICA: MARKET, BY ORGANIZATION SIZE, 2018–2023 (USD MILLION)
  • TABLE 263 REST OF MIDDLE EAST & AFRICA: MARKET, BY ORGANIZATION SIZE, 2024–2030 (USD MILLION)
  • TABLE 264 REST OF MIDDLE EAST & AFRICA: MARKET, BY APPLICATION AREA, 2018–2023 (USD MILLION)
  • TABLE 265 REST OF MIDDLE EAST & AFRICA: MARKET, BY APPLICATION AREA, 2024–2030 (USD MILLION)
  • TABLE 266 LATIN AMERICA: SUPPLY CHAIN SECURITY MARKET, BY OFFERING, 2018–2023 (USD MILLION)
  • TABLE 267 LATIN AMERICA: MARKET, BY OFFERING, 2024–2030 (USD MILLION)
  • TABLE 268 LATIN AMERICA: MARKET, BY HARDWARE COMPONENT, 2018–2023 (USD MILLION)
  • TABLE 269 LATIN AMERICA: MARKET, BY HARDWARE COMPONENT, 2024–2030 (USD MILLION)
  • TABLE 270 LATIN AMERICA: MARKET, BY SOFTWARE SOLUTION, 2018–2023 (USD MILLION)
  • TABLE 271 LATIN AMERICA: MARKET, BY SOFTWARE SOLUTION, 2024–2030 (USD MILLION)
  • TABLE 272 LATIN AMERICA: MARKET, BY SERVICE, 2018–2023 (USD MILLION)
  • TABLE 273 LATIN AMERICA: MARKET, BY SERVICE, 2024–2030 (USD MILLION)
  • TABLE 274 LATIN AMERICA: MARKET, BY SECURITY TYPE, 2018–2023 (USD MILLION)
  • TABLE 275 LATIN AMERICA: MARKET, BY SECURITY TYPE, 2024–2030 (USD MILLION)
  • TABLE 276 LATIN AMERICA: MARKET, BY ORGANIZATION SIZE, 2018–2023 (USD MILLION)
  • TABLE 277 LATIN AMERICA: MARKET, BY ORGANIZATION SIZE, 2024–2030 (USD MILLION)
  • TABLE 278 LATIN AMERICA: MARKET, BY APPLICATION AREA, 2018–2023 (USD MILLION)
  • TABLE 279 LATIN AMERICA: MARKET, BY APPLICATION AREA, 2024–2030 (USD MILLION)
  • TABLE 280 LATIN AMERICA: SUPPLY CHAIN SECURITY, BY COUNTRY, 2018–2023 (USD MILLION)
  • TABLE 281 LATIN AMERICA: SUPPLY CHAIN SECURITY, BY COUNTRY, 2024–2030 (USD MILLION)
  • TABLE 282 BRAZIL: SUPPLY CHAIN SECURITY MARKET, BY OFFERING, 2018–2023 (USD MILLION)
  • TABLE 283 BRAZIL: MARKET, BY OFFERING, 2024–2030 (USD MILLION)
  • TABLE 284 BRAZIL: MARKET, BY SECURITY TYPE, 2018–2023 (USD MILLION)
  • TABLE 285 BRAZIL: MARKET, BY SECURITY TYPE, 2024–2030 (USD MILLION)
  • TABLE 286 BRAZIL: MARKET, BY ORGANIZATION SIZE, 2018–2023 (USD MILLION)
  • TABLE 287 BRAZIL: MARKET, BY ORGANIZATION SIZE, 2024–2030 (USD MILLION)
  • TABLE 288 BRAZIL: MARKET, BY APPLICATION AREA, 2018–2023 (USD MILLION)
  • TABLE 289 BRAZIL: MARKET, BY APPLICATION AREA, 2024–2030 (USD MILLION)
  • TABLE 290 MEXICO: MARKET, BY OFFERING, 2018–2023 (USD MILLION)
  • TABLE 291 MEXICO: MARKET, BY OFFERING, 2024–2030 (USD MILLION)
  • TABLE 292 MEXICO: MARKET, BY SECURITY TYPE, 2018–2023 (USD MILLION)
  • TABLE 293 MEXICO: MARKET, BY SECURITY TYPE, 2024–2030 (USD MILLION)
  • TABLE 294 MEXICO: MARKET, BY ORGANIZATION SIZE, 2018–2023 (USD MILLION)
  • TABLE 295 MEXICO: MARKET, BY ORGANIZATION SIZE, 2024–2030 (USD MILLION)
  • TABLE 296 MEXICO: MARKET, BY APPLICATION AREA, 2018–2023 (USD MILLION)
  • TABLE 297 MEXICO: MARKET, BY APPLICATION AREA, 2024–2030 (USD MILLION)
  • TABLE 298 REST OF LATIN AMERICA: SUPPLY CHAIN SECURITY MARKET, BY OFFERING, 2018–2023 (USD MILLION)
  • TABLE 299 REST OF LATIN AMERICA: MARKET, BY OFFERING, 2024–2030 (USD MILLION)
  • TABLE 300 REST OF LATIN AMERICA: MARKET, BY SECURITY TYPE, 2018–2023 (USD MILLION)
  • TABLE 301 REST OF LATIN AMERICA: MARKET, BY SECURITY TYPE, 2024–2030 (USD MILLION)
  • TABLE 302 REST OF LATIN AMERICA: MARKET, BY ORGANIZATION SIZE, 2018–2023 (USD MILLION)
  • TABLE 303 REST OF LATIN AMERICA: MARKET, BY ORGANIZATION SIZE, 2024–2030 (USD MILLION)
  • TABLE 304 REST OF LATIN AMERICA: MARKET, BY APPLICATION AREA, 2018–2023 (USD MILLION)
  • TABLE 305 REST OF LATIN AMERICA: MARKET, BY APPLICATION AREA, 2024–2030 (USD MILLION)
  • TABLE 306 MARKET: DEGREE OF COMPETITION, 2023
  • TABLE 307 MARKET: REGIONAL FOOTPRINT
  • TABLE 308 MARKET: OFFERING FOOTPRINT
  • TABLE 309 MARKET: SECURITY TYPE FOOTPRINT
  • TABLE 310 MARKET: APPLICATION AREA FOOTPRINT
  • TABLE 311 DETAILED LIST OF KEY START-UPS/SMES
  • TABLE 312 COMPETITIVE BENCHMARKING OF KEY START-UPS/SMES
  • TABLE 313 MARKET: APPLICATION AREA FOOTPRINT OF KEY START-UPS/SMES
  • TABLE 314 MARKET: REGIONAL FOOTPRINT OF KEY START-UPS/SMES
  • TABLE 315 MARKET: PRODUCT LAUNCHES & ENHANCEMENTS, MARCH 2022–NOVEMBER 2024
  • TABLE 316 SUPPLY CHAIN SECURITY MARKET: DEALS, MARCH 2022–NOVEMBER 2024
  • TABLE 317 IBM: COMPANY OVERVIEW
  • TABLE 318 IBM: PRODUCTS/SOLUTIONS/SERVICES OFFERED
  • TABLE 319 IBM: PRODUCT LAUNCHES
  • TABLE 320 IBM: DEALS
  • TABLE 321 EMERSON: COMPANY OVERVIEW
  • TABLE 322 EMERSON: PRODUCTS/SOLUTIONS/SERVICES OFFERED
  • TABLE 323 EMERSON: PRODUCT LAUNCHES AND ENHANCEMENTS
  • TABLE 324 EMERSON: DEALS
  • TABLE 325 ORACLE: COMPANY OVERVIEW
  • TABLE 326 ORACLE: PRODUCTS/SOLUTIONS/SERVICES OFFERED
  • TABLE 327 ORACLE: PRODUCT ENHANCEMENTS
  • TABLE 328 ORACLE: DEALS
  • TABLE 329 NXP SEMICONDUCTORS: COMPANY OVERVIEW
  • TABLE 330 NXP SEMICONDUCTORS: PRODUCTS/SOLUTIONS/SERVICES OFFERED
  • TABLE 331 NXP SEMICONDUCTORS: PRODUCT LAUNCHES
  • TABLE 332 NXP SEMICONDUCTORS: DEALS
  • TABLE 333 TESTO: COMPANY OVERVIEW
  • TABLE 334 TESTO: PRODUCTS/SOLUTIONS/SERVICES OFFERED
  • TABLE 335 ORBCOMM: COMPANY OVERVIEW
  • TABLE 336 ORBCOMM: PRODUCTS/SOLUTIONS/SERVICES OFFERED
  • TABLE 337 ORBCOMM: PRODUCT LAUNCHES AND ENHANCEMENTS
  • TABLE 338 ORBCOMM: DEALS
  • TABLE 339 SENSITECH: COMPANY OVERVIEW
  • TABLE 340 SENSITECH: PRODUCTS/SOLUTIONS/SERVICES OFFERED
  • TABLE 341 SENSITECH: PRODUCT LAUNCHES AND ENHANCEMENTS
  • TABLE 342 SENSITECH: DEALS
  • TABLE 343 ELPRO: COMPANY OVERVIEW
  • TABLE 344 ELPRO: PRODUCTS/SOLUTIONS/SERVICES OFFERED
  • TABLE 345 ELPRO: PRODUCT LAUNCHES AND ENHANCEMENTS
  • TABLE 346 ELPRO: DEALS
  • TABLE 347 ROTRONIC: COMPANY OVERVIEW
  • TABLE 348 ROTRONIC: PRODUCTS/SOLUTIONS/SERVICES OFFERED
  • TABLE 349 BERLINGER & CO. AG: COMPANY OVERVIEW
  • TABLE 350 BERLINGER & CO. AG: PRODUCTS/SOLUTIONS/SERVICES OFFERED
  • TABLE 351 BERLINGER & CO. AG: DEALS
  • TABLE 352 ADJACENT MARKETS AND FORECASTS
  • TABLE 353 SUPPLY CHAIN MANAGEMENT MARKET, BY COMPONENT, 2014–2019 (USD MILLION)
  • TABLE 354 SUPPLY CHAIN MANAGEMENT MARKET, BY COMPONENT, 2019–2027 (USD MILLION)
  • TABLE 355 SUPPLY CHAIN MANAGEMENT MARKET, BY DEPLOYMENT MODE, 2014–2019 (USD MILLION)
  • TABLE 356 SUPPLY CHAIN MANAGEMENT MARKET, BY DEPLOYMENT MODE, 2019–2027 (USD MILLION)
  • TABLE 357 SUPPLY CHAIN MANAGEMENT MARKET, BY ORGANIZATION SIZE, 2014–2019 (USD MILLION)
  • TABLE 358 SUPPLY CHAIN MANAGEMENT MARKET, BY ORGANIZATION SIZE, 2019–2027 (USD MILLION)
  • TABLE 359 SUPPLY CHAIN MANAGEMENT MARKET, BY VERTICAL, 2014–2019 (USD MILLION)
  • TABLE 360 SUPPLY CHAIN MANAGEMENT MARKET, BY VERTICAL, 2019–2027 (USD MILLION)
  • TABLE 361 SUPPLY CHAIN MANAGEMENT MARKET, BY REGION, 2014–2019 (USD MILLION)
  • TABLE 362 SUPPLY CHAIN MANAGEMENT MARKET, BY REGION, 2019–2027 (USD MILLION)
  • TABLE 363 COLD CHAIN MONITORING MARKET, BY TEMPERATURE TYPE, 2017–2020 (USD MILLION)
  • TABLE 364 COLD CHAIN MONITORING MARKET, BY TEMPERATURE TYPE, 2021–2026 (USD MILLION)
  • TABLE 365 COLD CHAIN MONITORING MARKET, BY OFFERING, 2017–2020 (USD MILLION)
  • TABLE 366 COLD CHAIN MONITORING MARKET, BY OFFERING, 2021–2026 (USD MILLION)
  • TABLE 367 COLD CHAIN MONITORING MARKET, BY LOGISTIC, 2017–2020 (USD MILLION)
  • TABLE 368 COLD CHAIN MONITORING MARKET, BY LOGISTIC, 2021–2026 (USD MILLION)
  • TABLE 369 COLD CHAIN MONITORING MARKET, BY APPLICATION, 2017–2020 (USD MILLION)
  • TABLE 370 COLD CHAIN MONITORING MARKET, BY APPLICATION, 2021–2026 (USD MILLION)
  • TABLE 371 COLD CHAIN MONITORING MARKET, BY REGION, 2017–2020 (USD MILLION)
  • TABLE 372 COLD CHAIN MONITORING MARKET, BY REGION, 2021–2026 (USD MILLION)
LIST OF FIGURES
 
  • FIGURE 1 SUPPLY CHAIN SECURITY MARKET: RESEARCH DESIGN
  • FIGURE 2 MARKET: RESEARCH FLOW
  • FIGURE 3 MARKET SIZE ESTIMATION METHODOLOGY—APPROACH 1 (SUPPLY SIDE): REVENUE OF HARDWARE/SOFTWARE/SERVICES OF SUPPLY CHAIN SECURITY VENDORS
  • FIGURE 4 MARKET SIZE ESTIMATION METHODOLOGY—APPROACH 1, SUPPLY-SIDE ANALYSIS
  • FIGURE 5 MARKET SIZE ESTIMATION METHODOLOGY—APPROACH 2, BOTTOM-UP (SUPPLY SIDE): COLLECTIVE REVENUE FROM HARDWARE, SOFTWARE, AND SERVICES
  • FIGURE 6 MARKET SIZE ESTIMATION METHODOLOGY APPROACH—TOP-DOWN (DEMAND SIDE) FOR APPLICATION AREAS
  • FIGURE 7 NORTH AMERICA TO ACCOUNT FOR LARGEST MARKET SHARE IN 2024
  • FIGURE 8 RISING OCCURRENCE OF CYBERATTACKS ACROSS SUPPLY CHAINS AND GROWING NEED FOR SUPPLY CHAIN TRANSPARENCY TO DRIVE MARKET GROWTH
  • FIGURE 9 HARDWARE COMPONENTS SEGMENT TO HOLD LARGEST MARKET DURING FORECAST PERIOD
  • FIGURE 10 DATA VISIBILITY & GOVERNANCE SEGMENT TO HOLD LARGEST MARKET DURING FORECAST PERIOD
  • FIGURE 11 LARGE ENTERPRISES TO HOLD LARGER MARKET DURING FORECAST PERIOD
  • FIGURE 12 HEALTHCARE & PHARMACEUTICALS SEGMENT TO HOLD LARGEST MARKET DURING FORECAST PERIOD
  • FIGURE 13 IOT SENSORS & DEVICES SEGMENT TO HOLD LARGEST MARKET DURING FORECAST PERIOD
  • FIGURE 14 SUPPLY CHAIN VISIBILITY TOOLS SEGMENT TO HOLD LARGEST MARKET DURING FORECAST PERIOD
  • FIGURE 15 TRAINING & CONSULTING SEGMENT TO HOLD LARGEST MARKET DURING FORECAST PERIOD
  • FIGURE 16 ASIA PACIFIC TO EMERGE AS BEST MARKET FOR INVESTMENTS IN NEXT FIVE YEARS
  • FIGURE 17 MARKET: DRIVERS, RESTRAINTS, OPPORTUNITIES, AND CHALLENGES
  • FIGURE 18 STARTING POINTS FOR ONLINE SHOPPING JOURNEYS IN 2024
  • FIGURE 19 MARKET: VALUE CHAIN ANALYSIS
  • FIGURE 20 KEY PLAYERS IN MARKET ECOSYSTEM
  • FIGURE 21 MARKET: PORTER’S FIVE FORCES ANALYSIS
  • FIGURE 22 SUPPLY CHAIN SECURITY MARKET: AVERAGE SELLING PRICE OF PRODUCT, 2024
  • FIGURE 23 LIST OF MAJOR PATENTS FOR SUPPLY CHAIN SECURITY
  • FIGURE 24 REGIONAL ANALYSIS OF PATENTS GRANTED FOR SUPPLY CHAIN SECURITY, 2014–2024
  • FIGURE 25 IMPORT TRENDS IN RADAR & NAVIGATIONAL SYSTEMS FOR TRACKING AND SECURITY, 2019–2023 (USD BILLION)
  • FIGURE 26 EXPORT TRENDS IN RADAR & NAVIGATIONAL SYSTEMS FOR TRACKING AND SECURITY, 2019–2023 (USD BILLION)
  • FIGURE 27 TRENDS/DISRUPTIONS IMPACTING CUSTOMER BUSINESS
  • FIGURE 28 INFLUENCE OF STAKEHOLDERS ON BUYING PROCESS FOR TOP THREE VERTICALS
  • FIGURE 29 INFLUENCE OF BUYING CRITERIA ON TOP THREE VERTICALS
  • FIGURE 30 LEADING START-UPS/SMES, BY FUNDING METRICS (TOTAL FUNDING AMOUNT, NUMBER OF INVESTORS, AND FUNDING ROUNDS)
  • FIGURE 31 POTENTIAL OF GENERATIVE AI IN ENHANCING SUPPLY CHAIN SECURITY ACROSS INDUSTRIES
  • FIGURE 32 IMPACT OF GENERATIVE AI ON INTERCONNECTED AND ADJACENT ECOSYSTEMS
  • FIGURE 33 SERVICES SEGMENT TO GROW AT HIGHEST CAGR DURING FORECAST PERIOD
  • FIGURE 34 IOT SENSORS & DEVICES TO HOLD LARGEST MARKET SIZE DURING FORECAST PERIOD
  • FIGURE 35 SUPPLY CHAIN VISIBILITY TOOLS TO HOLD LARGEST MARKET SIZE DURING FORECAST PERIOD
  • FIGURE 36 TRAINING & CONSULTING SERVICES TO HOLD LARGEST MARKET SIZE DURING FORECAST PERIOD
  • FIGURE 37 DATA VISIBILITY & GOVERNANCE SEGMENT TO REGISTER HIGHEST CAGR DURING FORECAST PERIOD
  • FIGURE 38 LARGE ENTERPRISES SEGMENT TO HOLD LARGER MARKET DURING FORECAST PERIOD
  • FIGURE 39 RETAIL & ECOMMERCE SEGMENT TO REGISTER HIGHEST CAGR DURING FORECAST PERIOD
  • FIGURE 40 NORTH AMERICA TO HOLD LARGEST MARKET SIZE DURING FORECAST PERIOD
  • FIGURE 41 NORTH AMERICA: SUPPLY CHAIN SECURITY MARKET SNAPSHOT
  • FIGURE 42 ASIA PACIFIC: MARKET SNAPSHOT
  • FIGURE 43 MARKET: COMPARISON OF VENDORS’ BRANDS
  • FIGURE 44 MARKET: COMPANY VALUATION OF KEY VENDORS, 2024 (USD BILLION)
  • FIGURE 45 MARKET: FINANCIAL METRICS, 2024
  • FIGURE 46 SEGMENTAL REVENUE ANALYSIS OF KEY MARKET PLAYERS, 2019–2023 (USD MILLION)
  • FIGURE 47 SHARE OF LEADING COMPANIES IN MARKET
  • FIGURE 48 MARKET: COMPANY EVALUATION MATRIX (KEY PLAYERS), 2023
  • FIGURE 49 MARKET: COMPANY FOOTPRINT
  • FIGURE 50 SUPPLY CHAIN SECURITY MARKET: COMPANY EVALUATION MATRIX (START-UPS/SMES), 2023
  • FIGURE 51 IBM: COMPANY SNAPSHOT
  • FIGURE 52 EMERSON: COMPANY SNAPSHOT
  • FIGURE 53 ORACLE: COMPANY SNAPSHOT
  • FIGURE 54 NXP SEMICONDUCTORS: COMPANY SNAPSHOT


Secondary research was conducted to collect information useful for this technical, market-oriented, and commercial study of the global supply chain security market. The next step was to validate these findings, assumptions, and sizing with industry experts across the value chain using primary research. Different approaches, such as top-down and bottom-up, were employed to estimate the total market size. After that, the market breakup and data triangulation procedures were used to estimate the market size of the segments and subsegments of the supply chain security market.

Secondary Research

In the secondary research process, various secondary sources were referred to identify and collect information related to the study. Secondary sources included supply chain security news, supply chain security foundations, annual reports, press releases, investor presentations of supply chain security vendors, forums, certified publications, and whitepapers. The secondary research was used to obtain critical information on the industry's value chain, the total pool of key players, market classification, and segmentation from the market and technology-oriented perspectives.

Primary Research

In the primary research process, various primary sources from the supply and demand sides of the supply chain security market were interviewed to obtain qualitative and quantitative information for the study. The primary sources from the supply side included industry experts, such as Chief Executive Officers (CEOs), Vice Presidents (VPs), marketing directors, technology and innovation directors, and related key executives of various vendors providing supply chain security solutions, tools and applications, associated service providers, and system integrators operating in the targeted regions. All possible parameters that affect the market covered in this research study have been accounted for, viewed in extensive detail, verified through primary research, and analyzed to obtain the final quantitative and qualitative data.

After the complete market engineering process (including calculations for market statistics, market breakups, market size estimations, market forecasting, and data triangulation), extensive primary research was conducted to gather information and verify and validate the critical numbers arrived at. The primary research helped identify and validate the segmentation types, industry trends, key players, a competitive landscape of supply chain security services, tools, and applications offered by several market vendors, and fundamental market dynamics, such as drivers, restraints, opportunities, challenges, industry trends, and key strategies.

In the complete market engineering process, the bottom-up and top-down approaches and several data triangulation methods were extensively used to estimate and forecast the overall market segments and subsegments listed in this report. An extensive qualitative and quantitative analysis was performed on the complete market engineering process to list the key information/insights throughout the report.

Supply Chain Security Market Size, and Share

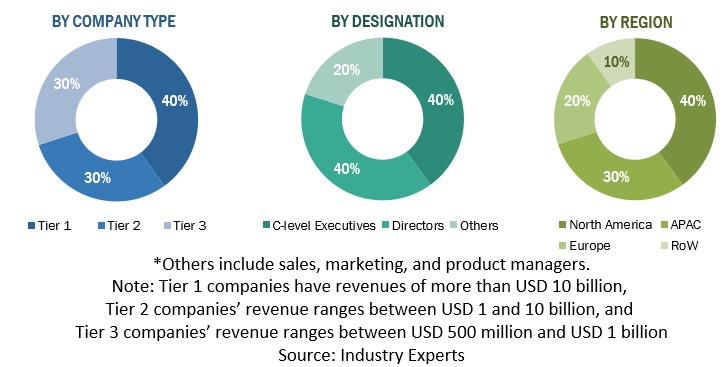
Note: Other levels include sales, marketing, and product managers.
Tier 1 companies receive revenues higher than USD 10 billion; Tier 2 companies' revenues range
between USD 1 and 10 billion; and Tier 3 companies' revenues range between USD 500 million and USD 1 billion.
Source: Industry Experts and MarketandMarkets Analysis

To know about the assumptions considered for the study, download the pdf brochure

Market Size Estimation

Top-down and bottom-up approaches were used to estimate and validate the supply chain security market's size and various other dependent sub-segments in the overall supply chain security market. The research methodology used to estimate the market size includes the following details: key players in the market were identified through secondary research, and their market shares in the respective regions were determined through primary and secondary research. This entire procedure included the study of the annual and financial reports of the top market players, and extensive interviews were conducted for key insights from the industry leaders, such as CEOs, VPs, directors, and marketing executives.

Market Size Estimation Methodology- Top-down approach

In the top-down approach, an exhaustive list of all the vendors offering products in the WCM market was prepared. The revenue contribution of the market vendors was estimated through annual reports, press releases, funding, investor presentations, paid databases, and primary interviews. Each vendor's offerings were evaluated based on the breadth of product type, deployment mode, architecture, and end user. The aggregate of all the companies’ revenue was extrapolated to reach the overall market size. Each subsegment was studied and analyzed for its global market size and regional penetration. The markets were triangulated through both primary and secondary research. The primary procedure included extensive interviews for key insights from industry leaders, such as CIOs, CEOs, VPs, directors, and marketing executives. The market numbers were further triangulated with the existing MarketsandMarkets’ repository for validation.

All percentage splits and breakdowns were determined using secondary sources and verified through primary sources. All possible parameters that affect the market covered in this research study have been accounted for, viewed in extensive detail, verified through primary research, and analyzed to get the final quantitative and qualitative data. This data is consolidated and added to detailed inputs and analysis from MarketsandMarkets.

Supply Chain Security Market : Top-Down and Bottom-Up Approach

Supply Chain Security Market Top Down and Bottom Up Approach

Data Triangulation

After arriving at the overall market size using the market size estimation processes explained above, the market was split into several segments and subsegments. The data triangulation and market breakup procedures were employed, wherever applicable, to complete the overall market engineering process and arrive at the exact statistics of each market segment and subsegment. The data was triangulated by studying various factors and trends from both the demand and supply sides.

Market Definition

A supply chain security system combines traditional supply chain management practices with security measures and focuses on the risk management of external suppliers, vendors, logistics, and transportation. Supply chain security activities aim to enhance the security/ protection of the supply chain from terrorism, piracy, and theft. Supply chain security solutions help businesses identify, analyze, and mitigate supply chain risks with real-time visibility and transparency. This, in turn, helps businesses make faster, accurate, and informed decisions.

Stakeholders

  • Chief Technology and Data Officers
  • Supply Chain Security Service Professionals
  • Business Analysts
  • Information Technology (IT) Professionals
  • Investors and Venture Capitalists
  • Third-party Providers
  • Consultants/Consultancies/Advisory Firms
  • Product Designers/Computer-aided Software Engineers
  • System Integrators
  • Value-added Resellers (VARs)

Report Objectives

  • To describe and forecast the global supply chain security market based on offering, security type, organization size, application areas, and region
  • To provide detailed information about the major factors (drivers, opportunities, restraints, and challenges) influencing the growth of the market
  • To analyze the opportunities for stakeholders by identifying the high-growth segments of the market.
  • To forecast the size of the market segments with respect to five regions: North America, Europe, Middle East & Africa, Asia Pacific and Latin America.
  • To analyze subsegments of the market with respect to individual growth trends, prospects, and contributions to the overall market.
  • To profile the key players and comprehensively analyze their market sizes and core competencies.
  • To track and analyze competitive developments such as product enhancements and new product launches, acquisitions, and partnerships and collaborations in the market globally.

Available Customizations

With the given market data, MarketsandMarkets offers customizations based on company-specific needs. The following customization options are available for the report:

Geographic Analysis as per Feasibility

  • Further breakup of the Asia Pacific market into countries contributes to the rest of the regional market size.
  • Further breakup of the North American market into countries contributes to the rest of the regional market size.
  • Further breakup of the Latin American market into countries contributes to the rest of the regional market size.
  • Further breakup of the Middle East & African market into countries contributing to the rest of the regional market size
  • Further breakup of the European market into countries contributes to the rest of the regional market size.

Company Information

  • Detailed analysis and profiling of additional market players (up to 5)

Previous Versions of this Report

Supply Chain Security Market by Component (Hardware, Software, Services), Security Type (Data Locality & Protection, Data Visibility & Governance), Organization Size, Application (Healthcare & Pharmaceuticals, FMCG) and Region - Global Forecast to 2027

Report Code TC 7947
Published in Jan, 2023, By MarketsandMarkets™
"Our USP is "providing game-changing business opportunities reports with free customization" - so please feel free to provide us with your specific areas of interest / business challenges in much greater detail !!"

We appreciate your interest in this report. Once you fill out the form, you'll be immediately directed to an exclusive solution tailored to your needs. This high-value offering can help boost your revenue by 30% - a must-see opportunity for anyone looking to maximize growth.


By clicking the "Submit" button, you are agreeing to the Terms of Use and Privacy Policy.

Custom Market Research Services

We Will Customise The Research For You, In Case The Report Listed Above Does Not Meet With Your Requirements

Get 10% Free Customisation

Growth opportunities and latent adjacency in Supply Chain Security Market

DMCA.com Protection Status