Tactical Data Link Market Size, Share, & Growth Forecast

Tactical Data Link Market by Data Link Type (Link 11, LINK 16, Link 22, Others), (Application (Command & Control, ISR, EW, Radio Communication), Platform, Component, Frequency, Point of Sale, Military Standard, and Region - Global Forecast to 2027

Report Code: AS 5655 Jun, 2022, by marketsandmarkets.com

Update: 10/11/2024

Tactical Data Link Market Size & Growth

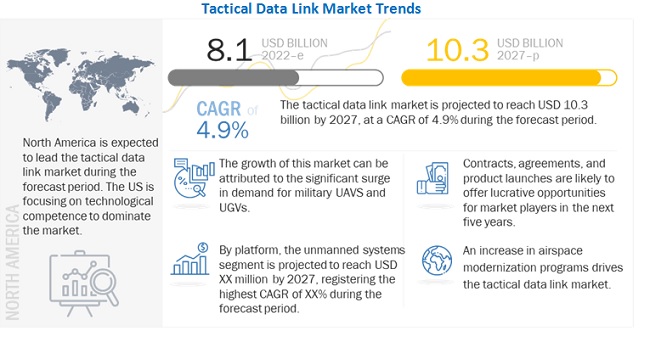
The Tactical Data Link Market is estimated to be USD 8.1 billion in 2022 and is projected to reach USD 10.3 billion by 2027, at a CAGR of 4.9% from 2022 to 2027. The Tactical Data Link Industry is driven by factors such as rise in airspace modernization programs, emergence of modern warfare systems, etc.
Tactical Data Link Market

To know about the assumptions considered for the study, Request for Free Sample Report

Covid - 19 Impact on Tactical Data Link Market

The COVID-19 pandemic has caused a large-scale impact on economies across the world. The global manufacturing of tactical data links, components, and assembly lines have been impacted. COVID-19 has led to several challenges for many industries. The Aerospace & defense industry is no exception to that. The budget allotted to the defense sector has been reduced by several countries due to the COVID-19 pandemic. This puts most research projects on hold. The export of tactical data links to several countries in the Middle East, Africa, and Latin America has also been reduced. All these scenarios affect the development of tactical data links.

Tactical Data Link Market Dynamics

Driver : Rise in airspace modernization programs

Modernizing and overhauling the airspace is of prime focus areas in North American and European countries to enhance safety and minimize flight delays. Better routing decisions, improved pilot communications, and enhanced efficiency are some benefits of airspace modernization, which involves the installation of new technologies and components to communicate effectively with air traffic managers, perform multidimensional aircraft tracking, and improve navigation by generating an image of the forward external scene topography. These airspace modernization programs, when implemented successfully, help save fuel, enhance the quality of air, and reduce carbon emissions.

Airspace modernization programs include designing new communication antennas to increase the connectivity of aircraft. For instance, in March 2021, a new communication antenna was designed by ThinKom Solutions, which offers flexible installation options for special-purpose aircraft. The company has developed a new variant of its Variable Inclination Continuous Transverse Stub (VICTS) antenna for the government and military Beyond-Line-of-Sight (BLoS) applications. Initial units of the product are currently going through integration, with formal qualification scheduled to start soon.

Restraint : Rigorous military standards and stringent regulations

In the defense sector, the secure communication of data links is very important as it may alter an incorrect interpretation of communication. Therefore, the defense sector defines the standards to develop and test these data link solutions. The North Atlantic Treaty Organization (NATO) has described standards that all NATO members and other countries can follow. However, these stringent norms and regulations hamper the growth of the market. Moreover, defense equipment has to pass through different military standards to qualify for procurement by defense forces. Apart from the military standards, the defense products should meet the size, weight, and power (SWaP) requirements used in military aircraft.

Opportunity : Growing demand for enhanced interoperability

The Electromagnetic Compatibility (EMC) design is integral to electrical components and systems. The growing demand for improved interoperability among armed forces and coalition partners is accelerating the production of advanced system solutions. The interoperability allows the system or arm forces to work together in a particular situation and improve communication security. Therefore, there is an increase in the adoption of tactical data link solutions from end-users due to the increasing need for secure communication.

On March 27, 2020, North Macedonia became a member of NATO. NATO uses military data link 16 networks to communicate with its coalition partners. With more and more countries joining NATO, the demand for standardized tactical data links is expected to grow during the forecast period.

Challenges : Lack of skilled workforce

Countries such as Morocco, South Africa, Nigeria, Somalia, Kenya, Bangladesh, Nepal, and Bhutan lack a skilled technical workforce in the defense industry. Potential workforce issues affect the safety and effectiveness of operations, which further limits the number of missions that the systems can handle. Thus, the lack of a skilled workforce acts as a challenge to the growth of the tactical data link market.

Critical land, marine, airborne, and space operations increasingly rely on well-qualified personnel for various tasks such as R&D, patent development, and software development & application. Thus, the recruitment of a technical workforce forms a crucial part of ensuring innovation in business processes and products in the defense industry.

Tactical Data Link Market Segmental Analysis

Unmanned Systems segment of the Tactical Data Link Market by platform, to grow at highest CAGR during the forecast period

Based on platform, the Unmanned Systems segment is projected to grow from USD 792 million in 2022 to USD 1,082 million by 2027, at a CAGR of 6.4% during the forecast period. The growth can be attributed to the increasing use of UAVs across various industries, as well as increasing demand of UAVs for both military and commercial application.

Product segment to command the Tactical Data Link Market by component, during the forecast period

Based on component, the product segment is projected to grow from USD 5,326 million in 2022 to USD 6,862 million by 2027, at a CAGR of 5.2% during the forecast period. The growth can be attributed to the higher adoption of technologically advanced tactical data link products owing to the ease of operation and maintenance.

OEM segment to dominate the Tactical Data Link Market by point of sale, during the forecast period

Based on point of sale, the OEM segment is projected to grow from USD 5,292 million in 2022 to USD 6,825 million by 2027, at a CAGR of 5.2% during the forecast period..

The North America market is projected to contribute the largest share from 2022 to 2027

Tactical Data Link Market by Region

To know about the assumptions considered for the study, download the pdf brochure

Emerging Industry Trends

Development of cognitive radios

Efforts are underway to develop a smart and computer-controlled radio which can monitor the RF environment, identify available and interference-free frequencies, and establish communications links automatically in real-time. This has led to the development of cognitive radios, which are expected to be more computer-intensive than software-defined radios. Cognitive radios need to possess the intelligence to monitor the environment, determine if frequencies are jammed, and make use of other frequencies in such cases. This technology is still in the developmental phase and is expected to be used first in the commercial sector.

The deployment of radio systems in the defense sector generally entails extensive spectrum management, owing to the latter’s limited availability. However, cognitive radios are expected to be able to function in a congested spectrum in an optimized manner by monitoring the spectrum in real-time and identifying a channel that is not in use. Cognitive radios are expected to be used to improve the overall spectrum utilization and efficiency.

Tactical Data Link Industry Companies: Top Key Market Players

The Tactical Data Link Companies is dominated by globally established players such as:

  • Collins Aerospace (US)
  • L3harris Technologies (US)
  • ViaSat (US)
  • Thales Group (France)
  • General Dynamics Corporation (US)

The report covers various industry trends and new technological innovations in the Tactical Data Link Market for the period, 2018-2027.

Tactical Data Link Market Report Scope:

Report Metric

Details

Market Size Value in 2022

USD 8.1 Billion

Revenue Forecast in 2027

USD 10.3 Billion

Growth Rate

4.9 %

Forecast period

2022-2027

Market size available for years

2018–2027

Base year considered

2021

Forecast units

Value (USD Million/Billion)

Segments covered

By Platform, By Application, By Component, By Frequency, By Data link type, By Point of sale, By Military Standard

Geographies covered

  • North America
  • Europe
  • Asia Pacific
  • Rest of the World.

Companies covered

L3harris Technologies (US), Honeywell International Inc (US), General Dynamics Corporation (US), Lockheed Martin Corporation (US), ViaSat (US), Leonardo S.p.A. (Italy), BAE Systems (UK), among others. (24 Companies)

The study categorizes the Tactical Data Link Market based on platform, application, component, technology, and region

By Platform

  • Ground
    • Ground Control Stations/Command Centre
    • Armored vehicles
    • Soldiers
  • Airborne
    • Fixed
    • Rotary
  • Naval
    • Ships
    • Submarines
  • Unmanned Systems
    • Unmanned Ground Vehicles (UGVs)
    • Unmanned Aerial Vehicles (UAVs)
    • Underwater Vehicles
  • Weapons

By Application

  • Command & Control
  • Intelligence, Surveillance & Reconnissance
  • Electronic Warfare
  • Radio Communications

By Component

  • Product
    • Terminals
    • Radio Sets
    • Modems
    • Routers
    • Controllers
    • Transceivers
    • Monitors
    • Others
  • Software Solution

By Frequency

  • High Frequency
  • Ultra High Frequency

By Data Link Type

  • Link 11
  • Link 16
  • Link 22
  • Others

By Point of Sale

  • OEM
  • Aftermarket

By Military Standard

  • MIL STD 6011
  • MIL STD 6016
  • MIL STD 6017
  • MIL STD 6020
  • MIL STD 3011

By Region

  • North America
  • Asia Pacific
  • Europe
  • Rest of the World

Recent Developments

  • In May 2022, Thales was one of two (2) vendors awarded an Indefinite Delivery, Indefinite Quantity (IDIQ) contract by the US Army to deliver advanced tactical radios under the US Army’s Combat Net Radio (CNR) modernization program. The competitive 10-year contract for the Combat Net Radio (CNR) program includes a five-year base ordering period and an additional five-year optional ordering period.
  • In May 2022, L3Harris Technologies received an IDIQ contract increase for its Falcon IV AN/PRC-167 radio systems from the US Special Operations Command (USSOCOM). USSOCOM increased the initial IDIQ ceiling from USD 255 million to USD 552 million.

Frequently Asked Questions (FAQ):

To speak to our analyst for a discussion on the above findings, click Speak to Analyst

TABLE OF CONTENTS
 
1 INTRODUCTION (Page No. - 33)
    1.1 OBJECTIVES OF THE STUDY 
    1.2 MARKET DEFINITION 
    1.3 STUDY SCOPE 
           1.3.1 MARKETS COVERED
           1.3.2 REGIONAL SCOPE
           1.3.3 YEARS CONSIDERED FOR THE STUDY
    1.4 INCLUSIONS AND EXCLUSIONS 
           TABLE 1 INCLUSIONS AND EXCLUSIONS IN TACTICAL DATA LINK MARKET
    1.5 CURRENCY & PRICING 
    1.6 STUDY LIMITATIONS 
    1.7 MARKET STAKEHOLDERS 
    1.8 SUMMARY OF CHANGES 
 
2 RESEARCH METHODOLOGY (Page No. - 39)
    2.1 RESEARCH DATA 
           FIGURE 1 REPORT PROCESS FLOW
           FIGURE 2 RESEARCH DESIGN
           2.1.1 SECONDARY DATA
           2.1.2 PRIMARY DATA
                    2.1.2.1 Key data from primary sources
                    2.1.2.2 Key primary sources
                               FIGURE 3 BREAKDOWN OF PRIMARY INTERVIEWS: BY COMPANY TYPE, DESIGNATION, AND REGION
           2.1.3 DEMAND-SIDE INDICATORS
           2.1.4 SUPPLY-SIDE ANALYSIS
    2.2 MARKET SIZE ESTIMATION 
           TABLE 2 SEGMENTS AND SUBSEGMENTS
    2.3 RESEARCH APPROACH & METHODOLOGY 
           2.3.1 BOTTOM-UP APPROACH
                    TABLE 3 TACTICAL DATA LINK MARKET ESTIMATION PROCEDURE
                    FIGURE 4 MARKET SIZE ESTIMATION METHODOLOGY: BOTTOM-UP APPROACH
           2.3.2 TOP-DOWN APPROACH
                    FIGURE 5 MARKET SIZE ESTIMATION METHODOLOGY: TOP-DOWN APPROACH
    2.4 DATA TRIANGULATION 
           FIGURE 6 DATA TRIANGULATION
           2.4.1 TRIANGULATION THROUGH PRIMARY AND SECONDARY RESEARCH
    2.5 GROWTH RATE ASSUMPTIONS 
    2.6 ASSUMPTIONS FOR RESEARCH STUDY 
    2.7 RISKS 
 
3 EXECUTIVE SUMMARY (Page No. - 49)
    FIGURE 7 BY PLATFORM, UNMANNED SYSTEMS SEGMENT PROJECTED TO REGISTER HIGHEST CAGR DURING FORECAST PERIOD
    FIGURE 8 BY COMPONENT, PRODUCT SEGMENT EXPECTED TO LEAD MARKET DURING FORECAST PERIOD
    FIGURE 9 BY POINT OF SALE, OEM SEGMENT EXPECTED TO DOMINATE MARKET DURING FORECAST PERIOD
    FIGURE 10 BY FREQUENCY, HF SEGMENT EXPECTED TO LEAD MARKET DURING FORECAST PERIOD
    FIGURE 11 BY APPLICATION, COMMAND & CONTROL SEGMENT EXPECTED TO LEAD MARKET DURING FORECAST PERIOD
    FIGURE 12 NORTH AMERICA ESTIMATED TO HOLD LARGEST MARKET SHARE IN 2022
 
4 PREMIUM INSIGHTS (Page No. - 53)
    4.1 ATTRACTIVE GROWTH OPPORTUNITIES
           FIGURE 13 SURGE IN ADOPTION OF UNMANNED SYSTEMS DRIVES MARKET GROWTH
    4.2 MARKET, BY PLATFORM 
           FIGURE 14 GROUND SEGMENT ESTIMATED TO LEAD MARKET FROM 2018 TO 2027
    4.3 MARKET, BY APPLICATION 
           FIGURE 15 COMMAND & CONTROL SEGMENT ESTIMATED TO LEAD MARKET FROM 2018 TO 2027
    4.4 MARKET, BY COMPONENT 
           FIGURE 16 PRODUCT SEGMENT ESTIMATED TO LEAD MARKET FROM 2018 TO 2027
    4.5 MARKET, BY POINT OF SALE 
           FIGURE 17 OEM SEGMENT ESTIMATED TO LEAD MARKET FROM 2018 TO 2027
    4.6 MARKET, BY COUNTRY 
           FIGURE 18 US PROJECTED TO BE FASTEST-GROWING MARKET FROM 2022 TO 2027
 
5 MARKET OVERVIEW (Page No. - 56)
    5.1 INTRODUCTION 
    5.2 MARKET DYNAMICS 
           FIGURE 19 DRIVERS, RESTRAINTS, OPPORTUNITIES, AND CHALLENGES
           5.2.1 DRIVERS
                    5.2.1.1 Rise in airspace modernization programs
                    5.2.1.2 Surging demand for military UAVs
                               FIGURE 20 PROCUREMENT OF MILITARY UNMANNED AIR VEHICLES (2016−2021)
                    5.2.1.3 Emergence of modern warfare systems
                               TABLE 4 ELECTRONIC WARFARE SYSTEMS MARKET, BY REGION, 2016 VS. 2021 (USD MILLION)
                    5.2.1.4 Customized communication-on-the-move solutions for unmanned ground vehicles
                    5.2.1.5 Increasing defense budget of emerging countries
                               TABLE 5 DEFENSE BUDGET, BY COUNTRY, 2020
           5.2.2 RESTRAINTS
                    5.2.2.1 Rigorous military standards and stringent regulations
           5.2.3 OPPORTUNITIES
                    5.2.3.1 Rising adoption of unmanned vehicles
                               TABLE 6 UAVS MARKET, BY REGION, 2016 VS. 2021 (USD MILLION)
                    5.2.3.2 Growing demand for enhanced interoperability
           5.2.4 CHALLENGES
                    5.2.4.1 Lack of skilled workforce
                    5.2.4.2 System requirements and design constraints
    5.3 VALUE CHAIN ANALYSIS
           FIGURE 21 VALUE CHAIN ANALYSIS
    5.4 TRENDS/DISRUPTIONS IMPACTING CUSTOMER BUSINESS 
           5.4.1 REVENUE SHIFT AND NEW REVENUE POCKETS OF MANUFACTURERS OF TACTICAL DATA LINK
                    FIGURE 22 REVENUE SHIFT FOR TACTICAL DATA LINK MARKET PLAYERS
    5.5 TACTICAL DATA LINK MARKET ECOSYSTEM 
           5.5.1 PROMINENT COMPANIES
           5.5.2 PRIVATE AND SMALL ENTERPRISES
           5.5.3 MARKET ECOSYSTEM
                    FIGURE 23 ECOSYSTEM: TACTICAL DATA LINK MARKET
                    TABLE 7 TACTICAL DATA LINK: MARKET ECOSYSTEM
    5.6 INNOVATION AND PATENT REGISTRATIONS 
           TABLE 8 INNOVATION & PATENT REGISTRATION, 2013−2021
    5.7 AVERAGE SELLING PRICE OF TACTICAL DATA LINK PRODUCTS 
           5.7.1 AVERAGE SELLING PRICE TRENDS OF DATA LINK COMPONENTS, 2020 (USD MILLION)
                    TABLE 9 AVERAGE SELLING PRICE TRENDS OF DATA LINK COMPONENTS, 2020 (USD MILLION)
    5.8 PRICING ANALYSIS 
           5.8.1 AVERAGE SELLING PRICES OF TACTICAL DATA LINK, BY COMPONENTS
                    FIGURE 24 AVERAGE SELLING PRICES OF TACTICAL DATA LINK COMPONENTS
    5.9 PORTER’S FIVE FORCES ANALYSIS 
           FIGURE 25 PORTER’S FIVE FORCES ANALYSIS FOR TACTICAL DATA LINK MARKET
           TABLE 10 TACTICAL DATA LINK: PORTER’S FIVE FORCE ANALYSIS
           5.9.1 THREAT OF NEW ENTRANTS
           5.9.2 THREAT OF SUBSTITUTES
           5.9.3 BARGAINING POWER OF SUPPLIERS
           5.9.4 BARGAINING POWER OF BUYERS
           5.9.5 INTENSITY OF COMPETITIVE RIVALRY
    5.10 KEY MARKETS FOR EXPORT/IMPORT 
           5.10.1 US
           5.10.2 CHINA
           5.10.3 FRANCE
           5.10.4 JAPAN
           5.10.5 KEY CONFERENCES & EVENTS, 2022−2023
           TABLE 11 TACTICAL DATA LINK MARKET: DETAILED LIST OF CONFERENCES & EVENTS
    5.11 TARIFF AND REGULATORY LANDSCAPE 
           5.11.1 REGULATORY BODIES, GOVERNMENT AGENCIES, AND OTHER ORGANIZATIONS
                    TABLE 12 NORTH AMERICA: LIST OF REGULATORY BODIES, GOVERNMENT AGENCIES, AND OTHER ORGANIZATIONS
                    TABLE 13 EUROPE: LIST OF REGULATORY BODIES, GOVERNMENT AGENCIES, AND OTHER ORGANIZATIONS
                    TABLE 14 ASIA PACIFIC: LIST OF REGULATORY BODIES, GOVERNMENT AGENCIES, AND OTHER ORGANIZATIONS
                    TABLE 15 MIDDLE EAST: LIST OF REGULATORY BODIES, GOVERNMENT AGENCIES, AND OTHER ORGANIZATIONS
           5.11.2 REGULATORY LANDSCAPE
                    5.11.2.1 North America
                    5.11.2.2 Europe
    5.12 KEY STAKEHOLDERS & BUYING CRITERIA 
           5.12.1 KEY STAKEHOLDERS IN BUYING PROCESS
                    FIGURE 26 INFLUENCE OF STAKEHOLDERS IN BUYING PROCESS OF TACTICAL DATA LINK ACROSS 3 APPLICATIONS
                    TABLE 16 INFLUENCE OF STAKEHOLDERS IN BUYING PROCESS OF TACTICAL DATA LINK ACROSS APPLICATIONS (%)
           5.12.2 BUYING CRITERIA
                    FIGURE 27 KEY BUYING CRITERIA OF TACTICAL DATA LINK, BY APPLICATION
                    TABLE 17 KEY BUYING CRITERIA OF TACTICAL DATA LINK, BY APPLICATION
 
6 INDUSTRY TRENDS (Page No. - 76)
    6.1 INTRODUCTION 
    6.2 TECHNOLOGY TRENDS 
           6.2.1 DEVELOPMENT OF COGNITIVE RADIOS
           6.2.2 USE OF SOFTWARE-DEFINED RADIOS
           6.2.3 DEVELOPMENT OF NEXT-GENERATION IP
           6.2.4 NETWORK-ENABLED WEAPONS (NEWS)
           6.2.5 MANNED-UNMANNED TEAMING (MUMT)
    6.3 TECHNOLOGY ANALYSIS 
           6.3.1 MULTIBAND TACTICAL COMMUNICATION AMPLIFIERS
           6.3.2 INCREASED USE OF ULTRA-COMPACT & HIGH THROUGHPUT ON-THE-MOVE (OTM) TERMINALS FOR TACTICAL UAVS
    6.4 USE CASE ANALYSIS 
           6.4.1 LINK 11
           6.4.2 LINK 11B
           6.4.3 LINK 14
           6.4.4 LINK 16
           6.4.5 LINK 22
           6.4.6 COMMON DATA LINK (CDL)
 
7 TACTICAL DATA LINK MARKET, BY APPLICATION (Page No. - 80)
    7.1 INTRODUCTION 
           FIGURE 28 BY APPLICATION, COMMAND & CONTROL SEGMENT EXPECTED TO LEAD MARKET DURING FORECAST PERIOD
           TABLE 18 TACTICAL DATA LINK MARKET, BY APPLICATION, 2018–2021 (USD MILLION)
           TABLE 19 TACTICAL DATA LINK MARKET, BY APPLICATION, 2022–2027 (USD MILLION)
    7.2 INTELLIGENCE, SURVEILLANCE, & RECONNAISSANCE (ISR) 
    7.3 COMMAND & CONTROL 
    7.4 ELECTRONIC WARFARE 
    7.5 RADIO COMMUNICATION 
 
8 TACTICAL DATA LINK MARKET, BY COMPONENT (Page No. - 84)
    8.1 INTRODUCTION 
           FIGURE 29 BY COMPONENT, PRODUCT SEGMENT PROJECTED TO REGISTER HIGHER CAGR THAN SOFTWARE SOLUTION SEGMENT DURING FORECAST PERIOD
           TABLE 20 TACTICAL DATA LINK MARKET, BY COMPONENT, 2018–2021 (USD MILLION)
           TABLE 21 TACTICAL DATA LINK MARKET, BY COMPONENT, 2022–2027 (USD MILLION)
    8.2 PRODUCT 
           8.2.1 INCREASED DEPENDENCE ON SMALL, LIGHTWEIGHT, AND POWER-EFFICIENT PRODUCTS TO FUEL DEMAND
           8.2.2 MODEMS
           8.2.3 TERMINALS
           8.2.4 RADIO SETS
           8.2.5 ROUTERS
           8.2.6 CONTROLLERS
           8.2.7 TRANSCEIVERS
           8.2.8 RECEIVERS
           8.2.9 OTHERS
    8.3 SOFTWARE SOLUTION 
           8.3.1 UPGRADED SOFTWARE INCREASINGLY USED TO INCREASE COMPATIBILITY OF TACTICAL DATA LINKS
 
9 MARKET, BY PLATFORM (Page No. - 89)
    9.1 INTRODUCTION 
           FIGURE 30 BY PLATFORM, UNMANNED SYSTEMS SEGMENT PROJECTED TO REGISTER HIGHEST CAGR DURING FORECAST PERIOD
           TABLE 22 BY PLATFORM, 2018–2021 (USD MILLION)
           TABLE 23 BY PLATFORM, 2022–2027 (USD MILLION)
    9.2 GROUND 
           9.2.1 GROUND CONTROL STATIONS/COMMAND CENTERS
                    9.2.1.1 Increased demand for advanced communication radios for army base stations
           9.2.2 ARMORED VEHICLES
                    9.2.2.1 Armored vehicles with tactical communication solutions provide on-the-walk and on-the-move capabilities
                    9.2.2.2 Combat vehicles
                    9.2.2.3 Combat support vehicles
           9.2.3 SOLDIERS
                    9.2.3.1 Increased demand for handheld tactical radios from defense forces
    9.3 AIRBORNE 
           9.3.1 ENSURED CONNECTIVITY IN MULTIPLE AIRBORNE PLATFORMS FUELS SEGMENT
           9.3.2 FIXED-WING
                    9.3.2.1 Fighter aircraft require tactical components for high-speed data transfer
                    9.3.2.2 Fighter aircraft
                    9.3.2.3 Transport aircraft
                    9.3.2.4 Special mission aircraft
           9.3.3 ROTARY-WING
                    9.3.3.1 Increasing procurement by emerging economies boosts demand for tactical communication equipment in military helicopters
                    9.3.3.2 Attack helicopters
                    9.3.3.3 Maritime helicopters
                    9.3.3.4 Multi-role helicopters
    9.4 NAVAL 
           9.4.1 INCREASING MARITIME WARFARE TO BOOST DEMAND
           9.4.2 SHIPS
                    9.4.2.1 Increasing demand for secure ship-to-shore, ship-to-ship, and ship-to-aircraft communications
                    9.4.2.2 Destroyers
                    9.4.2.3 Frigates
                    9.4.2.4 Corvettes
                    9.4.2.5 Amphibious vessels
                    9.4.2.6 Survey vessels
                    9.4.2.7 Patrol & mine countermeasure vessels
                    9.4.2.8 Offshore support vessels
                    9.4.2.9 Other supporting vessels
           9.4.3 SUBMARINES
                    9.4.3.1 Integrated tactical data link components to facilitate reliable and high-quality communications for underwater operations
    9.5 UNMANNED SYSTEMS 
           9.5.1 INCREASING DEMAND FOR UNMANNED SYSTEMS AND ADVANCEMENTS IN COMMUNICATION TECHNOLOGIES ASSIST MARKET GROWTH
           9.5.2 UNMANNED AERIAL VEHICLES (UAVS)
           9.5.3 UNMANNED GROUND VEHICLES (UGVS)
           9.5.4 UNMANNED UNDERWATER VEHICLES (UUVS)
    9.6 WEAPONS 
           9.6.1 NEED FOR PRECISION STRIKE WEAPONS TO FUEL DEMAND
           9.6.2 TACTICAL MISSILES
           9.6.3 GUIDED ROCKETS
           9.6.4 GUIDED AMMUNITION
           9.6.5 TORPEDOES
 
10 MARKET, BY FREQUENCY (Page No. - 101)
     10.1 INTRODUCTION 
             TABLE 24 DIFFERENT TYPES OF FREQUENCY BANDS
             FIGURE 31 BY FREQUENCY, UHF SEGMENT PROJECTED TO REGISTER HIGHER CAGR THAN HF SEGMENT DURING FORECAST PERIOD
             TABLE 25 MARKET, BY FREQUENCY, 2018–2021 (USD MILLION)
             TABLE 26 MARKET, BY FREQUENCY, 2022–2027 (USD MILLION)
     10.2 HIGH FREQUENCY 
             10.2.1 INCREASED DEMAND FOR SHORT-RANGE TACTICAL RADIOS IN MILITARY APPLICATIONS
     10.3 ULTRA HIGH FREQUENCY 
             10.3.1 UHF BANDS WIDELY USED IN SECURED MILITARY COMMUNICATIONS
 
11 MARKET, BY DATA LINK TYPE (Page No. - 104)
     11.1 LINK 11 
     11.2 LINK 16 
     11.3 LINK 22 
     11.4 OTHERS 
             11.4.1 VARIABLE MESSAGE FORMAT (VMF)
             11.4.2 SITUATIONAL AWARENESS DATA LINK (SADL)
             11.4.3 JOINT RANGE EXTENSION APPLICATIONS PROTOCOL (JREAP)
 
12 MARKET, BY MILITARY STANDARD (Page No. - 107)
     12.1 INTRODUCTION 
     12.2 MIL STD 6011 
     12.3 MIL STD 6016 
     12.4 MIL STD 6017 
     12.5 MIL STD 6020 
     12.6 MIL STD 3011 
 
13 MARKET, BY POINT OF SALE (Page No. - 109)
     13.1 INTRODUCTION 
             FIGURE 32 BY POINT OF SALE, OEM SEGMENT PROJECTED TO REGISTER HIGHER CAGR THAN AFTERMARKET SEGMENT DURING FORECAST PERIOD
             TABLE 27 MARKET, BY POINT OF SALE, 2018–2021 (USD MILLION)
             TABLE 28 MARKET, BY POINT OF SALE, 2022–2027 (USD MILLION)
     13.2 OEM 
             13.2.1 INCREASING UPGRADE OF MILITARY COMMUNICATION SYSTEMS AND PROCUREMENT OF MILITARY VEHICLES DRIVE SEGMENT
     13.3 AFTERMARKET 
             13.3.1 UPGRADE OF EXISTING MILITARY VEHICLE FLEETS FUEL SEGMENT’S GROWTH
 
14 REGIONAL ANALYSIS (Page No. - 112)
     14.1 INTRODUCTION 
             FIGURE 33 NORTH AMERICA ESTIMATED TO ACCOUNT FOR LARGEST MARKET SHARE IN 2022
             TABLE 29 BY REGION, 2018–2021 (USD MILLION)
             TABLE 30 BY REGION, 2022–2027 (USD MILLION)
             TABLE 31 BY PLATFORM, 2018–2021 (USD MILLION)
             TABLE 32 BY PLATFORM, 2022–2027 (USD MILLION)
             TABLE 33 BY APPLICATION, 2018–2021 (USD MILLION)
             TABLE 34 BY APPLICATION, 2022–2027 (USD MILLION)
             TABLE 35 BY FREQUENCY, 2018–2021 (USD MILLION)
             TABLE 36 BY FREQUENCY, 2022–2027 (USD MILLION)
             TABLE 37 BY COMPONENT, 2018–2021 (USD MILLION)
             TABLE 38 BY COMPONENT, 2022–2027 (USD MILLION)
             TABLE 39 BY POINT OF SALE, 2018–2021 (USD MILLION)
             TABLE 40 BY POINT OF SALE, 2022–2027 (USD MILLION)
     14.2 NORTH AMERICA 
             14.2.1 PESTLE ANALYSIS: NORTH AMERICA
                        FIGURE 34 NORTH AMERICA: SNAPSHOT
                        TABLE 41 NORTH AMERICA: BY PLATFORM, 2018–2021 (USD MILLION)
                        TABLE 42 NORTH AMERICA: BY PLATFORM, 2022–2027 (USD MILLION)
                        TABLE 43 NORTH AMERICA: BY FREQUENCY, 2018–2021 (USD MILLION)
                        TABLE 44 NORTH AMERICA: BY FREQUENCY, 2022–2027 (USD MILLION)
                        TABLE 45 NORTH AMERICA: BY COMPONENT, 2018–2021 (USD MILLION)
                        TABLE 46 NORTH AMERICA: BY COMPONENT, 2022–2027 (USD MILLION)
                        TABLE 47 NORTH AMERICA: BY POINT OF SALE, 2018–2021 (USD MILLION)
                        TABLE 48 NORTH AMERICA: BY POINT OF SALE, 2022–2027 (USD MILLION)
                        TABLE 49 NORTH AMERICA: BY COUNTRY, 2018–2021 (USD MILLION)
                        TABLE 50 NORTH AMERICA: BY COUNTRY, 2022–2027 (USD MILLION)
             14.2.2 US
                        14.2.2.1 Increased spending by US defense organizations and private players will fuel market growth
                                     TABLE 51 US: BY PLATFORM, 2018–2021 (USD MILLION)
                                     TABLE 52 US: BY PLATFORM, 2022–2027 (USD MILLION)
                                     TABLE 53 US: BY COMPONENT, 2018–2021 (USD MILLION)
                                     TABLE 54 US: BY COMPONENT, 2022–2027 (USD MILLION)
             14.2.3 CANADA
                        14.2.3.1 Increasing military procurements and growing demand for UAVs to drive market
                                     TABLE 55 CANADA: BY PLATFORM, 2018–2021 (USD MILLION)
                                     TABLE 56 CANADA: BY PLATFORM, 2022–2027 (USD MILLION)
                                     TABLE 57 CANADA: BY COMPONENT, 2018–2021 (USD MILLION)
                                     TABLE 58 CANADA: BY COMPONENT, 2022–2027 (USD MILLION)
     14.3 EUROPE 
             14.3.1 PESTLE ANALYSIS: EUROPE
                        FIGURE 35 EUROPE: SNAPSHOT
                        TABLE 59 EUROPE: BY PLATFORM, 2018–2021 (USD MILLION)
                        TABLE 60 EUROPE: BY PLATFORM, 2022–2027 (USD MILLION)
                        TABLE 61 EUROPE: BY FREQUENCY, 2018–2021 (USD MILLION)
                        TABLE 62 EUROPE: BY FREQUENCY, 2022–2027 (USD MILLION)
                        TABLE 63 EUROPE: BY COMPONENT, 2018–2021 (USD MILLION)
                        TABLE 64 EUROPE: BY COMPONENT, 2022–2027 (USD MILLION)
                        TABLE 65 EUROPE: BY POINT OF SALE, 2018–2021 (USD MILLION)
                        TABLE 66 EUROPE: BY POINT OF SALE, 2022–2027 (USD MILLION)
                        TABLE 67 EUROPE: BY COUNTRY, 2018–2021 (USD MILLION)
                        TABLE 68 EUROPE: BY COUNTRY, 2022–2027 (USD MILLION)
             14.3.2 UK
                        14.3.2.1 Government initiatives supporting development of communication systems will increase demand for tactical products
                                     TABLE 69 UK: BY PLATFORM, 2018–2021 (USD MILLION)
                                     TABLE 70 UK: BY PLATFORM, 2022–2027 (USD MILLION)
                                     TABLE 71 UK: BY COMPONENT, 2018–2021 (USD MILLION)
                                     TABLE 72 UK: BY COMPONENT, 2022–2027 (USD MILLION)
             14.3.3 ITALY
                        14.3.3.1 Increasing development of secured communication systems to drive market
                                     TABLE 73 ITALY: BY PLATFORM, 2018–2021 (USD MILLION)
                                     TABLE 74 ITALY: BY PLATFORM, 2022–2027 (USD MILLION)
                                     TABLE 75 ITALY: BY COMPONENT, 2018–2021 (USD MILLION)
                                     TABLE 76 ITALY: BY COMPONENT, 2022–2027 (USD MILLION)
             14.3.4 GERMANY
                        14.3.4.1 Continuous focus on upgrading battle management and communications systems
                                     TABLE 77 GERMANY: BY PLATFORM, 2018–2021 (USD MILLION)
                                     TABLE 78 GERMANY: BY PLATFORM, 2022–2027 (USD MILLION)
                                     TABLE 79 GERMANY: BY COMPONENT, 2018–2021 (USD MILLION)
                                     TABLE 80 GERMANY: BY COMPONENT, 2022–2027 (USD MILLION)
             14.3.5 FRANCE
                        14.3.5.1 Presence of aircraft manufacturers to drive market
                                     TABLE 81 FRANCE: BY PLATFORM, 2018–2021 (USD MILLION)
                                     TABLE 82 FRANCE: BY PLATFORM, 2022–2027 (USD MILLION)
                                     TABLE 83 FRANCE: BY COMPONENT, 2018–2021 (USD MILLION)
                                     TABLE 84 FRANCE: BY COMPONENT, 2022–2027 (USD MILLION)
             14.3.6 POLAND
                        14.3.6.1 Deployment and modernization of armed forces to drive market
                                     TABLE 85 POLAND: BY PLATFORM, 2018–2021 (USD MILLION)
                                     TABLE 86 POLAND: BY PLATFORM, 2022–2027 (USD MILLION)
                                     TABLE 87 POLAND: BY COMPONENT, 2018–2021 (USD MILLION)
                                     TABLE 88 POLAND: BY COMPONENT, 2022–2027 (USD MILLION)
             14.3.7 REST OF EUROPE
                        14.3.7.1 Increasing instances of cross-border conflicts to drive market
                                     TABLE 89 REST OF EUROPE: BY PLATFORM, 2018–2021 (USD MILLION)
                                     TABLE 90 REST OF EUROPE: BY PLATFORM, 2022–2027 (USD MILLION)
                                     TABLE 91 REST OF EUROPE: BY COMPONENT, 2018–2021 (USD MILLION)
                                     TABLE 92 REST OF EUROPE: BY COMPONENT, 2022–2027 (USD MILLION)
     14.4 ASIA PACIFIC 
             14.4.1 PESTLE ANALYSIS: ASIA PACIFIC
                        FIGURE 36 ASIA PACIFIC: SNAPSHOT
                        TABLE 93 ASIA PACIFIC: BY PLATFORM, 2018–2021 (USD MILLION)
                        TABLE 94 ASIA PACIFIC: BY PLATFORM, 2022–2027 (USD MILLION)
                        TABLE 95 ASIA PACIFIC: BY FREQUENCY, 2018–2021 (USD MILLION)
                        TABLE 96 ASIA PACIFIC: BY FREQUENCY, 2022–2027 (USD MILLION)
                        TABLE 97 ASIA PACIFIC: BY COMPONENT, 2018–2021 (USD MILLION)
                        TABLE 98 ASIA PACIFIC: BY COMPONENT, 2022–2027 (USD MILLION)
                        TABLE 99 ASIA PACIFIC: BY POINT OF SALE, 2018–2021 (USD MILLION)
                        TABLE 100 ASIA PACIFIC: BY POINT OF SALE, 2022–2027 (USD MILLION)
                        TABLE 101 ASIA PACIFIC: BY COUNTRY, 2018–2021 (USD MILLION)
                        TABLE 102 ASIA PACIFIC: BY COUNTRY, 2022–2027 (USD MILLION)
             14.4.2 CHINA
                        14.4.2.1 Instability across borders and neighboring countries drives market
                                     TABLE 103 CHINA: BY PLATFORM, 2018–2021 (USD MILLION)
                                     TABLE 104 CHINA: BY PLATFORM, 2022–2027 (USD MILLION)
                                     TABLE 105 CHINA: BY COMPONENT, 2018–2021 (USD MILLION)
                                     TABLE 106 CHINA: BY COMPONENT, 2022–2027 (USD MILLION)
             14.4.3 INDIA
                        14.4.3.1 Ongoing military modernization, self-reliant India campaign, and infrastructural revolution to fuel market growth
                                     TABLE 107 INDIA: BY PLATFORM, 2018–2021 (USD MILLION)
                                     TABLE 108 INDIA: BY PLATFORM, 2022–2027 (USD MILLION)
                                     TABLE 109 INDIA: BY COMPONENT, 2018–2021 (USD MILLION)
                                     TABLE 110 INDIA: BY COMPONENT, 2022–2027 (USD MILLION)
             14.4.4 SINGAPORE
                        14.4.4.1 Focus on strengthening military capabilities to fuel market growth
                                     TABLE 111 SINGAPORE: BY PLATFORM, 2018–2021 (USD MILLION)
                                     TABLE 112 SINGAPORE: BY PLATFORM, 2022–2027 (USD MILLION)
                                     TABLE 113 SINGAPORE: BY COMPONENT, 2018–2021 (USD MILLION)
                                     TABLE 114 SINGAPORE: BY COMPONENT, 2022–2027 (USD MILLION)
             14.4.5 SOUTH KOREA
                        14.4.5.1 Focus on acquiring various surveillance and missile defense systems
                                     TABLE 115 SOUTH KOREA: BY PLATFORM, 2018–2021 (USD MILLION)
                                     TABLE 116 SOUTH KOREA: BY PLATFORM, 2022–2027 (USD MILLION)
                                     TABLE 117 SOUTH KOREA: BY COMPONENT, 2018–2021 (USD MILLION)
                                     TABLE 118 SOUTH KOREA: BY COMPONENT, 2022–2027 (USD MILLION)
             14.4.6 JAPAN
                        14.4.6.1 Enhancement of defense and surveillance capabilities to drive market
                                     TABLE 119 JAPAN: BY PLATFORM, 2018–2021 (USD MILLION)
                                     TABLE 120 JAPAN: BY PLATFORM, 2022–2027 (USD MILLION)
                                     TABLE 121 JAPAN: BY COMPONENT, 2018–2021 (USD MILLION)
                                     TABLE 122 JAPAN: BY COMPONENT, 2022–2027 (USD MILLION)
             14.4.7 AUSTRALIA
                        14.4.7.1 Rising incidences of violence resulting in upgrading of communication equipment
                                     TABLE 123 AUSTRALIA: BY PLATFORM, 2018–2021 (USD MILLION)
                                     TABLE 124 AUSTRALIA: BY PLATFORM, 2022–2027 (USD MILLION)
                                     TABLE 125 AUSTRALIA: BY COMPONENT, 2018–2021 (USD MILLION)
                                     TABLE 126 AUSTRALIA: BY COMPONENT, 2022–2027 (USD MILLION)
             14.4.8 REST OF ASIA PACIFIC
                        TABLE 127 REST OF ASIA PACIFIC: BY PLATFORM, 2018–2021 (USD MILLION)
                        TABLE 128 REST OF ASIA PACIFIC: BY PLATFORM, 2022–2027 (USD MILLION)
                        TABLE 129 REST OF ASIA PACIFIC: BY COMPONENT, 2018–2021 (USD MILLION)
                        TABLE 130 REST OF ASIA PACIFIC: BY COMPONENT, 2022–2027 (USD MILLION)
     14.5 REST OF THE WORLD 
             14.5.1 PESTLE ANALYSIS: REST OF THE WORLD
                        TABLE 131 REST OF THE WORLD: BY PLATFORM, 2018–2021 (USD MILLION)
                        TABLE 132 REST OF THE WORLD: BY PLATFORM, 2022–2027 (USD MILLION)
                        TABLE 133 REST OF THE WORLD: BY COMPONENT, 2018–2021 (USD MILLION)
                        TABLE 134 REST OF THE WORLD: BY COMPONENT, 2022–2027 (USD MILLION)
                        TABLE 135 REST OF THE WORLD: BY FREQUENCY, 2018–2021 (USD MILLION)
                        TABLE 136 REST OF THE WORLD: BY FREQUENCY, 2022–2027 (USD MILLION)
                        TABLE 137 REST OF THE WORLD: BY POINT OF SALE, 2018–2021 (USD MILLION)
                        TABLE 138 REST OF THE WORLD: BY POINT OF SALE, 2022–2027 (USD MILLION)
                        TABLE 139 REST OF THE WORLD: BY REGION, 2018–2021 (USD MILLION)
                        TABLE 140 REST OF THE WORLD: BY REGION, 2022–2027 (USD MILLION)
             14.5.2 MIDDLE EAST
                        14.5.2.1 Technological advancements in tactical communication projected to drive market
                                     TABLE 141 MIDDLE EAST: BY PLATFORM, 2018–2021 (USD MILLION)
                                     TABLE 142 MIDDLE EAST: BY PLATFORM, 2022–2027 (USD MILLION)
                                     TABLE 143 MIDDLE EAST: BY COMPONENT, 2018–2021 (USD MILLION)
                                     TABLE 144 MIDDLE EAST: BY COMPONENT, 2022–2027 (USD MILLION)
             14.5.3 LATIN AMERICA & AFRICA
                        14.5.3.1 Increased demand for military UAVs will boost market
                                     TABLE 145 LATIN AMERICA & AFRICA: BY PLATFORM, 2018–2021 (USD MILLION)
                                     TABLE 146 LATIN AMERICA & AFRICA: BY PLATFORM, 2022–2027 (USD MILLION)
                                     TABLE 147 LATIN AMERICA & AFRICA: BY COMPONENT, 2018–2021 (USD MILLION)
                                     TABLE 148 LATIN AMERICA & AFRICA: BY COMPONENT, 2022–2027 (USD MILLION)
 
15 COMPETITIVE LANDSCAPE (Page No. - 157)
     15.1 INTRODUCTION 
     15.2 MARKET SHARE ANALYSIS, 2021 
             TABLE 149 DEGREE OF COMPETITION
             FIGURE 37 SHARE OF TOP PLAYERS IN TACTICAL DATA LINK MARKET, 2021(%)
     15.3 REVENUE ANALYSIS, 2021 
             FIGURE 38 REVENUE ANALYSIS OF TOP 5 MARKET PLAYERS, 2021
     15.4 MARKET RANKING ANALYSIS, 2021 
             FIGURE 39 RANKING ANALYSIS OF 5 PLAYERS: TACTICAL DATA LINK MARKET, 2021
     15.5 COMPANY FOOTPRINT ANALYSIS 
             TABLE 150 COMPANY PRODUCT FOOTPRINT
             TABLE 151 COMPANY COMPONENT FOOTPRINT
             TABLE 152 COMPANY REGION FOOTPRINT
     15.6 COMPANY EVALUATION MATRIX 
             15.6.1 STARS
             15.6.2 EMERGING LEADERS
             15.6.3 PERVASIVE PLAYERS
             15.6.4 PARTICIPANTS
                        FIGURE 40 COMPANY EVALUATION MATRIX (KEY PLAYERS), 2021
     15.7 COMPANY EVALUATION MATRIX (STARTUPS/SMES) 
             15.7.1 PROGRESSIVE COMPANIES
             15.7.2 RESPONSIVE COMPANIES
             15.7.3 DYNAMIC COMPANIES
             15.7.4 STARTING BLOCKS
                        FIGURE 41 COMPANY EVALUATION MATRIX (STARTUPS/SMES), 2021
             15.7.5 COMPETITIVE BENCHMARKING
                        TABLE 153 KEY STARTUPS/SMES
                        TABLE 154 COMPETITIVE BENCHMARKING OF KEY STARTUPS/SMES
     15.8 COMPETITIVE SCENARIO 
             15.8.1 PRODUCT LAUNCHES
                        TABLE 155 PRODUCT LAUNCHES, NOVEMBER 2021–MARCH 2022
             15.8.2 DEALS
                        TABLE 156 DEALS, MARCH 2019–MAY 2022
             15.8.3 EXPANSIONS
                        TABLE 157 TACTICAL DATA LINK MARKET: EXPANSIONS, JANUARY 2020–DECEMBER 2020
 
16 COMPANY PROFILES (Page No. - 176)
(Business overview, Products/Solutions/Services offered, Recent Developments, MnM view, Key strengths, Strategic choices, Weaknesses and competitive threats) *  
     16.1 KEY PLAYERS 
             16.1.1 BAE SYSTEMS
                        TABLE 158 BAE SYSTEMS: BUSINESS OVERVIEW
                        FIGURE 42 BAE SYSTEMS: COMPANY SNAPSHOT
                        TABLE 159 BAE SYSTEMS: DEALS
             16.1.2 GENERAL DYNAMICS CORPORATION
                        TABLE 160 GENERAL DYNAMICS CORPORATION: BUSINESS OVERVIEW
                        FIGURE 43 GENERAL DYNAMICS CORPORATION: COMPANY SNAPSHOT
                        TABLE 161 GENERAL DYNAMICS CORPORATION: DEALS
             16.1.3 COLLINS AEROSPACE
                        TABLE 162 COLLINS AEROSPACE: BUSINESS OVERVIEW
                        TABLE 163 COLLINS AEROSPACE: PRODUCTS/SOLUTIONS/SERVICES OFFERED
                        TABLE 164 COLLINS AEROSPACE.: CONTRACT
                        TABLE 165 COLLINS AEROSPACE: DEALS
             16.1.4 HONEYWELL INTERNATIONAL INC.
                        TABLE 166 HONEYWELL INTERNATIONAL INC.: BUSINESS OVERVIEW
                        FIGURE 44 HONEYWELL INTERNATIONAL INC.: COMPANY SNAPSHOT
                        TABLE 167 HONEYWELL INTERNATIONAL INC.: NEW PRODUCT DEVELOPMENT
             16.1.5 NORTHROP GRUMMAN CORPORATION
                        TABLE 168 NORTHROP GRUMMAN CORPORATION: BUSINESS OVERVIEW
                        FIGURE 45 NORTHROP GRUMMAN CORPORATION: COMPANY SNAPSHOT
                        TABLE 169 NORTHROP GRUMMAN CORPORATION: PRODUCTS/SOLUTIONS/SERVICES OFFERED?
                        TABLE 170 NORTHROP GRUMMAN CORPORATION: DEALS
             16.1.6 L3HARRIS TECHNOLOGIES, INC.
                        TABLE 171 L3HARRIS TECHNOLOGIES, INC.: BUSINESS OVERVIEW
                        TABLE 172 L3HARRIS TECHNOLOGIES, INC.: PRODUCTS/SERVICES/SOLUTIONS OFFERED?
                        TABLE 173 L3HARRIS TECHNOLOGIES, INC.: DEALS
             16.1.7 VIASAT INC.
                        TABLE 174 VIASAT INC.: BUSINESS OVERVIEW
                        FIGURE 47 VIASAT INC.: COMPANY SNAPSHOT
                        TABLE 175 VIASAT INC.: PRODUCTS/SERVICES/SOLUTIONS OFFERED
                        TABLE 176 VIASAT INC.: DEALS
             16.1.8 THALES GROUP
                        TABLE 177 THALES GROUP: BUSINESS OVERVIEW
                        FIGURE 48 THALES GROUP: COMPANY SNAPSHOT
                        TABLE 178 THALES GROUP: PRODUCTS/SOLUTIONS/SERVICES OFFERED?
                        TABLE 179 THALES GROUP: DEALS
             16.1.9 LOCKHEED MARTIN CORPORATION
                        TABLE 180 LOCKHEED MARTIN CORPORATION: BUSINESS OVERVIEW
                        FIGURE 49 LOCKHEED MARTIN CORPORATION: COMPANY SNAPSHOT
             16.1.10 LEONARDO S.P.A.
                        TABLE 181 LEONARDO S.P.A.: BUSINESS OVERVIEW
                        FIGURE 50 LEONARDO S.P.A.: COMPANY SNAPSHOT
                        TABLE 182 LEONARDO S.P.A.: PRODUCTS/SOLUTIONS/SERVICES OFFERED
                        TABLE 183 LEONARDO S.P.A.: DEALS
             16.1.11 ELBIT SYSTEMS LTD.
                        TABLE 184 ELBIT SYSTEMS LTD.: BUSINESS OVERVIEW
                        FIGURE 51 ELBIT SYSTEMS LTD.: COMPANY SNAPSHOT
                        TABLE 185 ELBIT SYSTEMS LTD.: PRODUCTS/SOLUTIONS/SERVICES OFFERED
                        TABLE 186 ELBIT SYSTEMS LTD.: DEALS
             16.1.12 SAAB AB
                        TABLE 187 SAAB AB: BUSINESS OVERVIEW
                        FIGURE 52 SAAB AB: COMPANY SNAPSHOT
                        TABLE 188 SAAB AB: PRODUCTS/SOLUTIONS/SERVICES OFFERED
             16.1.13 CURTISS-WRIGHT CORPORATION
                        TABLE 189 CURTISS-WRIGHT CORPORATION: BUSINESS OVERVIEW
                        FIGURE 53 CURTISS-WRIGHT CORPORATION: COMPANY SNAPSHOT
                        TABLE 190 CURTISS-WRIGHT CORPORATION: DEALS
     16.2 OTHER PLAYERS 
             16.2.1 ASELSAN A.S.
                        TABLE 191 ASELSAN A.S.: BUSINESS OVERVIEW
                        FIGURE 54 ASELSAN A.S.: COMPANY SNAPSHOT
             16.2.2 IBM
                        TABLE 192 IBM: BUSINESS OVERVIEW
                        FIGURE 55 IBM: COMPANY SNAPSHOT
             16.2.3 BHARAT ELECTRONICS LTD.
                        TABLE 193 BHARAT ELECTRONICS LTD.: BUSINESS OVERVIEW
                        FIGURE 56 BHARAT ELECTRONICS LTD.: COMPANY SNAPSHOT
                        TABLE 194 BHARAT ELECTRONICS LTD.: NEW PRODUCT DEVELOPMENTS
             16.2.4 LEIDOS HOLDINGS INC.
                        TABLE 195 LEIDOS HOLDINGS INC.: BUSINESS OVERVIEW
                        FIGURE 57 LEIDOS HOLDINGS INC.: COMPANY SNAPSHOT
                        TABLE 196 LEIDOS HOLDINGS INC.: DEALS
             16.2.5 COBHAM ADVANCED ELECTRONIC SOLUTIONS INC.
                        TABLE 197 COBHAM ADVANCED ELECTRONIC SOLUTIONS INC.: BUSINESS OVERVIEW
                        TABLE 198 COBHAM ADVANCED ELECTRONIC SOLUTIONS INC.: PRODUCTS OFFERED
                        TABLE 199 COBHAM ADVANCED ELECTRONIC SOLUTIONS INC.: DEALS
             16.2.6 RHODE & SCHWARZ
                        TABLE 200 RHODE & SCHWARZ: BUSINESS OVERVIEW
                        TABLE 201 RHODE & SCHWARZ: PRODUCTS OFFERED
                        TABLE 202 RHODE & SCHWARZ: NEW PRODUCT DEVELOPMENTS
                        TABLE 203 RHODE & SCHWARZ: DEALS
             16.2.7 DATA LINK SOLUTIONS
                        TABLE 204 DATA LINK SOLUTIONS: BUSINESS OVERVIEW
                        TABLE 205 DATA LINK SOLUTIONS: PRODUCTS OFFERED
                        TABLE 206 DATA LINK SOLUTIONS: DEALS
             16.2.8 KONGSBERG
                        TABLE 207 KONGSBERG: BUSINESS OVERVIEW
                        FIGURE 58 KONGSBERG: COMPANY SNAPSHOT
                        TABLE 208 KONGSBERG: PRODUCTS/SOLUTIONS/SERVICES OFFERED
             16.2.9 ULTRA ELECTRONICS
                        TABLE 209 ULTRA ELECTRONICS: BUSINESS OVERVIEW
                        FIGURE 59 ULTRA ELECTRONICS: COMPANY SNAPSHOT
                        TABLE 210 ULTRA ELECTRONICS: PRODUCTS/SOLUTIONS/SERVICES OFFERED?
                        TABLE 211 ULTRA ELECTRONICS: DEALS
             16.2.10 TERMA
                        TABLE 212 TERMA: BUSINESS OVERVIEW
                        TABLE 213 TERMA: PRODUCTS/SOLUTIONS/SERVICES OFFERED?
                        TABLE 214 TERMA: DEALS
             16.2.11 HENSOLDT
                        TABLE 215 HENSOLDT: BUSINESS OVERVIEW
                        FIGURE 60 HENSOLDT: COMPANY SNAPSHOT
                        TABLE 216 HENSOLDT: PRODUCTS/SOLUTIONS/SERVICES OFFERED
*Details on Business overview, Products/Solutions/Services offered, Recent Developments, MnM view, Key strengths, Strategic choices, Weaknesses and competitive threats might not be captured in case of unlisted companies.  
 
17 APPENDIX (Page No. - 230)
     17.1 DISCUSSION GUIDE 
     17.2 KNOWLEDGESTORE: MARKETSANDMARKETS’ SUBSCRIPTION PORTAL 
     17.3 AVAILABLE CUSTOMIZATIONS 
     17.4 RELATED REPORTS 
     17.5 AUTHOR DETAILS 
 

The study involved four major activities in estimating the current size of the tactical data link market. Exhaustive secondary research was done to collect information on the market, peer market, and parent market. The next step was to validate these findings, assumptions, and sizing with industry experts across the value chain through primary research. Both top-down and bottom-up approaches were employed to estimate the complete market size. After that, market breakdown and data triangulation were used to estimate the market size of segments and subsegments.

Secondary Research

The market share of companies offering tactical data links was arrived at based on the secondary data available through paid and unpaid sources and by analyzing the product portfolios of major companies and rating them based on their performance and quality.

In the secondary research process, sources such as government sources; SIPRI; corporate filings such as annual reports, press releases, and investor presentations of companies; white papers, journals, and certified publications; and articles by recognized authors, directories, and databases were used to identify and collect information for this study.

Secondary research was mainly used to obtain key information about the industry’s value and supply chain and to identify the key players by various products, market classifications, and segmentation according to their offerings and industry trends related to tactical data link components, platforms, and regions, and key developments from both, market- and technology-oriented perspectives.

Primary Research

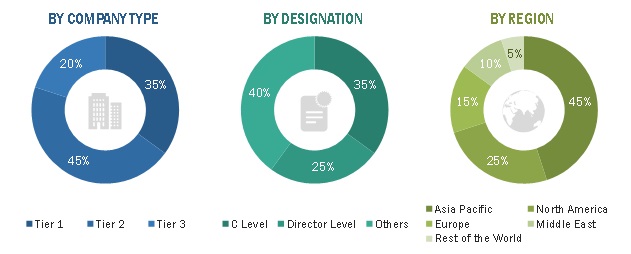
In the primary research process, various sources from the supply and demand sides were interviewed to obtain qualitative and quantitative information on the market. Primary sources from the supply side included industry experts such as vice presidents (VPs); directors from business development, marketing, and product development/innovation teams; related key executives from marine vessel manufacturers; aircraft manufacturers; tactical data links manufacturers; integrators; and key opinion leaders.
Tactical Data Link Market  Size, and Share

To know about the assumptions considered for the study, download the pdf brochure

Market Size Estimation

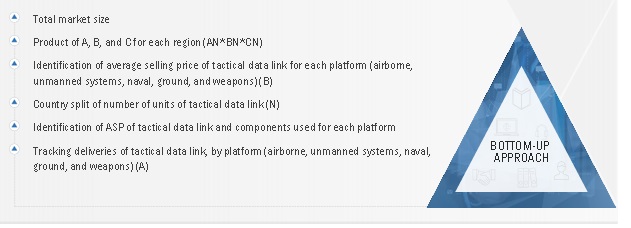
Both top-down and bottom-up approaches were used to estimate and validate the total size of the tactical data link market. These methods were also used extensively to estimate the size of various segments and subsegment of the market. The research methodology used to estimate the market size included the following:

  • Key players in the industry and market were identified through extensive secondary research of their product matrix and geographical presence and developments undertaken by them.
  • All percentage shares, splits, and breakdowns were determined using secondary sources and verified through primary sources.

Tactical Data Link Market Size: Bottom-Up Approach
Tactical Data Link Market  Size, and Share

To know about the assumptions considered for the study, Request for Free Sample Report

Data Triangulation

After arriving at the overall market size, the total market was split into several segments and subsegments. The data triangulation and market breakdown procedures explained below were implemented, wherever applicable, to complete the overall market engineering process and arrive at the estimated market numbers for tactical data link segments and subsegments. The data was triangulated by studying various factors and trends from both, the demand and supply sides. Along with this, the market size was validated using the top-down and bottom-up approaches.

The following figure indicates the market breakdown structure and the data triangulation procedure implemented in the market engineering process used to develop this report.

Report Objectives

  • To define, describe, segment, and forecast the size of the tactical data link market based on platform, application, component, frequency, data link type, point of sale, military standard, and region for the forecast period from 2022 to 2027
  • To forecast the size of various segments of the tactical data link market with respect to 6 major regions namely, North America, Europe, Asia Pacific, Rest of the World which consists of the Middle East and Latin America & Africa
  • To identify and analyze key drivers, restraints, opportunities, and challenges influencing the growth of the tactical data link market
  • To identify the opportunities for stakeholders in the market by identifying key market and technology trends
  • To analyze competitive developments such as contracts, agreements, acquisitions & partnerships, new product launches & developments, and Research & Development (R&D) activities in the tactical data link market.
  • To anticipate the status of the tactical data link market procurements by different countries, technological advancements in tactical data links; and joint developments undertaken by leading players to analyze the degree of competition in the market
  • To provide a comprehensive competitive landscape of the tactical data link market, along with an overview of the different strategies adopted by the key market players to strengthen their position in the market

Available Customizations

MarketsandMarkets offers the following customizations for this market report:

  • Market sizing and forecast for additional countries
  • By platform, by data link type breakdown at country level
  • Additional five companies profiling

Product Analysis

  • Product matrix, which provides a detailed comparison of the product portfolio of each company in the tactical data link market
Custom Market Research Services

We will customize the research for you, in case the report listed above does not meet with your exact requirements. Our custom research will comprehensively cover the business information you require to help you arrive at strategic and profitable business decisions.

Request Customization

Instant Answers with GPT - Ask Now!

Ask real questions. Get complete answers !
Report Code
AS 5655
Published ON
Jun, 2022
Choose License Type
BUY NOW
  • SHARE
X
Request Customization
Speak to Analyst
Speak to Analyst
OR FACE-TO-FACE MEETING
PERSONALIZE THIS RESEARCH
  • Triangulate with your Own Data
  • Get Data as per your Format and Definition
  • Gain a Deeper Dive on a Specific Application, Geography, Customer or Competitor
  • Any level of Personalization
REQUEST A FREE CUSTOMIZATION
LET US HELP YOU!
  • What are the Known and Unknown Adjacencies Impacting the Tactical Data Link Market
  • What will your New Revenue Sources be?
  • Who will be your Top Customer; what will make them switch?
  • Defend your Market Share or Win Competitors
  • Get a Scorecard for Target Partners
CUSTOMIZED WORKSHOP REQUEST
  • Call Us
  • +1-888-600-6441 (Corporate office hours)
  • +1-888-600-6441 (US/Can toll free)
  • +44-800-368-9399 (UK office hours)
CONNECT WITH US
ABOUT TRUST ONLINE
©2024 MarketsandMarkets Research Private Ltd. All rights reserved
DMCA.com Protection Status
Website Feedback