Tactical Optics Market by Product (Weapon Scopes & Sights, Handheld Sighting Devices, Cameras & Displays), Platform, Application (ISR, Target Acquisition & Identification, Border & Coastal Patrol), End Use, Range, and Region - Global Forecast to 2035


Tactical Optics Market Summary
The global Tactical Optics Market is estimated to reach approximately USD 3.25 billion in 2025 and is projected to grow to USD 6.90 billion by 2035, registering a CAGR of 7.8% during the forecast period. The market is experiencing sustained growth driven by increasing defense modernization programs, rising demand for precision targeting systems, and the expanding use of optics in law enforcement and civilian applications. The integration of artificial intelligence (AI), Internet of Things (IoT), and automation is transforming tactical optics into smart, connected systems capable of real-time data processing, enhanced target acquisition, and improved situational awareness. Digital transformation in defense ecosystems, along with advancements in sensor fusion, augmented reality (AR), and lightweight materials, is accelerating the adoption of next-generation tactical optics across global markets.
Key Market Trends & Insights
The Tactical Optics Market is evolving rapidly under the influence of technological innovation and geopolitical dynamics. North America continues to dominate the market due to its high defense expenditure, strong presence of leading manufacturers, and continuous investments in advanced targeting technologies. Asia Pacific is emerging as the fastest-growing region, driven by rising defense budgets, territorial tensions, and indigenous production initiatives.
Rifle scopes remain the dominant product segment due to their widespread use across military and civilian applications, while night vision and thermal imaging optics are witnessing accelerated growth due to their critical role in low-light and surveillance operations. The emergence of AI-powered optics capable of automatic target detection and ballistic correction is reshaping operational capabilities. Additionally, the integration of IoT-enabled connectivity is enabling seamless data exchange between optics and command systems.
Automation is enhancing user efficiency by reducing manual adjustments and improving accuracy, while advancements in digital optics and smart sensors are creating new growth opportunities in both defense and commercial sectors.
Market Size & Forecast
-
Base year market size (2025): USD 3.25 billion
-
Forecast value by 2035: USD 6.90 billion
-
CAGR (2025–2035): 7.8%
-
Growth is driven by increasing defense modernization, adoption of AI-enabled optics, rising demand for surveillance systems, and technological advancements in imaging and sensor technologies
Tactical Optics Market Top 10 key takeaway
-
The market is expected to more than double by 2035 due to increasing defense investments
-
AI-enabled tactical optics are gaining rapid adoption in military operations
-
North America leads the market with advanced technological infrastructure
-
Asia Pacific is the fastest-growing region due to rising defense budgets
-
Rifle scopes dominate the product segment globally
-
Thermal and night vision optics are witnessing strong growth
-
IoT integration is enabling connected battlefield ecosystems
-
Automation is improving accuracy and reducing human error
-
Civilian applications such as hunting and sports shooting are expanding demand
-
Digital transformation is accelerating innovation in optics technology
Product Insights
Rifle scopes represent the leading product segment within the Tactical Optics Market, primarily due to their extensive use in military operations, law enforcement, and civilian shooting sports. Their dominance is attributed to advancements in magnification technology, durability, and precision targeting capabilities. Modern rifle scopes are increasingly equipped with digital overlays, rangefinding capabilities, and ballistic calculators, making them indispensable tools for precision shooting.
Night vision and thermal imaging devices are emerging as high-growth segments, driven by the increasing need for surveillance and combat effectiveness in low-light and no-light conditions. These optics are widely deployed in border security, counter-terrorism operations, and reconnaissance missions. The demand for compact, lightweight, and multi-functional optics is further pushing innovation in product design.
Emerging categories such as smart optics and hybrid systems are gaining traction, integrating AI algorithms for automatic target recognition and environmental adaptation. These advancements are enhancing operational efficiency while reducing dependency on manual input, making tactical optics more effective in dynamic combat environments.
Technology / Component Insights (Rename based on keyword if needed)
The Tactical Optics Market is being driven by rapid advancements in imaging technologies, sensor integration, and digital processing capabilities. AI is playing a transformative role by enabling features such as automatic target detection, real-time tracking, and predictive ballistic adjustments. These capabilities significantly enhance accuracy and reduce response time in critical situations.
IoT integration is facilitating seamless communication between optics systems and broader defense networks, enabling real-time data sharing and improved situational awareness. Cloud-based analytics platforms are increasingly being used to process large volumes of data collected by smart optics, providing actionable insights for military operations.
Automation technologies are improving stabilization and calibration processes, ensuring consistent performance across varying environmental conditions. Future innovation trends include the development of augmented reality (AR)-enabled optics, advanced sensor fusion systems, and edge computing capabilities that allow real-time data processing without reliance on centralized systems.
Application Insights
The military segment remains the largest application area in the Tactical Optics Market, driven by the increasing demand for advanced targeting and surveillance systems. Tactical optics are essential components in modern warfare, enabling precision engagement, enhanced visibility, and improved situational awareness.
Law enforcement agencies represent another significant application segment, utilizing tactical optics for surveillance, crowd control, and tactical operations. The growing need for public safety and crime prevention is contributing to increased adoption in this sector.
Civilian applications, including hunting, shooting sports, and personal security, are also expanding rapidly. The availability of advanced optics at competitive prices, coupled with increasing interest in recreational shooting activities, is driving demand in this segment. Future opportunities lie in integrating tactical optics with autonomous systems and unmanned platforms, further expanding their application scope.
Regional Insights
North America leads the Tactical Optics Market, supported by high defense spending, technological advancements, and strong industry presence. The region is at the forefront of adopting AI-enabled optics and advanced imaging technologies, making it a key driver of global market growth.
Europe is witnessing steady growth, driven by modernization of defense systems and increasing investments in border security and surveillance technologies. Collaborative defense initiatives across European nations are further supporting market expansion.
Asia Pacific is the fastest-growing region, fueled by rising geopolitical tensions, increasing defense budgets, and rapid industrialization. Countries in this region are focusing on developing indigenous defense capabilities, leading to increased demand for tactical optics.
-
North America dominates due to advanced defense infrastructure
-
Europe shows consistent growth with modernization programs
-
Asia Pacific is the fastest-growing region globally
-
Rising geopolitical tensions are driving demand across regions
-
Increasing investment in surveillance technologies is boosting market growth
Country-Specific Market Trends
In Asia Pacific, China is experiencing a CAGR of approximately 9.2%, driven by large-scale military modernization and investments in advanced defense technologies. Japan is also witnessing steady growth, supported by increased defense spending and focus on technological innovation.
In North America, the United States continues to dominate with a CAGR of around 7.5%, driven by continuous investment in next-generation military systems. Canada and Mexico are gradually increasing their defense capabilities, focusing on modernization and border security.
In Europe, Germany and France are leading the market with CAGRs of approximately 7.3% and 7.1%, respectively. These countries are investing heavily in advanced optics technologies to enhance their defense capabilities and maintain regional security.
-
China leads growth in Asia Pacific with strong defense investments
-
Japan focuses on technological innovation and modernization
-
The United States remains the largest market globally
-
Germany and France drive growth in Europe
-
Government policies and defense budgets are key growth drivers
Key Tactical Optics Market Company Insights
The Tactical Optics Market is highly competitive, with key players focusing on innovation, product differentiation, and technological integration. Leading companies such as L3Harris Technologies, Thales Group, Elbit Systems, FLIR Systems, BAE Systems, and Leupold & Stevens are at the forefront of market development.
These companies are investing heavily in research and development to introduce AI-enabled optics, advanced imaging systems, and lightweight, durable products. Strategic collaborations with defense agencies and technology firms are enabling them to expand their market presence and enhance product capabilities.
The focus on integrating smart technologies, improving optical clarity, and enhancing durability is shaping competitive strategies. Companies are also exploring opportunities in civilian markets, diversifying their product portfolios to cater to a broader customer base.
-
Companies are prioritizing AI-enabled product development
-
Strategic partnerships are enhancing technological capabilities
-
Focus on lightweight and durable materials is increasing
-
Expansion into civilian markets is driving revenue growth
-
Continuous R&D investment is fueling innovation
Recent Developments
Recent developments in the Tactical Optics Market reflect a strong focus on innovation and collaboration. Several leading manufacturers have launched AI-powered rifle scopes with integrated ballistic calculators and real-time target tracking capabilities, significantly enhancing operational efficiency.
In addition, partnerships between defense contractors and technology companies are enabling the integration of advanced analytics and IoT connectivity into tactical optics systems. Governments across various regions are also awarding contracts for the development of next-generation optics as part of broader defense modernization initiatives.
Market Segmentation
The Tactical Optics Market is segmented based on product, technology/component, application, and region. By product, the market includes rifle scopes, red dot sights, night vision devices, and thermal imaging optics. Each product category serves distinct operational requirements, with rifle scopes dominating due to their versatility and widespread use.
From a technology perspective, the market encompasses traditional optical systems, digital optics, AI-enabled targeting systems, and IoT-integrated components. These technologies are driving advancements in accuracy, connectivity, and performance.
Applications are categorized into military, law enforcement, and civilian sectors, each contributing to overall market growth. Regionally, the market is divided into North America, Europe, Asia Pacific, and the rest of the world, with varying adoption rates and growth dynamics.
-
Rifle scopes dominate the product segment
-
AI-enabled systems are driving technological advancements
-
Military applications hold the largest market share
-
Civilian applications are expanding rapidly
-
Asia Pacific is emerging as a key growth region
Conclusion
The Tactical Optics Market is set to experience robust growth through 2035, driven by the increasing integration of AI, IoT, and automation into defense systems. As modern warfare continues to evolve, the demand for advanced optics capable of delivering precision, reliability, and enhanced situational awareness will remain strong.
The market presents significant opportunities for innovation, particularly in the development of smart optics and autonomous systems. Companies that invest in cutting-edge technologies and align their strategies with evolving defense requirements will be well-positioned to capitalize on this growth. Overall, tactical optics will play a critical role in shaping the future of defense and security operations worldwide.
FAQs
1. What is the current market size of the Tactical Optics Market?
The market size is estimated at USD 3.25 billion in 2025.
2. What is the expected growth rate of the market?
The market is projected to grow at a CAGR of 7.8% from 2025 to 2035.
3. What are the key drivers of market growth?
Key drivers include defense modernization, AI integration, IoT adoption, and increasing demand for precision targeting systems.
4. Which region leads the Tactical Optics Market?
North America is the leading region due to high defense spending and advanced technology adoption.
5. Who are the major players in the market?
Major players include L3Harris Technologies, Thales Group, Elbit Systems, FLIR Systems, BAE Systems, and Leupold & Stevens.
 Exclusive indicates content/data unique to MarketsandMarkets and not available with any competitors.
TABLE OF CONTENTS
1 INTRODUCTION (Page No. - 26)
1.1 OBJECTIVES OF THE STUDY
1.2 MARKET DEFINITION
1.2.1 MARKETS COVERED
1.2.2 REGIONAL SCOPE
1.2.3 YEARS CONSIDERED FOR THE STUDY
1.3 CURRENCY & PRICING
1.4 USD EXCHANGE RATES
1.5 LIMITATIONS
1.6 MARKET STAKEHOLDERS
2 RESEARCH METHODOLOGY (Page No. - 30)
2.1 RESEARCH DATA
2.1.1 SECONDARY DATA
2.1.1.1 Key data from secondary sources
2.2 MARKET DEFINITION & SCOPE
2.2.1 PRIMARY DATA
2.2.1.1 Key data from primary sources
2.2.1.2 Breakdown of primaries
2.2.2 SEGMENT DEFINITIONS
2.2.2.1 Tactical optics market, by product
2.2.2.2 Tactical optics market, by platform
2.2.2.3 Tactical optics market, by application
2.2.2.4 Tactical optics market, by end use
2.2.2.5 Tactical optics market, by range
2.2.3 EXCLUSIONS
2.3 MARKET SIZE ESTIMATION & METHODOLOGY
2.3.1 TOP-DOWN APPROACH
2.4 DATA TRIANGULATION
2.4.1 MARKET SIZING & FORECASTING
2.5 ASSUMPTIONS OF THE RESEARCH STUDY
2.6 LIMITATIONS
2.7 LIST PRICE FOR TACTICAL OPTICS
3 EXECUTIVE SUMMARY (Page No. - 45)
4 PREMIUM INSIGHTS (Page No. - 49)
4.1 ATTRACTIVE OPPORTUNITIES IN TACTICAL OPTICS MARKET
4.2 GROUND TACTICAL OPTICS MARKET, BY VEHICLE TYPE
4.3 NAVAL TACTICAL OPTICS MARKET, BY VESSEL TYPE
4.4 AIRBORNE TACTICAL OPTICS MARKET, BY AIRCRAFT TYPE
4.5 WEAPON SCOPES & SIGHTS MARKET, BY TYPE
4.6 HANDHELD DEVICES MARKET, BY TYPE
4.7 CAMERAS & DISPLAYS MARKET, BY TYPE
4.8 TACTICAL OPTICS MARKET, BY REGION
5 MARKET OVERVIEW (Page No. - 53)
5.1 INTRODUCTION
5.2 MARKET DYNAMICS
5.2.1 DRIVERS
5.2.1.1 Increase in procurement of tactical optics for dismounted soldiers and vehicle platforms
5.2.1.2 Increasing demand for EO/IR cameras
5.2.2 OPPORTUNITIES
5.2.2.1 Weapon modernization plans across the world
5.2.3 CHALLENGES
5.2.3.1 Requirement for high technical expertise to develop tactical optics
6 INDUSTRY TRENDS (Page No. - 57)
6.1 INTRODUCTION
6.2 EMERGING TRENDS
6.2.1 ECHO3 ELECTRO-OPTICS THERMAL REFLEX SIGHT
6.2.2 FREEFORM OPTICS
6.2.3 INTELLIGENT HARDWARE SOLUTIONS
6.2.4 INTELLIGENT ENTERPRISE: COMMAND AND CONTROL ABOVE THE WEAPONS SYSTEMS
6.2.5 ADVANCEMENTS IN CAMERA TECHNOLOGY
6.2.6 ADVANCED BALLISTIC CALCULATORS
6.2.7 MINIATURIZED ELECTRO-OPTICS
6.2.8 NIGHT VISION RIFLESCOPES
6.2.9 FIBER LASER TECHNOLOGY
6.2.10 ARMORED VEHICLES WITH ADVANCED TACTICAL OPTICS FOR URBAN WARFARE
6.2.11 WEAPONIZED DRONES WITH TACTICAL OPTICS
6.3 ADVANCED TECHNOLOGIES DEVELOPED BY COMPANIES IN THE TACTICAL OPTICS MARKET
6.3.1 ADVANCED SIGHTING SYSTEM
6.3.2 ENHANCED NIGHT VISION GOGGLE (ENVG) WITH FAMILY OF WEAPON SIGHTS (FWS)
6.3.3 MICROSOFT HOLOLENS AUGMENTED REALITY HEADSET
6.3.4 HYPERCENTRIC OPTICS
6.4 INNOVATIONS & PATENT REGISTRATIONS
7 TACTICAL OPTICS MARKET, BY PRODUCT (Page No. - 64)
7.1 INTRODUCTION
7.2 WEAPON SCOPES & SIGHTS
7.2.1 RIFLESCOPES
7.2.1.1 Day Sights
7.2.1.1.1 Development of micro electro-optic systems
7.2.1.2 Night Sights
7.2.1.2.1 Increasing adoption of thermal imaging technology during low visibility/night
7.2.1.3 Digital Sights
7.2.1.3.1 Increase in disruptive technologies leading to the linkage of numerous tactical optics together to create maximum awareness on the battlefield
7.2.2 NIGHT VISION SCOPES
7.2.2.1 Thermal scopes
7.2.2.1.1 Thermal imaging technology for target detection capabilities is driving the market
7.2.2.2 Infrared scopes
7.2.2.2.1 Infrared technology assists soldiers in low light
7.2.2.3 Image intensifiers
7.2.2.3.1 Increasing investments in the defense sector boost the market for image intensifiers
7.2.3 HANDHELD SIGHTING DEVICES
7.2.3.1 Binoculars & monoculars
7.2.3.1.1 New optical technologies, such as digital zoom, thermal binoculars, and night vision binoculars, are driving the market
7.2.3.2 Night vision goggles
7.2.3.2.1 Increased adoption of head-mounted night vision goggles
7.2.3.3 Spotter scopes
7.2.3.3.1 Growing number of snipers leading to increased demand for spotter scopes
7.2.3.4 Rangefinders
7.2.3.4.1 Demand for enhanced situational awareness leading to growth in demand for rangefinders
7.2.3.5 Target acquisition & surveillance systems
7.2.3.5.1 increased use of target acquisition & surveillance systems by militaries worldwide
7.2.4 CAMERAS & DISPLAYS
7.2.4.1 Head-mounted displays (HMDs)
7.2.4.1.1 Rapid development in HMD technology for infantry soldiers
7.2.4.2 Thermal cameras
7.2.4.2.1 Increasing use of thermal cameras for border surveillance
7.2.4.3 EO/IR cameras
7.2.4.3.1 Increased use of drones with EO/IR is driving the tactical optics market
8 TACTICAL OPTICS MARKET, BY PLATFORM (Page No. - 75)
8.1 INTRODUCTION
8.2 GROUND
8.2.1 VEHICLE-MOUNTED
8.2.1.1 Increased procurement of armored vehicles by various militaries globally
8.2.1.1.1 Main battle tanks (MBTs)
8.2.1.1.2 Infantry fighting vehicles (IFVs)
8.2.1.1.3 Armored personnel carriers (APCs)
8.2.1.1.4 Armored amphibious vehicles (AAVs)
8.2.1.1.5 Light protected vehicles (LPVs)
8.2.1.1.6 Self-propelled howitzers (SPHs)
8.2.1.1.7 Armored mortar carriers (AMCs)
8.2.1.1.8 Unmanned ground vehicles (UGVs)
8.2.2 FIXED INSTALLATION
8.2.2.1 Increasing installation of high-tech cameras, sights, and ground-based interceptors with tactical optics for border surveillance and protection
8.2.3 PORTABLE
8.2.3.1 Portable military equipment comprises high-tech tactical optics used to cater to the military modernization requirements
8.2.3.2 Man-portable
8.2.3.2.1 Increasing demand for riflescopes, binoculars, and target designators is driving the market
8.2.3.3 Dismounted soldier
8.2.3.3.1 Upgrades to soldier equipment drive the market for tactical optics devices with respect to dismounted soldier
8.3 NAVAL
8.3.1 AIRCRAFT CARRIERS
8.3.1.1 Upgrades and modernization programs of aircraft carriers undertaken by various countries
8.3.2 DESTROYERS
8.3.2.1 Installation of new weapons systems on destroyers
8.3.3 FRIGATES
8.3.3.1 Increased orders for frigates by several countries such, as India, Russia, and Germany
8.3.4 CORVETTES
8.3.4.1 Ongoing upgrades of corvettes by various countries, such as India, Israel, and Finland
8.3.5 OFFSHORE PATROL VESSELS (OPVS)
8.3.5.1 Modernization programs of OPVs drive the market
8.3.6 UNMANNED MARINE VESSELS (UMVS)
8.3.6.1 Increased use of UMVs for surveillance
8.4 AIRBORNE
8.4.1 COMBAT AIRCRAFT
8.4.1.1 Upgrades and modernization programs of combat aircraft by various leading market players
8.4.2 ATTACK HELICOPTERS
8.4.2.1 Increased procurement of attack helicopters by India and South Korea, among others, drives the market
8.4.3 SPECIAL MISSION AIRCRAFT
8.4.3.1 Ongoing procurement of special mission aircraft by countries such as Finland and Bulgaria, among others, drives the market
8.4.4 UNMANNED AERIAL VEHICLES (UAVS)
8.4.4.1 Continuous development programs to utilize tactical UAVs by defense forces
9 TACTICAL OPTICS MARKET, BY APPLICATION (Page No. - 96)
9.1 INTRODUCTION
9.2 INTELLIGENCE, SURVEILLANCE & RECONNAISSANCE (ISR)
9.2.1 INCREASED NEED FOR ISR CAPABILITIES BY MILITARIES GLOBALLY
9.3 TARGET IDENTIFICATION & ACQUISITION
9.3.1 INSTALLATION OF TARGET IDENTIFICATION & ACQUISITION PRODUCTS ON VARIOUS PLATFORMS INCREASES THE DEMAND FOR TACTICAL OPTICS
9.4 SEARCH & RESCUE
9.4.1 INCREASED USE OF DRONES FOR SEARCH & RESCUE MISSIONS
9.5 BORDER & COASTAL PATROL
9.5.1 INCREASED INSTALLATION OF EO/IR CAMERAS FOR BORDER & COASTAL SURVEILLANCE
10 TACTICAL OPTICS MARKET, BY END USE (Page No. - 102)
10.1 INTRODUCTION
10.2 MANNED PLATFORM
10.2.1 NEED FOR SITUATIONAL AWARENESS DRIVES THE MARKET FOR TACTICAL OPTICS IN THE MANNED PLATFORM SEGMENT
10.3 WEAPON MOUNTED
10.3.1 PROCUREMENT OF NEW WEAPONS IS DRIVING THE WEAPON MOUNTED TACTICAL OPTICS MARKET
10.4 SOLDIER
10.4.1 VARIOUS INFANTRY MODERNIZATION PROGRAMS GLOBALLY DRIVE THE DEMAND FOR TACTICAL OPTICS
10.5 UNMANNED PLATFORM
10.5.1 INCREASING USE OF UNMANNED PLATFORMS FOR SURVEILLANCE AND ASSAULT
11 TACTICAL OPTICS MARKET, BY RANGE (Page No. - 107)
11.1 INTRODUCTION
11.2 SHORT-RANGE (< 3 KM)
11.2.1 NEED FOR HANDHELD TACTICAL OPTICS IS DRIVING THE TACTICAL OPTICS MARKET
11.3 MEDIUM-RANGE (3–25 KM)
11.3.1 INCREASING USE OF DRONES LEADING TO INCREASED DEMAND FOR MEDIUM-RANGE TACTICAL OPTICS
11.4 LONG-RANGE (> 25 KM)
11.4.1 INCREASING PROCUREMENT OF NAVAL SHIPS, AIRCRAFT, AND ARMORED VEHICLES DRIVE THE MARKET FOR LONG-RANGE TACTICAL OPTICS
12 REGIONAL ANALYSIS (Page No. - 112)
12.1 INTRODUCTION
12.2 NORTH AMERICA
12.2.1 US
12.2.1.1 Procurement of new fighter aircraft
12.2.2 CANADA
12.2.2.1 Numerous defense procurement projects for land, sea, and air platforms
12.3 EUROPE
12.3.1 FRANCE
12.3.1.1 Armored vehicle modernization program to impact the market in France
12.3.2 RUSSIA
12.3.2.1 Serial production of T-90 and T-14 Armata tanks, among others
12.3.3 UK
12.3.3.1 Orders for new family of Ajax multi-role armored vehicles in 2018-2019
12.3.4 GERMANY
12.3.4.1 Modernization programs for naval, airborne, and land fleets
12.3.5 ITALY
12.3.5.1 High procurement spending in 2019 is expected to drive the market in Italy
12.3.6 SPAIN
12.3.6.1 Three military modernization programs planned until 2032
12.3.7 POLAND
12.3.7.1 Multi-billion military modernization program by Poland
12.4 ASIA PACIFIC
12.4.1 CHINA
12.4.1.1 Major expansions in navy and air force are driving the market in China
12.4.2 INDIA
12.4.2.1 Five-year modernization plan for its armed forces is driving the market in India
12.4.3 JAPAN
12.4.3.1 Increased funding for the acquisition of new combat aircraft
12.4.4 SOUTH KOREA
12.4.4.1 Estimated multi-billion spending on arms purchase for troops in 2020
12.4.5 AUSTRALIA
12.4.5.1 Procurement of new military platforms from 2020 to 2028
12.5 MIDDLE EAST
12.5.1 SAUDI ARABIA
12.5.1.1 Multi-billion contracts with the US drive the tactical optics market in Saudi Arabia
12.5.2 TURKEY
12.5.2.1 Substantial rise in military spending in 2018
12.5.3 ISRAEL
12.5.3.1 Ongoing procurement of armored vehicles and combat aircraft to drive the market in Israel
12.6 SOUTH AMERICA
12.6.1 BRAZIL
12.6.1.1 Short and medium-term investments to modernize armed forces in Brazil
12.6.2 MEXICO
12.6.2.1 Procurement of armored vehicles and weapons for soldiers
13 COMPETITIVE LANDSCAPE – TIER 1 COMPANIES (Page No. - 175)
13.1 INTRODUCTION
13.2 COMPETITIVE ANALYSIS
13.3 MARKET RANKING ANALYSIS, 2019
13.4 COMPETITIVE LEADERSHIP MAPPING
13.4.1 VISIONARY LEADERS
13.4.2 INNOVATORS
13.4.3 DYNAMIC DIFFERENTIATORS
13.4.4 EMERGING COMPANIES
13.5 STRENGTH OF PRODUCT PORTFOLIO
13.6 BUSINESS STRATEGY EXCELLENCE
13.7 COMPETITIVE SCENARIO
13.7.1 CONTRACTS
13.7.2 NEW PRODUCT DEVELOPMENTS
13.7.3 ACQUISITIONS
14 COMPETITIVE LANDSCAPE – TIER 2 & 3 COMPANIES (Page No. - 182)
14.1 INTRODUCTION
14.2 COMPETITIVE ANALYSIS
14.3 MARKET RANKING ANALYSIS, 2019
14.4 COMPETITIVE LEADERSHIP MAPPING
14.4.1 VISIONARY LEADERS
14.4.2 INNOVATORS
14.4.3 DYNAMIC DIFFERENTIATORS
14.4.4 EMERGING COMPANIES
14.5 STRENGTH OF PRODUCT PORTFOLIO
14.6 BUSINESS STRATEGY EXCELLENCE
14.7 COMPETITIVE SCENARIO
14.7.1 CONTRACTS
14.7.2 NEW PRODUCT LAUNCHES
14.7.3 ACQUISITIONS AND PARTNERSHIPS
15 COMPANY PROFILES (Page No. - 190)
(Business Overview, Products Offered, Recent Developments, SWOT Analysis, MnM View)*
15.1 LEONARDO S.P.A.
15.2 BAE SYSTEMS, PLC
15.3 ELBIT SYSTEMS LTD.
15.4 KONGSBERG GRUPPEN AS
15.5 L3HARRIS TECHNOLOGIES
15.6 LOCKHEED MARTIN CORPORATION
15.7 NORTHROP GRUMMAN CORPORATION
15.8 RAYTHEON COMPANY
15.9 THALES GROUP
15.10 SAAB AB
15.11 RAFAEL ADVANCED DEFENSE SYSTEMS LTD
15.12 FLIR SYSTEMS, INC.
15.13 ISRAEL AEROSPACE INDUSTRIES
15.14 WUHAN JOHO TECHNOLOGY CO. LTD.
15.15 AIMPOINT
15.16 ATN CORPORATION
15.17 BUSHNELL CORPORATION
15.18 BURRIS COMPANY, INC.
15.19 LEUPOLD & STEVENS, INC.
15.20 NIGHTFORCE OPTICS
15.21 SIG SAUER, INC.
15.22 SIGHTMARK
15.23 TRIJICON INC.
15.24 VORTEX OPTICS
*Details on Business Overview, Products Offered, Recent Developments, SWOT Analysis, MnM View might not be captured in case of unlisted companies.
16 APPENDIX (Page No. - 244)
16.1 INDUSTRY EXPERTS
16.2 DISCUSSION GUIDE
16.3 KNOWLEDGE STORE: MARKETSANDMARKETS™ SUBSCRIPTION PORTAL
16.4 AVAILABLE CUSTOMIZATIONS
16.5 RELATED REPORTS
16.6 AUTHOR DETAILS
LIST OF TABLES (186 TABLES)
TABLE 1 MARKET SUMMATION
TABLE 2 SNIPER OPTICS: LIST PRICE USED FOR TACTICAL OPTICS MARKET
TABLE 3 AUTOMATIC RIFLES OPTICS: LIST PRICE USED FOR TACTICAL OPTICS MARKET
TABLE 4 BINOCULARS: LIST PRICE USED FOR TACTICAL OPTICS MARKET
TABLE 5 SPOTTING SCOPES: LIST PRICE USED FOR TACTICAL OPTICS MARKET
TABLE 6 RANGEFINDERS: LIST PRICE USED FOR TACTICAL OPTICS MARKET
TABLE 7 NIGHT VISION GOGGLES: LIST PRICE USED FOR TACTICAL OPTICS MARKET
TABLE 8 MACHINE GUN PROCUREMENT BY MILITARIES WORLDWIDE
TABLE 9 EXPECTED FUTURE REQUIREMENTS OF EO/IR CAMERAS (UNIT), BY COUNTRY
TABLE 10 BOXER ARMORED VEHICLE ARMAMENTS
TABLE 11 TYPES OF WEAPONIZED DRONES
TABLE 12 INNOVATIONS & PATENT REGISTRATIONS, 2009–2017
TABLE 13 TACTICAL OPTICS MARKET SIZE, BY PRODUCT, 2018–2025 (USD MILLION)
TABLE 14 WEAPON SCOPES & SIGHTS TACTICAL OPTICS MARKET SIZE, BY REGION, 2018–2025 (USD MILLION)
TABLE 15 WEAPON SCOPES & SIGHTS TACTICAL OPTICS MARKET SIZE, BY TYPE, 2018–2025 (USD MILLION)
TABLE 16 RIFLESCOPES TACTICAL OPTICS MARKET SIZE, BY TYPE, 2018–2025 (USD MILLION)
TABLE 17 NIGHT VISION SCOPES TACTICAL OPTICS MARKET SIZE, BY TYPE, 2018–2025 (USD MILLION)
TABLE 18 HANDHELD SIGHTING DEVICES TACTICAL OPTICS MARKET SIZE, BY TYPE, 2018–2025 (USD MILLION)
TABLE 19 HANDHELD SIGHTING DEVICES TACTICAL OPTICS MARKET SIZE, BY REGION, 2018–2025 (USD MILLION)
TABLE 20 CAMERAS & DISPLAYS TACTICAL OPTICS MARKET SIZE, BY TYPE, 2018–2025 (USD MILLION)
TABLE 21 CAMERAS & DISPLAYS TACTICAL OPTICS MARKET SIZE, BY REGION, 2018–2025 (USD MILLION)
TABLE 22 TACTICAL OPTICS MARKET SIZE, BY PLATFORM, 2018–2025 (USD MILLION)
TABLE 23 GROUND TACTICAL OPTICS MARKET SIZE, BY TYPE, 2018–2025 (USD MILLION)
TABLE 24 GROUND TACTICAL OPTICS MARKET SIZE, BY REGION, 2018–2025 (USD MILLION)
TABLE 25 VEHICLE-MOUNTED TACTICAL OPTICS MARKET SIZE, BY VEHICLE TYPE, 2018–2025 (USD MILLION)
TABLE 26 TACTICAL OPTICS: CONFIGURATIONS FOR ARMORED VEHICLES
TABLE 27 GLOBAL FLEET OF MAIN BATTLE TANKS AS OF DECEMBER 2019
TABLE 28 GLOBAL FLEET OF INFANTRY FIGHTING VEHICLES AS OF DECEMBER 2019
TABLE 29 GLOBAL FLEET OF SELF-PROPELLED HOWITZERS AS OF DECEMBER 2019
TABLE 30 PORTABLE TACTICAL OPTICS MARKET SIZE, BY PORTABLE TYPE, 2018–2025 (USD MILLION)
TABLE 31 NAVAL TACTICAL OPTICS MARKET SIZE, BY VESSEL TYPE, 2018–2025 (USD MILLION)
TABLE 32 NAVAL TACTICAL OPTICS MARKET SIZE, BY REGION, 2018–2025 (USD MILLION)
TABLE 33 NUMBER OF AIRCRAFT CARRIERS, BY COUNTRY, FEBRUARY 2020
TABLE 34 NUMBER OF DESTROYERS, BY COUNTRY, FEBRUARY 2020
TABLE 35 NUMBER OF FRIGATES, BY COUNTRY, FEBRUARY 2020
TABLE 36 NUMBER OF CORVETTES, BY COUNTRY, FEBRUARY 2020
TABLE 37 NUMBER OF OPVS, BY COUNTRY, FEBRUARY 2020
TABLE 38 AIRBORNE TACTICAL OPTICS MARKET SIZE, BY AIRCRAFT TYPE, 2018–2025 (USD MILLION)
TABLE 39 AIRBORNE TACTICAL OPTICS MARKET SIZE, BY REGION, 2018–2025 (USD MILLION)
TABLE 40 NUMBER OF FIGHTER AIRCRAFT, BY COUNTRY, FEBRUARY 2020
TABLE 41 NUMBER OF MILITARY HELICOPTERS, BY COUNTRY, FEBRUARY 2020
TABLE 42 NUMBER OF SPECIAL MISSION AIRCRAFT, BY COUNTRY, FEBRUARY 2020
TABLE 43 TACTICAL OPTICS MARKET SIZE, BY APPLICATION, 2018–2025 (USD MILLION)
TABLE 44 TACTICAL OPTICS MARKET SIZE FOR INTELLIGENCE, SURVEILLANCE, & RECONNAISSANCE, BY REGION, 2018–2025 (USD MILLION)
TABLE 45 TACTICAL OPTICS MARKET SIZE FOR TARGET IDENTIFICATION & ACQUISITION, BY REGION, 2018–2025 (USD MILLION)
TABLE 46 TACTICAL OPTICS MARKET SIZE FOR SEARCH & RESCUE, BY REGION, 2018–2025 (USD MILLION)
TABLE 47 TACTICAL OPTICS CONTRACTS, PROCUREMENTS, AND MODERNIZATION PLANS, BY APPLICATION
TABLE 48 TACTICAL OPTICS MARKET SIZE FOR BORDER & COASTAL PATROL, BY REGION, 2018–2025 (USD MILLION)
TABLE 49 TACTICAL OPTICS MARKET SIZE, BY END USE, 2018–2025 (USD MILLION)
TABLE 50 MANNED PLATFORM TACTICAL OPTICS MARKET SIZE, BY REGION, 2018–2025 (USD MILLION)
TABLE 51 WEAPON MOUNTED TACTICAL OPTICS MARKET SIZE, BY REGION, 2018–2025 (USD MILLION)
TABLE 52 SOLDIER TACTICAL OPTICS MARKET SIZE, BY REGION, 2018–2025 (USD MILLION)
TABLE 53 UNMANNED PLATFORM TACTICAL OPTICS MARKET SIZE, BY REGION, 2018–2025 (USD MILLION)
TABLE 54 TACTICAL OPTICS MARKET SIZE, BY RANGE, 2018–2025 (USD MILLION)
TABLE 55 SHORT-RANGE (< 3 KM) TACTICAL OPTICS MARKET SIZE, BY REGION, 2018–2025 (USD MILLION)
TABLE 56 MEDIUM RANGE (3-25 KM) TACTICAL OPTICS MARKET SIZE, BY REGION, 2018–2025 (USD MILLION)
TABLE 57 LONG-RANGE (> 25 KM) TACTICAL OPTICS MARKET SIZE, BY REGION, 2018–2025 (USD MILLION)
TABLE 58 TACTICAL OPTICS MARKET SIZE, BY REGION, 2018–2025 (USD MILLION)
TABLE 59 NORTH AMERICA: TACTICAL OPTICS MARKET SIZE, BY PRODUCT, 2018–2025 (USD MILLION)
TABLE 60 NORTH AMERICA: TACTICAL OPTICS MARKET SIZE, BY PLATFORM, 2018–2025 (USD MILLION)
TABLE 61 NORTH AMERICA: TACTICAL OPTICS MARKET SIZE, BY END USE, 2018–2025 (USD MILLION)
TABLE 62 NORTH AMERICA: TACTICAL OPTICS MARKET SIZE, BY APPLICATION, 2018–2025 (USD MILLION)
TABLE 63 NORTH AMERICA: GROUND TACTICAL OPTICS MARKET SIZE, BY RANGE, 2018–2025 (USD MILLION)
TABLE 64 NORTH AMERICA: VEHICLE-MOUNTED TACTICAL OPTICS MARKET SIZE, BY VEHICLE TYPE, 2018–2025 (USD MILLION)
TABLE 65 NORTH AMERICA: NAVAL TACTICAL OPTICS MARKET SIZE, BY VESSEL TYPE, 2018–2025 (USD MILLION)
TABLE 66 NORTH AMERICA: AIRBORNE TACTICAL OPTICS MARKET SIZE, BY AIRCRAFT TYPE, 2018–2025 (USD MILLION)
TABLE 67 NORTH AMERICA: TACTICAL OPTICS MARKET SIZE, BY COUNTRY, 2018–2025 (USD MILLION)
TABLE 68 US DEFENSE CONTRACTS FOR TACTICAL OPTICS, 2012–2020
TABLE 69 US: TACTICAL OPTICS MARKET SIZE, BY PLATFORM, 2018–2025 (USD MILLION)
TABLE 70 US: VEHICLE-MOUNTED TACTICAL OPTICS MARKET SIZE, BY VEHICLE TYPE, 2018–2025 (USD MILLION)
TABLE 71 US: NAVAL TACTICAL OPTICS MARKET SIZE, BY VESSEL TYPE, 2018–2025 (USD MILLION)
TABLE 72 US: AIRBORNE TACTICAL OPTICS MARKET SIZE, BY AIRCRAFT TYPE, 2018–2025 (USD MILLION)
TABLE 73 CANADA: TACTICAL OPTICS MARKET SIZE, BY PLATFORM, 2018–2025 (USD MILLION)
TABLE 74 CANADA: VEHICLE-MOUNTED TACTICAL OPTICS MARKET SIZE, BY VEHICLE TYPE, 2018–2025 (USD MILLION)
TABLE 75 CANADA: NAVAL TACTICAL OPTICS MARKET SIZE, BY VESSEL TYPE, 2018–2025 (USD MILLION)
TABLE 76 CANADA: AIRBORNE TACTICAL OPTICS MARKET SIZE, BY AIRCRAFT TYPE, 2018–2025 (USD MILLION)
TABLE 77 EUROPE: TACTICAL OPTICS MARKET SIZE, BY PRODUCT, 2018–2025 (USD MILLION)
TABLE 78 EUROPE: TACTICAL OPTICS MARKET SIZE, BY PLATFORM, 2018–2025 (USD MILLION)
TABLE 79 EUROPE: TACTICAL OPTICS MARKET SIZE, BY END USE, 2018–2025 (USD MILLION)
TABLE 80 EUROPE: TACTICAL OPTICS MARKET SIZE, BY APPLICATION, 2018–2025 (USD MILLION)
TABLE 81 EUROPE: GROUND TACTICAL OPTICS MARKET SIZE, BY RANGE, 2018–2025 (USD MILLION)
TABLE 82 EUROPE: VEHICLE-MOUNTED TACTICAL OPTICS MARKET SIZE, BY VEHICLE TYPE, 2018–2025 (USD MILLION)
TABLE 83 EUROPE: NAVAL TACTICAL OPTICS MARKET SIZE, BY VESSEL TYPE, 2018–2025 (USD MILLION)
TABLE 84 EUROPE: AIRBORNE TACTICAL OPTICS MARKET SIZE, BY AIRCRAFT TYPE, 2018–2025 (USD MILLION)
TABLE 85 EUROPE: TACTICAL OPTICS MARKET SIZE, BY COUNTRY, 2018–2025 (USD MILLION)
TABLE 86 FRANCE: TACTICAL OPTICS MARKET SIZE, BY PLATFORM, 2018–2025 (USD MILLION)
TABLE 87 FRANCE: VEHICLE-MOUNTED TACTICAL OPTICS MARKET SIZE, BY VEHICLE TYPE, 2018–2025 (USD MILLION)
TABLE 88 FRANCE: NAVAL TACTICAL OPTICS MARKET SIZE, BY VESSEL TYPE, 2018–2025 (USD MILLION)
TABLE 89 FRANCE: AIRBORNE TACTICAL OPTICS MARKET SIZE, BY AIRCRAFT TYPE, 2018–2025 (USD MILLION)
TABLE 90 RUSSIA: TACTICAL OPTICS MARKET SIZE, BY PLATFORM, 2018–2025 (USD MILLION)
TABLE 91 RUSSIA: VEHICLE-MOUNTED TACTICAL OPTICS MARKET SIZE, BY VEHICLE TYPE, 2018–2025 (USD MILLION)
TABLE 92 RUSSIA: NAVAL TACTICAL OPTICS MARKET SIZE, BY VESSEL TYPE, 2018–2025 (USD MILLION)
TABLE 93 RUSSIA: AIRBORNE TACTICAL OPTICS MARKET SIZE, BY AIRCRAFT TYPE, 2018–2025 (USD MILLION)
TABLE 94 UK: EQUIPMENT PLAN FUNDING ALLOCATIONS, 2018-2028
TABLE 95 UK: TACTICAL OPTICS MARKET SIZE, BY PLATFORM, 2018–2025 (USD MILLION)
TABLE 96 UK: VEHICLE-MOUNTED TACTICAL OPTICS MARKET SIZE, BY VEHICLE TYPE, 2018–2025 (USD MILLION)
TABLE 97 UK: NAVAL TACTICAL OPTICS MARKET SIZE, BY VESSEL TYPE, 2018–2025 (USD MILLION)
TABLE 98 UK: AIRBORNE TACTICAL OPTICS MARKET SIZE, BY AIRCRAFT TYPE, 2018–2025 (USD MILLION)
TABLE 99 GERMANY: TACTICAL OPTICS MARKET SIZE, BY PLATFORM, 2018–2025 (USD MILLION)
TABLE 100 GERMANY: VEHICLE-MOUNTED TACTICAL OPTICS MARKET SIZE, BY VEHICLE TYPE, 2018–2025 (USD MILLION)
TABLE 101 GERMANY: NAVAL TACTICAL OPTICS MARKET SIZE, BY VESSEL TYPE, 2018–2025 (USD MILLION)
TABLE 102 GERMANY: AIRBORNE TACTICAL OPTICS MARKET SIZE, BY AIRCRAFT TYPE, 2018–2025 (USD MILLION)
TABLE 103 ITALY: TACTICAL OPTICS MARKET SIZE, BY PLATFORM, 2018–2025 (USD MILLION)
TABLE 104 ITALY: VEHICLE-MOUNTED TACTICAL OPTICS MARKET SIZE, BY VEHICLE TYPE, 2018–2025 (USD MILLION)
TABLE 105 ITALY: NAVAL TACTICAL OPTICS MARKET SIZE, BY VESSEL TYPE, 2018–2025 (USD MILLION)
TABLE 106 ITALY: AIRBORNE TACTICAL OPTICS MARKET SIZE, BY AIRCRAFT TYPE, 2018–2025 (USD MILLION)
TABLE 107 SPAIN: TACTICAL OPTICS MARKET SIZE, BY PLATFORM, 2018–2025 (USD MILLION)
TABLE 108 SPAIN: VEHICLE-MOUNTED TACTICAL OPTICS MARKET SIZE, BY VEHICLE TYPE, 2018–2025 (USD MILLION)
TABLE 109 SPAIN: NAVAL TACTICAL OPTICS MARKET SIZE, BY VESSEL TYPE, 2018–2025 (USD MILLION)
TABLE 110 SPAIN: AIRBORNE TACTICAL OPTICS MARKET SIZE, BY AIRCRAFT TYPE, 2018–2025 (USD MILLION)
TABLE 111 POLAND: TACTICAL OPTICS MARKET SIZE, BY PLATFORM, 2018–2025 (USD MILLION)
TABLE 112 POLAND: VEHICLE-MOUNTED TACTICAL OPTICS MARKET SIZE, BY VEHICLE TYPE, 2018–2025 (USD MILLION)
TABLE 113 POLAND: NAVAL TACTICAL OPTICS MARKET SIZE, BY VESSEL TYPE, 2018–2025 (USD MILLION)
TABLE 114 POLAND: AIRBORNE TACTICAL OPTICS MARKET SIZE, BY AIRCRAFT TYPE, 2018–2025 (USD MILLION)
TABLE 115 ASIA PACIFIC: TACTICAL OPTICS MARKET SIZE, BY PRODUCT, 2018–2025 (USD MILLION)
TABLE 116 ASIA PACIFIC: TACTICAL OPTICS MARKET SIZE, BY PLATFORM, 2018–2025 (USD MILLION)
TABLE 117 ASIA PACIFIC: TACTICAL OPTICS MARKET SIZE, BY END USE, 2018–2025 (USD MILLION)
TABLE 118 ASIA PACIFIC: TACTICAL OPTICS MARKET SIZE, BY APPLICATION, 2018–2025 (USD MILLION)
TABLE 119 ASIA PACIFIC: GROUND TACTICAL OPTICS MARKET SIZE, BY RANGE, 2018–2025 (USD MILLION)
TABLE 120 ASIA PACIFIC: VEHICLE-MOUNTED TACTICAL OPTICS MARKET SIZE, BY VEHICLE TYPE, 2018–2025 (USD MILLION)
TABLE 121 ASIA PACIFIC: NAVAL TACTICAL OPTICS MARKET SIZE, BY VESSEL TYPE, 2018–2025 (USD MILLION)
TABLE 122 ASIA PACIFIC: AIRBORNE TACTICAL OPTICS MARKET SIZE, BY AIRCRAFT TYPE, 2018–2025 (USD MILLION)
TABLE 123 ASIA PACIFIC: TACTICAL OPTICS MARKET SIZE, BY COUNTRY, 2018–2025 (USD MILLION)
TABLE 124 CHINA: TACTICAL OPTICS MARKET SIZE, BY PLATFORM, 2018–2025 (USD MILLION)
TABLE 125 CHINA: VEHICLE-MOUNTED TACTICAL OPTICS MARKET SIZE, BY VEHICLE TYPE, 2018–2025 (USD MILLION)
TABLE 126 CHINA: NAVAL TACTICAL OPTICS MARKET SIZE, BY VESSEL TYPE, 2018–2025 (USD MILLION)
TABLE 127 CHINA: AIRBORNE TACTICAL OPTICS MARKET SIZE, BY AIRCRAFT TYPE, 2018–2025 (USD MILLION)
TABLE 128 INDIA: TACTICAL OPTICS MARKET SIZE, BY PLATFORM, 2018–2025 (USD MILLION)
TABLE 129 INDIA: VEHICLE-MOUNTED TACTICAL OPTICS MARKET SIZE, BY VEHICLE TYPE, 2018–2025 (USD MILLION)
TABLE 130 INDIA: NAVAL TACTICAL OPTICS MARKET SIZE, BY VESSEL TYPE, 2018–2025 (USD MILLION)
TABLE 131 INDIA: AIRBORNE TACTICAL OPTICS MARKET SIZE, BY AIRCRAFT TYPE, 2018–2025 (USD MILLION)
TABLE 132 JAPAN: TACTICAL OPTICS MARKET SIZE, BY PLATFORM, 2018–2025 (USD MILLION)
TABLE 133 JAPAN: VEHICLE-MOUNTED TACTICAL OPTICS MARKET SIZE, BY VEHICLE TYPE, 2018–2025 (USD MILLION)
TABLE 134 JAPAN: NAVAL TACTICAL OPTICS MARKET SIZE, BY VESSEL TYPE, 2018–2025 (USD MILLION)
TABLE 135 JAPAN: AIRBORNE TACTICAL OPTICS MARKET SIZE, BY AIRCRAFT TYPE, 2018–2025 (USD MILLION)
TABLE 136 SOUTH KOREA: TACTICAL OPTICS MARKET SIZE, BY PLATFORM, 2018–2025 (USD MILLION)
TABLE 137 SOUTH KOREA: VEHICLE-MOUNTED TACTICAL OPTICS MARKET SIZE, BY VEHICLE TYPE, 2018–2025 (USD MILLION)
TABLE 138 SOUTH KOREA: NAVAL TACTICAL OPTICS MARKET SIZE, BY VESSEL TYPE, 2018–2025 (USD MILLION)
TABLE 139 SOUTH KOREA: AIRBORNE TACTICAL OPTICS MARKET SIZE, BY AIRCRAFT TYPE, 2018–2025 (USD MILLION)
TABLE 140 AUSTRALIA: TACTICAL OPTICS MARKET SIZE, BY PLATFORM, 2018–2025 (USD MILLION)
TABLE 141 AUSTRALIA: VEHICLE-MOUNTED TACTICAL OPTICS MARKET SIZE, BY VEHICLE TYPE, 2018–2025 (USD MILLION)
TABLE 142 AUSTRALIA: NAVAL TACTICAL OPTICS MARKET SIZE, BY VESSEL TYPE, 2018–2025 (USD MILLION)
TABLE 143 AUSTRALIA: AIRBORNE TACTICAL OPTICS MARKET SIZE, BY AIRCRAFT TYPE, 2018–2025 (USD MILLION)
TABLE 144 MIDDLE EAST: TACTICAL OPTICS MARKET SIZE, BY PLATFORM, 2018–2025 (USD MILLION)
TABLE 145 MIDDLE EAST: TACTICAL OPTICS MARKET SIZE, BY END USE, 2018–2025 (USD MILLION)
TABLE 146 MIDDLE EAST: TACTICAL OPTICS MARKET SIZE, BY APPLICATION, 2018–2025 (USD MILLION)
TABLE 147 MIDDLE EAST: GROUND TACTICAL OPTICS MARKET SIZE, BY RANGE, 2018–2025 (USD MILLION)
TABLE 148 MIDDLE EAST: VEHICLE-MOUNTED TACTICAL OPTICS MARKET SIZE, BY VEHICLE TYPE, 2018–2025 (USD MILLION)
TABLE 149 MIDDLE EAST: NAVAL TACTICAL OPTICS MARKET SIZE, BY VESSEL TYPE, 2018–2025 (USD MILLION)
TABLE 150 MIDDLE EAST: AIRBORNE TACTICAL OPTICS MARKET SIZE, BY AIRCRAFT TYPE, 2018–2025 (USD MILLION)
TABLE 151 MIDDLE EAST: TACTICAL OPTICS MARKET SIZE, BY COUNTRY, 2018–2025 (USD MILLION)
TABLE 152 SAUDI ARABIA: TACTICAL OPTICS MARKET SIZE, BY PLATFORM, 2018–2025 (USD MILLION)
TABLE 153 SAUDI ARABIA: VEHICLE-MOUNTED TACTICAL OPTICS MARKET SIZE, BY VEHICLE TYPE, 2018–2025 (USD MILLION)
TABLE 154 SAUDI ARABIA: NAVAL TACTICAL OPTICS MARKET SIZE, BY VESSEL TYPE, 2018–2025 (USD MILLION)
TABLE 155 SAUDI ARABIA: AIRBORNE TACTICAL OPTICS MARKET SIZE, BY AIRCRAFT TYPE, 2018–2025 (USD MILLION)
TABLE 156 TURKEY: TACTICAL OPTICS MARKET SIZE, BY PLATFORM, 2018–2025 (USD MILLION)
TABLE 157 TURKEY: VEHICLE-MOUNTED TACTICAL OPTICS MARKET SIZE, BY VEHICLE TYPE, 2018–2025 (USD MILLION)
TABLE 158 TURKEY: NAVAL TACTICAL OPTICS MARKET SIZE, BY VESSEL TYPE, 2018–2025 (USD MILLION)
TABLE 159 TURKEY: AIRBORNE TACTICAL OPTICS MARKET SIZE, BY AIRCRAFT TYPE, 2018–2025 (USD MILLION)
TABLE 160 ISRAEL: TACTICAL OPTICS MARKET SIZE, BY PLATFORM, 2018–2025 (USD MILLION)
TABLE 161 ISRAEL: VEHICLE-MOUNTED TACTICAL OPTICS MARKET SIZE, BY VEHICLE TYPE, 2018–2025 (USD MILLION)
TABLE 162 ISRAEL: NAVAL TACTICAL OPTICS MARKET SIZE, BY VESSEL TYPE, 2018–2025 (USD MILLION)
TABLE 163 ISRAEL: AIRBORNE TACTICAL OPTICS MARKET SIZE, BY AIRCRAFT TYPE, 2018–2025 (USD MILLION)
TABLE 164 SOUTH AMERICA: TACTICAL OPTICS MARKET SIZE, BY PRODUCT, 2018–2025 (USD MILLION)
TABLE 165 SOUTH AMERICA: TACTICAL OPTICS MARKET SIZE, BY PLATFORM, 2018–2025 (USD MILLION)
TABLE 166 SOUTH AMERICA: TACTICAL OPTICS MARKET SIZE, BY END USE, 2018–2025 (USD MILLION)
TABLE 167 SOUTH AMERICA: TACTICAL OPTICS MARKET SIZE, BY APPLICATION, 2018–2025 (USD MILLION)
TABLE 168 SOUTH AMERICA: GROUND TACTICAL OPTICS MARKET SIZE, BY RANGE, 2018–2025 (USD MILLION)
TABLE 169 SOUTH AMERICA: VEHICLE-MOUNTED TACTICAL OPTICS MARKET SIZE, BY VEHICLE TYPE, 2018–2025 (USD MILLION)
TABLE 170 SOUTH AMERICA: NAVAL TACTICAL OPTICS MARKET SIZE, BY VESSEL TYPE, 2018–2025 (USD MILLION)
TABLE 171 SOUTH AMERICA: AIRBORNE TACTICAL OPTICS MARKET SIZE, BY AIRCRAFT TYPE, 2018–2025 (USD MILLION)
TABLE 172 SOUTH AMERICA: TACTICAL OPTICS MARKET SIZE, BY COUNTRY, 2018–2025 (USD MILLION)
TABLE 173 BRAZIL: TACTICAL OPTICS MARKET SIZE, BY PLATFORM, 2018–2025 (USD MILLION)
TABLE 174 BRAZIL: VEHICLE-MOUNTED TACTICAL OPTICS MARKET SIZE, BY VEHICLE TYPE, 2018–2025 (USD MILLION)
TABLE 175 BRAZIL: NAVAL TACTICAL OPTICS MARKET SIZE, BY VESSEL TYPE, 2018–2025 (USD MILLION)
TABLE 176 BRAZIL: AIRBORNE TACTICAL OPTICS MARKET SIZE, BY AIRCRAFT TYPE, 2018–2025 (USD MILLION)
TABLE 177 MEXICO: TACTICAL OPTICS MARKET SIZE, BY PLATFORM, 2018–2025 (USD MILLION)
TABLE 178 MEXICO: VEHICLE-MOUNTED TACTICAL OPTICS MARKET SIZE, BY VEHICLE TYPE, 2018–2025 (USD MILLION)
TABLE 179 MEXICO: NAVAL TACTICAL OPTICS MARKET SIZE, BY VESSEL TYPE, 2018–2025 (USD MILLION)
TABLE 180 MEXICO: AIRBORNE TACTICAL OPTICS MARKET SIZE, BY AIRCRAFT TYPE, 2018–2025 (USD MILLION)
TABLE 181 CONTRACTS, JANUARY 2016– FEBRUARY 2020
TABLE 182 NEW PRODUCT DEVELOPMENTS, JANUARY 2016– FEBRUARY 2020
TABLE 183 ACQUISITIONS JANUARY 2016–FEBRUARY 2020
TABLE 184 CONTRACTS, JULY 2016–MARCH 2020
TABLE 185 NEW PRODUCT LAUNCHES, JULY 2016–MARCH 2020
TABLE 186 ACQUISITIONS AND PARTNERSHIPS, JULY 2016–MARCH 2020
LIST OF FIGURES (77 FIGURES)
FIGURE 1 REPORT PROCESS FLOW
FIGURE 2 TACTICAL OPTICS MARKET: RESEARCH DESIGN
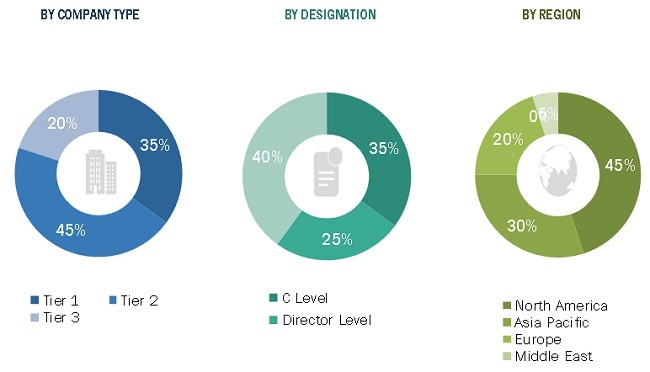
FIGURE 3 BREAKDOWN OF PRIMARY INTERVIEWS: BY COMPANY TYPE, DESIGNATION, AND REGION
FIGURE 4 MARKET SIZE ESTIMATION METHODOLOGY: BOTTOM-UP APPROACH
FIGURE 5 MARKET SIZE ESTIMATION METHODOLOGY: TOP-DOWN APPROACH
FIGURE 6 DATA TRIANGULATION
FIGURE 7 BY PRODUCT, CAMERAS & DISPLAYS SEGMENT TO DOMINATE TACTICAL OPTICS MARKET FROM 2020 TO 2025
FIGURE 8 BY APPLICATION, TARGET IDENTIFICATION & ACQUISITION SEGMENT TO LEAD TACTICAL OPTICS MARKET FROM 2020 TO 2025
FIGURE 9 BY END USE, UNMANNED PLATFORM SEGMENT TO REGISTER HIGHEST CAGR FROM 2020 TO 2025
FIGURE 10 BY PLATFORM, GROUND SEGMENT TO ACCOUNT FOR LARGEST MARKET SHARE FROM 2020 TO 2025
FIGURE 11 BY RANGE, LONG-RANGE (> 25 KM) SEGMENT TO LEAD TACTICAL OPTICS MARKET FROM 2020 TO 2025
FIGURE 12 TACTICAL OPTICS MARKET IN ASIA PACIFIC TO ACCOUNT FOR THE LARGEST SHARE OF THE MARKET FROM 2020 TO 2025
FIGURE 13 INCREASING ORDERS FOR COMBAT AIRCRAFT, ARMORED VEHICLES, AND NAVAL SHIPS DRIVING THE MARKET FOR TACTICAL OPTICS
FIGURE 14 UNMANNED GROUND VEHICLES SEGMENT TO REGISTER HIGHEST CAGR DURING FORECAST PERIOD
FIGURE 15 CORVETTES SEGMENT TO REGISTER HIGHEST CAGR DURING FORECAST PERIOD
FIGURE 16 UNMANNED AERIAL VEHICLES SEGMENT TO REGISTER HIGHEST CAGR DURING FORECAST PERIOD
FIGURE 17 ELECTRO-OPTIC/INFRARED SIGHTS SEGMENT TO REGISTER HIGHEST CAGR DURING FORECAST PERIOD
FIGURE 18 TARGET ACQUIS ION & SURVEILLANCE SYSTEMS SEGMENT TO LEAD TACTICAL OPTICS MARKET DURING FORECAST PERIOD
FIGURE 19 ELECTRO-OPTIC/INFRARED CAMERAS SEGMENT TO LEAD TACTICAL OPTICS MARKET DURING FORECAST PERIOD
FIGURE 20 TACTICAL OPTICS MARKET IN NORTH AMERICA PROJECTED TO WITNESS HIGHEST CAGR DURING FORECAST PERIOD
FIGURE 21 EVOLUTION OF THE RIFLESCOPE
FIGURE 22 TACTICAL OPTICS MARKET DYNAMICS: DRIVERS, OPPORTUNITIES, AND CHALLENGES
FIGURE 23 TOP 15 MILITARY SPENDING COUNTRIES, 2019 (USD BILLION)
FIGURE 24 MAJOR INDUSTRY TRENDS
FIGURE 25 CAMERAS & DISPLAYS SEGMENT TO REGISTER HIGHEST CAGR DURING FORECAST PERIOD
FIGURE 26 AIRBORNE SEGMENT TO REGISTER HIGHEST CAGR DURING FORECAST PERIOD
FIGURE 27 INTELLIGENCE, SURVEILLANCE, & RECONNAISSANCE SEGMENT TO REGISTER HIGHEST CAGR DURING FORECAST PERIOD
FIGURE 28 UNMANNED PLATFORM SEGMENT TO REGISTER HIGHEST CAGR DURING FORECAST PERIOD
FIGURE 29 LONG-RANGE (> 25 KM) SEGMENT TO REGISTER HIGHEST CAGR DURING FORECAST PERIOD
FIGURE 30 ASIA PACIFIC ESTIMATED TO ACCOUNT FOR LARGEST SHARE OF TACTICAL OPTICS MARKET IN 2020
FIGURE 31 NORTH AMERICA TACTICAL OPTICS MARKET SNAPSHOT
FIGURE 32 US DEFENSE BUDGET, 2010–2019
FIGURE 33 US MODERNIZATION BUDGET BREAKDOWN, 2019 (USD BILLION)
FIGURE 34 CANADA DEFENSE BUDGET, 2010–2019
FIGURE 35 EUROPE TACTICAL OPTICS MARKET SNAPSHOT
FIGURE 36 FRANCE DEFENSE BUDGET, 2010–2019
FIGURE 37 RUSSIA DEFENSE BUDGET, 2010–2019
FIGURE 38 UK DEFENSE BUDGET, 2010–2019
FIGURE 39 GERMANY DEFENSE BUDGET, 2010–2019
FIGURE 40 ITALY DEFENSE BUDGET, 2010–2019
FIGURE 41 SPAIN DEFENSE BUDGET 2010-2018
FIGURE 42 POLAND DEFENSE BUDGET, 2010–2019
FIGURE 43 ASIA PACIFIC TACTICAL OPTICS MARKET SNAPSHOT
FIGURE 44 CHINA DEFENSE BUDGET 2010-2018
FIGURE 45 INDIA DEFENSE BUDGET, 2010–2019
FIGURE 46 JAPAN DEFENSE BUDGET, 2010–2019
FIGURE 47 SOUTH KOREA DEFENSE BUDGET, 2010–2019
FIGURE 48 AUSTRALIA DEFENSE BUDGET, 2010–2019
FIGURE 49 MIDDLE EAST TACTICAL OPTICS MARKET SNAPSHOT
FIGURE 50 SAUDI ARABIA DEFENSE BUDGET, 2010–2019
FIGURE 51 TURKEY DEFENSE BUDGET, 2010–2019
FIGURE 52 ISRAEL DEFENSE BUDGET, 2010–2019
FIGURE 53 BRAZIL DEFENSE BUDGET, 2010–2019
FIGURE 54 MEXICO DEFENSE BUDGET, 2010–2019
FIGURE 55 RANK ANALYSIS OF KEY PLAYERS IN THE TACTICAL OPTICS MARKET, 2019
FIGURE 56 TACTICAL OPTICS (TIER 1 COMPANIES) COMPETITIVE LEADERSHIP MAPPING, 2019
FIGURE 57 PRODUCT PORTFOLIO ANALYSIS OF TOP PLAYERS IN TACTICAL OPTICS MARKET (TIER 1 COMPANIES)
FIGURE 58 BUSINESS STRATEGY EXCELLENCE OF TOP PLAYERS IN TACTICAL OPTICS MARKET (TIER 1 COMPANIES)
FIGURE 59 RANK ANALYSIS OF KEY PLAYERS IN THE TACTICAL OPTICS MARKET, 2019
FIGURE 60 TACTICAL OPTICS (TIER 2 & 3 COMPANIES) COMPETITIVE LEADERSHIP MAPPING, 2019
FIGURE 61 PRODUCT PORTFOLIO ANALYSIS OF TOP PLAYERS IN TACTICAL OPTICS MARKET (TIER 2 & 3 COMPANIES)
FIGURE 62 BUSINESS STRATEGY EXCELLENCE OF TOP PLAYERS IN TACTICAL OPTICS MARKET (TIER 2 & 3 COMPANIES)
FIGURE 63 LEONARDO S.P.A.: COMPANY SNAPSHOT
FIGURE 64 BAE SYSTEMS, PLC.: COMPANY SNAPSHOT
FIGURE 65 BAE SYSTEMS, PLC: BUSINESS STRATEGY AND RIGHT TO WIN FACTOR
FIGURE 66 ELBIT SYSTEMS LTD.: COMPANY SNAPSHOT
FIGURE 67 ELBIT SYSTEMS LTD.: BUSINESS STRATEGY AND RIGHT TO WIN FACTOR
FIGURE 68 KONGSBERG GRUPPEN AS: COMPANY SNAPSHOT
FIGURE 69 KONGSBERG GRUPPEN AS: BUSINESS STRATEGY AND RIGHT TO WIN FACTOR
FIGURE 70 L3HARRIS TECHNOLOGIES: COMPANY SNAPSHOT
FIGURE 71 LOCKHEED MARTIN CORPORATION: COMPANY SNAPSHOT
FIGURE 72 NORTHROP GRUMMAN CORPORATION: COMPANY SNAPSHOT
FIGURE 73 RAYTHEON COMPANY: COMPANY SNAPSHOT
FIGURE 74 THALES GROUP: COMPANY SNAPSHOT
FIGURE 75 SAAB AB: COMPANY SNAPSHOT
FIGURE 76 FLIR SYSTEMS, INC.: COMPANY SNAPSHOT
FIGURE 77 ISRAEL AEROSPACE INDUSTRIES: COMPANY SNAPSHOT
Extensive secondary research was undertaken to collect information on the tactical optics market, its adjacent markets, and its parent market. The next step was to validate these findings, assumptions, and sizing with industry experts across the value chain through primary research. Both the demand- and supply-side analyses were employed to estimate the overall size of the market. Thereafter, the market breakdown and data triangulation procedures were used to estimate the market sizes of different segments and subsegments.
Secondary Research
In the secondary research process, various sources, such as Statista, World Bank, Global Firepower, Defense IQ, Factiva, Bloomberg, BusinessWeek, SEC filings, annual reports, press releases & investor presentations of companies, certified publications, and articles by recognized authors, were referred for identifying and collecting information on the tactical optics market.
Primary Research
The tactical optics market comprises several stakeholders, such as raw material suppliers, processors, end-product manufacturers, and integratory and regulatory organizations in its supply chain. The military forces of different countries characterize the demand side of this market. Technologically advanced hardware manufacturers characterize the supply side for tactical optics catering to the ground, naval, and airborne platforms.
Following is the breakdown of the primary respondents that were interviewed to obtain qualitative and quantitative information about the tactical optics market.
To know about the assumptions considered for the study, download the pdf brochure
Market Size Estimation
Both the top-down and bottom-up approaches were used to estimate and validate the total size of the tactical optics market. These methods were also used extensively to estimate the size of various segments and subsegments of the market. The research methodology used to estimate the market size included the following.
- Key players in the industry and market were identified through extensive secondary research of their product matrix, their geographical presence, and developments undertaken by them.
- All percentage shares, splits, and breakdowns were determined using secondary sources and verified through primary sources.
Data Triangulation
After arriving at the overall size of the tactical optics market using the market size estimation processes explained above, the market was split into several segments and subsegments. To complete the overall market engineering process and arrive at the exact statistics of each market segment and subsegment, the data triangulation and market breakdown procedures were employed, wherever applicable. The data was triangulated by studying various factors and trends from the demand as well as the supply sides of the tactical optics market.
Report Objectives
- To define, describe, and forecast the size of the tactical optics market based on product, platform, application, end use, range, and region
- To identify and analyze key drivers, restraints, opportunities, and challenges influencing the growth of the market
- To identify industry trends, market trends, and technology trends currently prevailing in the market
- To analyze micromarkets with respect to individual technological trends, prospects, and their contribution to the overall market
- To forecast the size of segments of the tactical optics market based on five regions, namely, North America, Europe, Asia Pacific, Middle East, and South America, along with major countries in each region
- To provide a detailed competitive landscape of the market and analyze competitive growth strategies, such as contracts, new product launches, acquisitions, partnerships, and collaborations, adopted by key players in the market
- To identify detailed financial positions, key products, unique selling points, and key developments of leading companies in the market
- To strategically profile key players and comprehensively analyze their market ranking and core competencies
Available Customizations
With the given market data, MarketsandMarkets offers customizations according to the specific requirements of companies.
Product Analysis
- Product matrix, which provides a detailed comparison of the product portfolio of each company
Company Information
- Detailed analysis and profiles of additional market players (up to 5)


Growth opportunities and latent adjacency in Tactical Optics Market