Tartaric Acid Market by Source (Grapes & Sun-dried Raisins, Maleic Anhydride), Type (Natural, Synthetic), Application (Food & Beverages, Pharmaceuticals, Cosmetics & Personal Care Products), and Region - Global Forecast to 2022


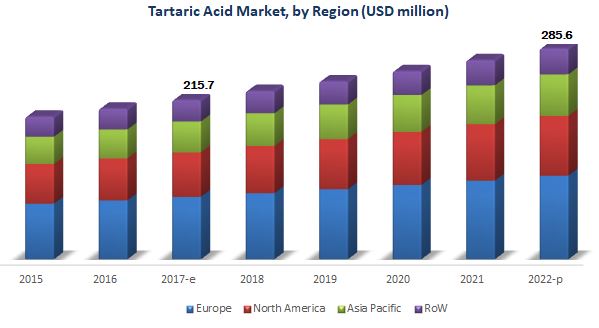
[119 Pages Report] The tartaric acid market was valued at USD 204.0 million in 2016; it is projected to grow at a CAGR of 5.7%, to reach USD 285.6 million by 2022. The basic objective of the report is to define, segment, and project the global market size for tartaric acid on the basis of application, source, type, and region. Other objectives include analyzing the opportunities in the market for stakeholders, providing a competitive landscape of market trends, analyzing the macro and microeconomic indicators of this market to provide factor analysis and to project the growth rate of the global market.
The years considered for the study are as follows:
|
Report Metric |
Details |
|
Base year considered |
2016 |
|
Estimated Year |
2017 |
|
Projected Year |
2022 |
|
Forecast Period |
2017 - 2022 |
For more details on this research, Request Free Sample Report
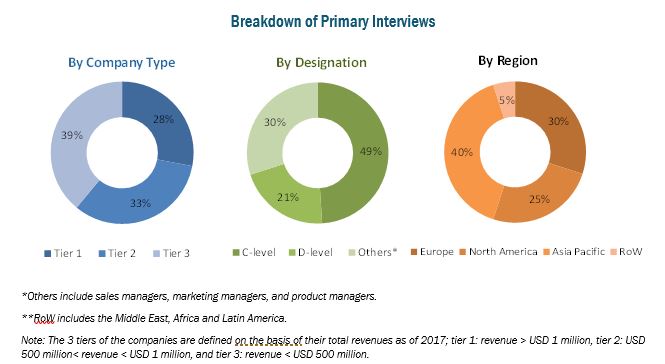
This report includes estimations of the market size in terms of value (USD million). Both the top-down and bottom-up approaches have been used to estimate and validate the size of the global tartaric acid market and to estimate the size of various other dependent submarkets. The key players in the market have been identified through secondary research. Sources include press releases; paid databases such as Factiva and Bloomberg; annual reports; and financial journals. Their market shares in respective regions have also been determined through primary and secondary research. All percentage shares, splits, and breakdowns have been determined using secondary sources and were verified through primary sources. The figure below shows the breakdown of the profiles of the industry experts that participated in the primary discussions.
The key players that are profiled in the report include Caviro Group (Italy), ATP Group (US), Merck (Germany), Omkar Specialty Chemicals (India), Changmao Biochemical Engineering (China), Tarac Technologies (Australia), PAHI (Spain), Distillerie Mazzari (Italy), Distillerie Bonollo (Italy), Derivados Vinicos (Argentina), Industrias Vinicas (US), and Tártaros Gonzalo Castelló (Spain).
This report is targeted at the existing players in the industry, which include the following:
- Food & beverage regulatory organizations
- Tartaric acid manufacturers, suppliers, distributors, and retailers
- Food & beverage product manufacturers, suppliers, distributors, and retailers
“The study answers several questions for stakeholders; primarily, which market segments to focus on in the next 2 to 5 years for prioritizing efforts and investments.”
To know about the assumptions considered for the study, download the pdf brochure
Scope of the tartaric acid market Report:
On the basis of source, the market has been segmented as follows:
- Grapes & sun-dried raisins
- Maleic anhydride
- Others, including apricots, tamarind, bananas, and apples
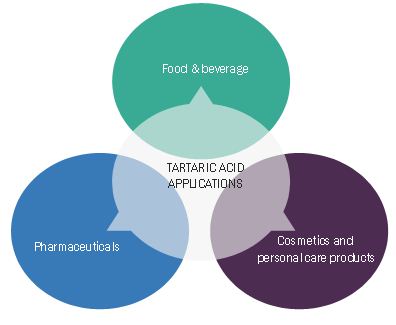
On the basis of application, the tartaric acid market has been segmented as follows:
- Food & beverages
- Pharmaceuticals
- Cosmetics & personal care products
- Others, including industrial use and animal feed
On the basis of type, the market has been segmented as follows:
- Naturals
- Synthetic
On the basis of region, the market has been segmented as follows:
- North America
- Europe
- Asia Pacific
- RoW (South America, the Middle East, and South Africa)
Available Customizations
With the given market data, MarketsandMarkets offers customizations according to company-specific scientific needs. The following customization options are available for the report:
Segmental Analysis
- Further breakdown of tartaric acid, on the basis of application, into bakery & confectionery items, beverages, and wine
Geographic Analysis
- Further breakdown of the Rest of Asia Pacific tartaric acid market, by key country
- Further breakdown of other countries in the Rest of the World tartaric acid market, by key country
Company Information
- Detailed analysis and profiling of additional market players (up to 5)
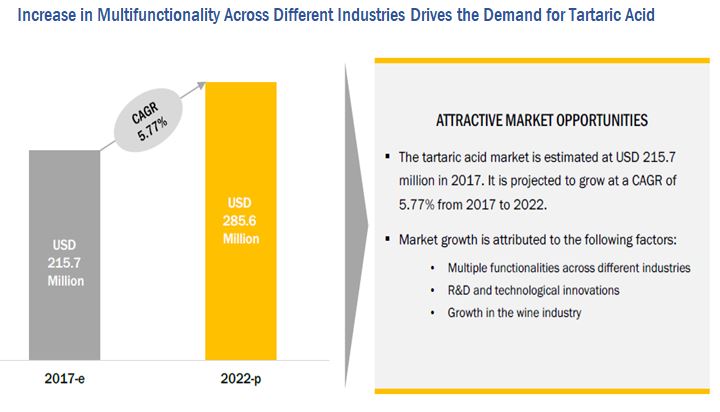
Multiple functionalities of tartaric acid across different industries is acting as a catalyst to stimulate the demand to cross the mark of USD 285.6 million by 2022
Tartaric acid is an odourless white crystalline powder, and can be extracted from fruits such as grapes, bananas, apricots, and tamarind. The major applications of tartaric acid include wine, fruit juices, baked food, pharmaceutical, which has garnered significant attention in the last few years. Tartaric acid is largely used in the wine industry to maintain the pH level in wines; and in bakery industry as a raw material for the manufacturing of food emulsifiers used for bread improvement. Tartaric acid also finds application as a food preservatives and flavor enhancer in the food & beverage industry.
The global tartaric acid market is projected to reach USD 285.6 million by 2022, at a CAGR of 5.77%; in terms of volume, it is projected to reach 91.2 KT by 2022, at a CAGR of 4.50% during the forecast period. The major driver of the tartaric acid industry is its multifunctionality across different industries such as food & beverages, pharmaceutical, and cosmetics. Tartaric acid, as an ingredient, has immense usage in the pharmaceutical industry, especially after technological innovations such as micro-encapsulation.
Restricted use of synthetic tartaric acid by government in various countries, act as the major restraining factor for the market
Governments in various countries have framed regulations related to the use of synthetic tartaric acid in food-grade and pharmaceutical applications to eliminate its side effects. The excessive use of tartaric acid in food-grade applications is harmful; hence, the government restricts the use of synthetic tartaric acid to eliminate side effects such as vomiting, diarrhea, abdominal pain, increased thirst, and gastrointestinal inflammation. The increase in government regulations in various countries may restrict the market growth of tartaric acid.
Key challenges faced by the tartaric acid industry is the availability and rising prices of raw material such as fruits; this eventually leads to high production costs, particularly for producing natural tartaric acid. According to the United States Department of Agriculture (USDA), EU’s total grape production in 2016–17 is projected to fall by 3.5%, which will have a direct impact on the tartaric acid industry. The same applies to all the other sources of tartaric acid.
To grow in this industry, leading companies adopted strategies such as rebranding, expansions, and acquisitions. Acquisitions was the key strategy adopted by players in the tartaric acid market to expand their geographical reach.
Market Dynamics
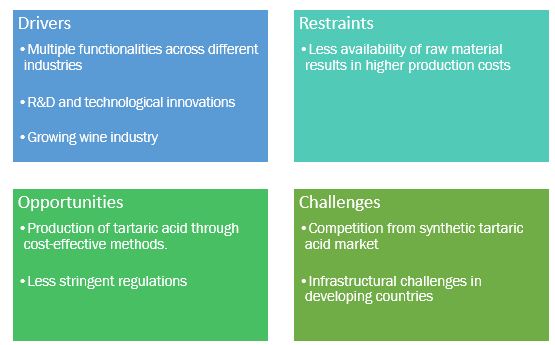
Key players in the tartaric acid industry are investing in research and development of new cost effective method of extraction
Food & beverage: Consumption of tartaric acid in food & beverages is expected to grow, alongside increasing the demand for bakery products and RTD beverages
Tartaric acid is an essential additive in bakery items where it functions as a leavening agent when mixed with baking powder. It also enhances fruit flavours and stabilizes batter systems and colour in baked foods. During winemaking, tartaric acid extracts act as buffers to regulate antioxidants, acidity, and as preservatives; in other food items, it acts as natural flavor enhancers, and food emulsifiers.
Now-a-days, there is a trend among consumers toward opting for natural ingredients in food & beverage products, which leads to growth in the demand of naturally extracted tartaric acid.
Moreover, the demand for tartaric acid is supported by the growing consumption of sports and protein drinks and nutritional bars, as well as the introduction of fruit-flavored beverages, where it is used as an acidulant to give a sour taste and to stabilize the color properties of the respective beverage.
Pharmaceuticals: Act as pharmacologically inactive substance in pharmaceuticals
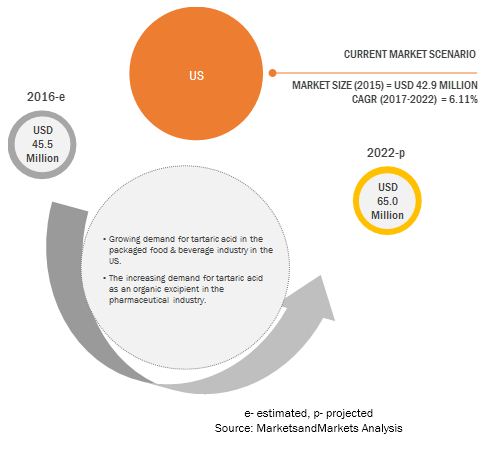
It is used in several medical applications, including the manufacture of solutions that are used to determine glucose levels. For the purpose of providing coatings in the manufacturing of capsules and pellets, tartaric acids are used as cores. It aids in providing better accuracy and consistency to drug layering and coating. The North American region is projected to grow at the highest CAGR during the forecast period. This is due to the growth of the pharmaceutical industry in North America; and the application of tartaric acid in the US, mainly to manufacture the outer core of the drugs in the form of capsules.
Cosmetics and personal care products: Tartaric acid is used as a base compound in many of the body creams & soaps
In cosmetics and personal care products such as soaps, skin care products, suntan creams, and hair care products, tartaric acid and its salts are used as pH adjusters. Tartaric acid acts as a skin coolant and also as an effective cleansing agent. Strict regulations on the usage of synthetic tartaric acid in cosmetics and food & beverages, along with its declining production (mainly in North America and Europe), pose a challenge in the growth of the tartaric acid market.
Key questions
- What are the upcoming extraction technologies that are cost-effective and will have a significant impact on the market in the future?
- Natural tartaric is getting traction in the market; how will this impact the bakery industry in the next five years?
- What will be the prominent revenue-generating pockets for the market in the next five years?
- Most of the suppliers have chosen expansions and acquisitions as their key strategies, as could be seen from the recent developments. Where will it take the industry in the mid to long term?
The tartaric acid market market is primarily driven by the growth in the overall beverages market. Factors such as the growth of the wine industry, mainly in the Asia Pacific and South American countries; and the continual growth of the food industry, especially, the bakery industry in developed countries, contribute toward the growth of this market.
On the basis of source, the grapes & sun-dried raisins segment accounted for the largest share in 2016. Most tartaric acid is sourced naturally from grapes & sun-dried raisins; most of which is obtained as a by-product of the wine-making process in the form of crystals. This extract has extensive application in the food industry.
The tartaric acid market, on the basis of application, is segmented into the food & beverages, pharmaceuticals, cosmetics, and personal care, and others segments. In 2016, the food & beverages segment accounted for the largest share in terms of both value and volume, as tartaric acid is majorly used as preservatives and emulsifiers. The growing demand for packaged food in economies around the world is expected to boost market growth during the forecast period.
For more details on this research, Request Free Sample Report
On the basis of type, the natural tartaric acid segment accounted for the largest share in 2016. This can be attributed to the growth in demand for the food & beverage and pharmaceutical industries where natural tartaric acid is used; especially in the European region, where only food grade tartaric acid (natural) is permitted to be used in these industries.
Europe accounted for the largest share of the tartaric acid market in 2016, followed by North America. The major drivers are the significant increase in the production of wine and the increasing use of natural tartaric acid in food. Another major factor is the rising exports from the European and North American countries, owing to the demand from countries such as India, Japan, Brazil, and Argentina. Additionally, the Middle Eastern countries are expected to drive the demand for tartaric acid in this region in the coming years.
The major restraining factor for the tartaric acid market is the stringent food safety regulations. The increase in government regulations in various countries is restricting the use of synthetic tartaric acid in food grade and pharmaceutical grade applications. This may restrict the market growth of tartaric acid. Governments in various countries have framed regulations related to the use of synthetic tartaric acid in food grade and pharmaceutical applications to avoid its side effects.
Frequently Asked Questions (FAQ):
What is the leading application in the tartaric acid market?
The food & beverages segment was the highest revenue contributor to the market, with USD 93.7 million in 2016, and is estimated to reach USD 134.4 million by 2022, with a CAGR of 6.2%. The pharmaceuticals segment is estimated to reach USD 70.8 million by 2022, at a significant CAGR of 6.0% during the forecast period.
What is the estimated industry size of tartaric acid?
The global tartaric acid market was valued at USD 204.0 million in 2016, and is projected to reach USD 285.6 million by 2022, registering a CAGR of 5.8% from 2017 to 2022.
What is the leading type of tartaric acid market?
The global tartaric acid market registered a CAGR of 5.8% from 2017 to 2022. The natural segment was the highest revenue contributor to the market, with USD 119.9 million in 2016, and is estimated to reach USD 169.3 million by 2022, with a CAGR of 5.9%. .
To speak to our analyst for a discussion on the above findings, click Speak to Analyst
 Exclusive indicates content/data unique to MarketsandMarkets and not available with any competitors.
Table of Contents
1 Introduction (Page No. - 12)
1.1 Objectives of the Study
1.2 Market Definition
1.3 Study Scope
1.4 Periodization Considered for the Study
1.5 Currency
1.6 Unit Considered for the Study
1.7 Stakeholders
2 Research Methodology (Page No. - 16)
2.1 Research Data
2.1.1 Secondary Data
2.1.1.1 Key Data From Secondary Sources
2.1.2 Primary Data
2.1.2.1 Key Data From Primary Sources
2.1.2.2 Key Industry Insights
2.1.2.3 Breakdown of Primary Interviews
2.2 Market Size Estimation
2.3 Data Triangulation
2.4 Research Assumptions & Limitations
2.4.1 Research Assumptions
2.4.2 Limitations
3 Executive Summary (Page No. - 24)
4 Premium Insights (Page No. - 28)
4.1 Attractive Market Opportunities in this Market
4.2 European Market For Tartaric Acid, By Source & Country
4.3 Market For Tartaric Acid, By Source & Region
4.4 Market For Tartaric Acid, By Application & Region
4.5 Market For Tartaric Acid, By Country/Region
5 Market Overview (Page No. - 31)
5.1 Introduction
5.2 Market Dynamics
5.2.1 Drivers
5.2.1.1 Multiple Functionalities Across Different Industries
5.2.1.2 R&D and Technological Innovations
5.2.1.3 Growth in the Wine Industry
5.2.2 Restraints
5.2.2.1 Restricted Use of Synthetic Tartaric Acid in Various Applications
5.2.3 Opportunities
5.2.3.1 Production of Tartaric Acid Through Cost-Effective Methods
5.2.3.2 Less Stringent Regulations
5.2.4 Challenges
5.2.4.1 Infrastructural Challenges in Developing Countries
5.2.4.2 Less Availability of Raw Materials Results in Higher Production Costs
5.3 Supply Chain Analysis
5.4 Regulatory Framework
5.4.1 North America
5.4.1.1 US
5.4.2 Europe
5.5 Tartaric Acid Market, By Function
5.5.1 Flavor Enhancing
5.5.2 Emulsifying
5.5.3 Anticaking
5.5.4 Preservative
6 Tartaric Acid Market, By Source (Page No. - 38)
6.1 Introduction
6.2 Grapes & Sun-Dried Raisins
6.3 Maleic Anhydride
6.4 Others
7 Tartaric Acid Market, By Type (Page No. - 44)
7.1 Introduction
7.2 Natural
7.3 Synthetic
8 Tartaric Acid Market, By Application (Page No. - 49)
8.1 Introduction
8.2 Food & Beverages
8.3 Pharmaceuticals
8.4 Cosmetics & Personal Care Products
8.5 Others
9 Tartaric Acid Market, By Region (Page No. - 57)
9.1 Introduction
9.2 North America
9.2.1 US
9.2.2 Canada
9.2.3 Mexico
9.3 Europe
9.3.1 Italy
9.3.2 Spain
9.3.3 France
9.3.4 Germany
9.3.5 UK
9.3.6 Rest of Europe
9.4 Asia Pacific
9.4.1 China
9.4.2 Japan
9.4.3 India
9.4.4 Australia
9.4.5 Rest of Asia Pacific
9.5 RoW
9.5.1 South America
9.5.2 Middle East
9.5.3 South Africa
10 Competitive Landscape (Page No. - 92)
10.1 Overview
10.2 Market Ranking
10.3 Company Product Offerings, By End-Use Application
10.4 Competitive Scenario
10.4.1 Expansions and Acquisitions
11 Company Profiles (Page No. - 95)
11.1 Merck
(Business Overview, Products Offered, SWOT Analysis, and MnM View)*
11.2 Changmao Biochemical Engineering
11.3 Omkar Specialty Chemicals
11.4 Caviro Group
11.5 ATP Group
11.6 Tarac Technologies
11.7 Pahi
11.8 Distillerie Mazzari
11.9 Distillerie Bonollo
11.10 Derivados Vinicos
11.11 Industrias Vinicas
11.12 Tártaros Gonzalo Castelló
*Details on Business Overview, Products Offered, SWOT Analysis, and MnM View Might Not Be Captured in Case of Unlisted Companies.
12 Appendix (Page No. - 113)
12.1 Discussion Guide
12.2 Knowledge Store: Marketsandmarkets’ Subscription Portal
12.3 Introducing RT: Real-Time Market Intelligence
12.4 Available Customizations
12.5 Related Reports
12.6 Author Details
List of Tables (94 Tables)
Table 1 US Dollar Exchange Rate Considered for the Study, 2014-2016
Table 2 Tartaric Acid Market Size, By Source, 2015-2022 (USD Million)
Table 3 Market Size For Tartaric Acid, By Source, 2015-2022 (KT)
Table 4 Grapes & Sun-Dried Raisins: Tartaric Acid Market Size, By Region, 2015-2022 (USD Million)
Table 5 Grapes & Sun-Dried Raisins: Market Size, By Region, 2015-2022 (KT)
Table 6 Maleic Anhydride: Market Size for Tartaric Acid, By Region, 2015-2022 (USD Million)
Table 7 Maleic Anhydride: Market Size, By Region, 2015-2022 (KT)
Table 8 Others: Market Size for Tartaric Acid, By Region, 2015-2022 (USD Million)
Table 9 Others: Market Size, By Region, 2015-2022 (KT)
Table 10 Market Size For Tartaric Acid, By Type, 2015–2022 (USD Million)
Table 11 Market Size For Tartaric Acid, By Type, 2015–2022 (KT)
Table 12 Natural: Tartaric Acid Market Size, By Region, 2015–2022 (USD Million)
Table 13 Natural: Market Size, By Region, 2015–2022 (KT)
Table 14 Synthetic: Market Size for Tartaric Acid, By Region, 2015–2022 (USD Million)
Table 15 Synthetic: Market Size, By Region, 2015–2022 (KT)
Table 16 Market Size For Tartaric Acid, By Application, 2015–2022 (USD Million)
Table 17 Market Size For Tartaric Acid, By Application, 2015–2022 (KT)
Table 18 Food & Beverages: Tartaric Acid Market Size, By Region, 2015–2022 (USD Million)
Table 19 Food & Beverages: Market Size, By Region, 2015–2022 (KT)
Table 20 Pharmaceuticals: Market Size for Tartaric Acid, By Region, 2015–2022 (USD Million)
Table 21 Pharmaceuticals: Market Size, By Region, 2015–2022 (KT)
Table 22 Cosmetics & Personal Care Products: Tartaric Acid Market Size, By Region, 2015–2022 (USD Million)
Table 23 Cosmetics & Personal Care Products: Market Size, By Region, 2015–2022 (KT)
Table 24 Other Applications: Market Size for Tartaric Acid, By Region, 2015–2022 (USD Million)
Table 25 Other Applications: Market Size, By Region, 2015–2022 (KT)
Table 26 Market Size For Tartaric Acid, By Region, 2015–2022 (USD Million)
Table 27 Market Size For Tartaric Acid, By Region, 2015–2022 (KT)
Table 28 North America: Tartaric Acid Market Size, By Source, 2015–2022 (USD Million)
Table 29 North America: Market Size For Tartaric Acid, By Source, 2015–2022 (KT)
Table 30 North America: Market Size For Tartaric Acid, By Application, 2015–2022 (USD Million)
Table 31 North America: Market Size for Tartaric Acid, By Application, 2015–2022 (KT)
Table 32 North America: Market Size For Tartaric Acid, By Type, 2015–2022 (USD Million)
Table 33 North America: Market Size For Tartaric Acid, By Type, 2015–2022 (KT)
Table 34 North America: Market Size For Tartaric Acid, By Country, 2015–2022 (KT)
Table 35 US: Tartaric Acid Market Size, By Application, 2015–2022 (USD Million)
Table 36 US: Market Size For Tartaric Acid, By Application, 2015–2022 (KT)
Table 37 Canada: Market Size For Tartaric Acid, By Application, 2015–2022 (USD Million)
Table 38 Canada: Market Size For Tartaric Acid, By Application, 2015–2022 (KT)
Table 39 Mexico: Market Size For Tartaric Acid, By Application, 2015–2022 (USD Million)
Table 40 Mexico: Market Size For Tartaric Acid, By Application, 2015–2022 (KT)
Table 41 Europe: Tartaric Acid Market Size, By Source, 2015-2022 (USD Million)
Table 42 Europe: Market Size For Tartaric Acid, By Source, 2015-2022 (KT)
Table 43 Europe: Market Size For Tartaric Acid, By Application, 2015-2022 (USD Million)
Table 44 Europe: Market Size For Tartaric Acid, By Application, 2015-2022 (KT)
Table 45 Europe: Tartaric Acid Market Size, By Type, 2015-2022 (USD Million)
Table 46 Europe: Market Size For Tartaric Acid, By Type, 2015-2022 (KT)
Table 47 Europe: Market Size For Tartaric Acid, By Country, 2015-2022 (USD Million)
Table 48 Europe: Market Size For Tartaric Acid, By Country, 2015-2022 (KT)
Table 49 Italy: Market Size for Tartaric Acid, By Application, 2015-2022 (USD Million)
Table 50 Italy: Market Size For Tartaric Acid, By Application, 2015-2022 (KT)
Table 51 Spain: Market Size For Tartaric Acid, By Application, 2015-2022(USD Million)
Table 52 Spain: Market Size For Tartaric Acid, By Application, 2015-2022 (KT)
Table 53 France: Tartaric Acid Market Size, By Application, 2015-2022 (USD Million)
Table 54 France: Market Size For Tartaric Acid, By Application, 2015-2022 (KT)
Table 55 Germany: Market Size For Tartaric Acid, By Application, 2015-2022 (USD Million)
Table 56 Germany: Market Size For Tartaric Acid, By Application, 2015-2022 (KT)
Table 57 UK: Market Size For Tartaric Acid, By Application, 2015-2022 (USD Million)
Table 58 UK: Market Size For Tartaric Acid, By Application, 2015-2022 (KT)
Table 59 Rest of Europe: Market Size For Tartaric Acid, By Application, 2015-2022 (USD Million)
Table 60 Rest of Europe: Market Size For Tartaric Acid, By Application, 2015-2022 (KT)
Table 61 Asia Pacific: Market Size for Tartaric Acid, By Source, 2015–2022 (USD Million)
Table 62 Asia Pacific: Market Size For Tartaric Acid, By Source, 2015–2022 (KT)
Table 63 Asia Pacific: Market Size For Tartaric Acid, By Application, 2015–2022 (USD Million)
Table 64 Asia Pacific: Market Size For Tartaric Acid, By Application, 2015–2022 (KT)
Table 65 Asia Pacific: Tartaric Acid Market Size, By Type, 2015–2022 (USD Million)
Table 66 Asia Pacific: Market Size For Tartaric Acid, By Type, 2015–2022 (KT)
Table 67 Asia Pacific: Market Size For Tartaric Acid, By Country, 2015–2022 (USD Million)
Table 68 Asia Pacific: Market Size For Tartaric Acid, By Country, 2015–2022 (KT)
Table 69 China: Market Size For Tartaric Acid, By Application, 2015–2022 (USD Million)
Table 70 China: Market Size For Tartaric Acid, By Application, 2015–2022 (KT)
Table 71 Japan: Tartaric Acid Market Size, By Application, 2015–2022 (USD Million)
Table 72 Japan: Market Size For Tartaric Acid, By Application, 2015–2022 (KT)
Table 73 India: Market Size For Tartaric Acid, By Application, 2015–2022 (USD Million)
Table 74 India: Market Size For Tartaric Acid, By Application, 2015–2022 (KT)
Table 75 Australia: Market Size For Tartaric Acid, By Application, 2015–2022 (USD Million)
Table 76 Australia: Market Size For Tartaric Acid, By Application, 2015–2022 (KT)
Table 77 Rest of Asia Pacific: Market Size For Tartaric Acid, By Application, 2015–2022 (USD Million)
Table 78 Rest of Asia Pacific: Market Size For Tartaric Acid, By Application, 2015–2022 (KT)
Table 79 RoW: Market Size for Tartaric Acid, By Source, 2015–2022 (USD Million)
Table 80 RoW: Market Size For Tartaric Acid, By Source, 2015–2022 (KT)
Table 81 RoW: Market Size For Tartaric Acid, By Application, 2015–2022 (USD Million)
Table 82 RoW: Market Size For Tartaric Acid, By Application, 2015–2022 (KT)
Table 83 RoW: Tartaric Acid Market Size, By Type, 2015–2022 (USD Million)
Table 84 RoW: Market Size For Tartaric Acid, By Type, 2015–2022 (KT)
Table 85 RoW: Market Size For Tartaric Acid, By Country/Region, 2015–2022 (USD Million)
Table 86 RoW: Market Size For Tartaric Acid, By Country/Region, 2015–2022 (KT)
Table 87 South America: Tartaric Acid Market Size, By Application, 2015–2022 (USD Million)
Table 88 South America: Market Size For Tartaric Acid, By Application, 2015–2022 (KT)
Table 89 Middle East: Market Size For Tartaric Acid, By Application, 2015–2022 (USD Million)
Table 90 Middle East: Market Size For Tartaric Acid, By Application, 2015–2022 (KT)
Table 91 South Africa: Market Size For Tartaric Acid, By Application, 2015–2022 (USD Million)
Table 92 South Africa Market Size For Tartaric Acid, By Application, 2015–2022 (KT)
Table 93 Tartaric Acid Market Ranking, 2016
Table 94 Expansions and Acquisitions, 2015–2017
List of Figures (28 Figures)
Figure 1 Market Segmentation
Figure 2 Regional Scope
Figure 3 Tartaric Acid Market: Research Design
Figure 4 Market Size Estimation Methodology: Top-Down Approach
Figure 5 Market Size Estimation Methodology: Bottom-Up Approach
Figure 6 Tartaric Acid Market: Data Triangulation
Figure 7 Market Size For Tartaric Acid, By Source, 2017 vs 2022 (USD Million)
Figure 8 Market Size For Tartaric Acid, By Application, 2017-2022 (USD Million)
Figure 9 Market Size For Tartaric Acid, By Type, 2017-2022 (USD Million)
Figure 10 Tartaric Acid Market Share, By Region
Figure 11 Increase in Multifunctionality Across Different Industries Drives the Demand for Tartaric Acid
Figure 12 Grapes & Sun-Dried Raisins and Italy Accounted for the Largest Shares in 2016
Figure 13 Europe to Be the Dominant Region in the Tartaric Acid Market From 2017 to 2022
Figure 14 Food & Beverages Segment to Be the Fastest-Growing During the Forecast Period
Figure 15 European Countries to Dominate the Market For Tartaric Acid, 2017–2022
Figure 16 Tartaric Acid Market: Drivers, Restraints, Opportunities, and Challenges
Figure 17 European Union Area Under Wine Production, 2016
Figure 18 Global Wine Consumption, 2015
Figure 19 Supply Chain Analysis of the Tartaric Acid Industry
Figure 20 Grapes & Sun-Dried Raisins Segment is Projected to Dominate the Global Market, By Source, 2017–2022 (USD Million)
Figure 21 Natural Tartaric Acid Market to Grow at A Higher CAGR During the Forecast Period
Figure 22 Food & Beverage is Projected to Dominate the Global Market, By Application Through 2022 (USD Million)
Figure 23 Europe: Snapshot of the Market For Tartaric Acid
Figure 24 Asia Pacific: Snapshot of the Market For Tartaric Acid
Figure 25 Developments of Leading Players in the Tartaric Acid Market(2012-2017)
Figure 26 Merck: Company Snapshot
Figure 27 Changmao Biochemical Engineering: Company Snapshot
Figure 28 Omkar Specialty Chemicals: Company Snapshot


Growth opportunities and latent adjacency in Tartaric Acid Market