Trash Bags Market by Type (Star Sealed, Drawstring), Material (HDPE, LDPE, Bio-degradable PE), End-Use (Retail, Institutional, Industrial), Distribution Channel (Supermarkets/Hypermarkets, Convenience Stores, E-Commerce), & Region-Global Forecast to 2028
Updated on : November 11, 2025
Trash Bags Market
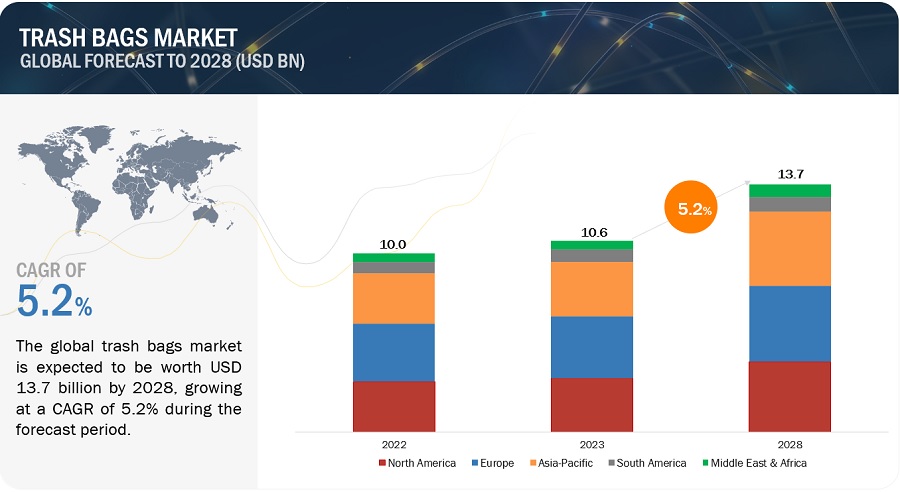
The global trash bags market was valued at USD 10.6 billion in 2023 and is projected to reach USD 13.7 billion by 2028, growing at 5.2% cagr from 2023 to 2028. The market has observed stable growth throughout the study period and is expected to continue with the same trend during the forecast period. Growing awareness among individuals regarding hygiene maintenance and government initiatives to reduce plastic pollution is expected to drive the growth of the market in the upcoming years.
Trash Bags Market Forecast & Trends
To know about the assumptions considered for the study, Request for Free Sample Report
Attractive Opportunities in the Trash Bags Market
Trash Bags Market Dynamics
Driver: Rapid urbanization and economic development
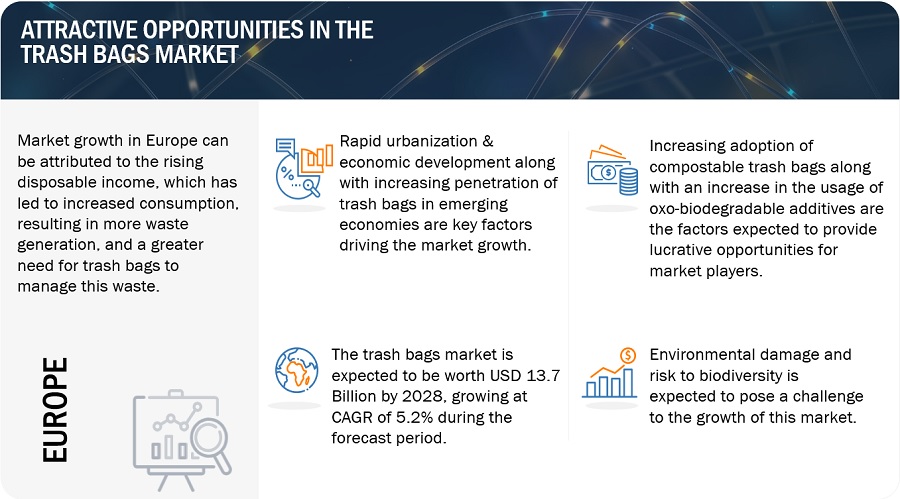
Rapid urbanization and economic development in emerging economies worldwide have led to a rise in the generation of Municipal Solid Waste (MSW). People’s migration to cities is leading to growing urbanization. This has resulted in the increased generation of household waste. Trash bags offer a convenient method for garbage collection across homes, offices, hospitals, and hotels, among others. Higher economic standards and urbanization are expected to lead to an increase in the consumption of trash bags. According to a projection by the World Bank, the global MSW generation by urban residents is expected to reach 2.2 billion tons per year by 2025, which is expected to drive the demand for trash bags.
Restraint: Taxes and bans on the consumption of plastic bags
Governments of various countries levy taxes on non-biodegradable plastic bags. Additional regulations, such as the thickness of the bags manufactured, coupled with improper dumping and environmental concerns, are contributing to a reduction in the usage of plastic bags. For instance, in Ireland, the use of single-use plastic bags dropped by 90% after the implementation of a levy on its consumption. Various European countries, such as Denmark, Ireland, Wales, Scotland, Italy, and Germany have levied taxes on the consumption of plastic bags, as they account for 3% of all marine litter in Europe and are posing a serious threat to the marine ecosystem. In the US, California and Hawaii have banned the use of single-use plastic bags to reduce the damage caused to the environment. Thus, taxes and bans on the consumption of plastic bags are major factors restraining the growth of the trash bags market.
Opportunity: Increasing adoption of compostable trash bags
Plastic trash bags take over 1,000 years to decompose in landfills and are known to damage the environment. The increasing number of landfills around the world are leading to the rising demand for compostable and reusable bags. To reduce landfills, countries such as the Netherlands, the UK, and Japan recycle approximately 51%, 39%, and 20.8% of all the waste generated respectively. Moreover, the incineration of plastic waste for energy generation releases harmful gases, which adds to the growing demand for compostable and reusable trash bags. Corn starch and potato starch are being used to manufacture compostable trash bags to replace plastic trash bags.
Challenge: Environmental damage and risk to biodiversity
Over 5 trillion plastic bags, including trash bags and single-use plastic bags, are used every year and discarded, resulting in environmental pollution. Plastic bags are among the top 12 items of debris most often found along coastlines, posing a threat to aquatic life. Increasing awareness regarding the damage to the environment due to the use of plastic bags is leading to a reduction in the use of these products.
Trash Bags Market Ecosystem
Prominent companies in this market include well-established, financially stable trash bag manufacturers. These companies have been operating in the market for several years and possess a diversified product portfolio and strong global sales and marketing networks. Prominent companies in this market include Berry Global Inc. (US), The Clorox Company (US), Novolex (US), Inteplast Group Ltd. (US), and Reynolds Consumer Products (US).
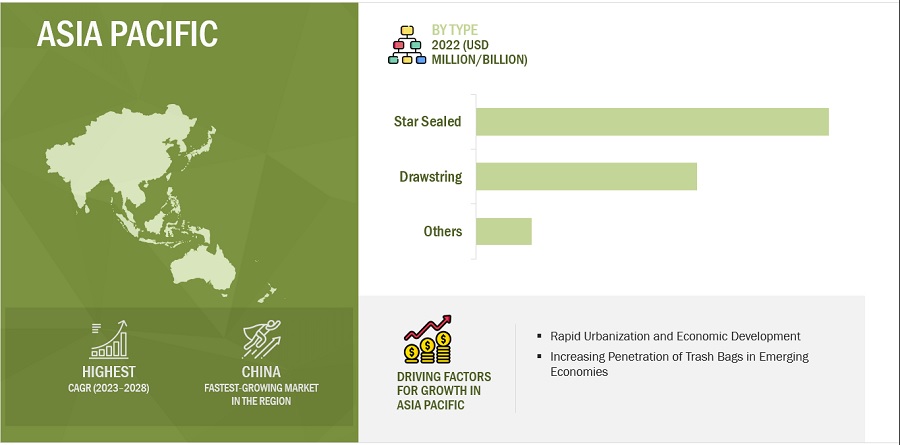
Based on type, the star sealed bags segment is projected to register the highest CAGR in the trash bags market during the forecast period
Star sealed trash bags, also known as X-seal bags, are the most commonly used durable bags exhibiting high leak and puncture resistance. These bags are available in various colors, customizable sizes, and thicknesses, so as to facilitate proper disposal of distinct kinds of waste, such as wet and dry waste. Star sealed bottom bags are considered to be environment-friendly, as these can reduce plastic waste by up to 25% with the use of recycled plastics.
Based on end use, the retail segment is projected to register highest CAGR in the trash bags market.
The retail segment is projected to register highest CAGR owing to its dominance. The retail segment leads in the overall consumption of trash bags across the globe. The global retail segment has been showing robust growth in recent years due to the increasing urban population and stringent regulations for handling waste for households.
Based on region, Asia Pacific is projected to register highest CAGR in the global trash bags market.
Asia Pacific is one of the leading exporters of trash bags in the world. Increasing construction activities, growing population, and rise in disposable incomes are some of the major factors promoting market expansion in this region. Potential markets in Asia Pacific include China and India, among Australia, Singapore, Japan, and South Korea. These countries provide considerable scope for the further development of trash bags market.
To know about the assumptions considered for the study, download the pdf brochure
Trash Bags Market Players
Berry Global Inc. (US), The Clorox Company (US), Inteplast Group Ltd. (US), Four Star Plastics (US), Novolex (US), International Plastics Inc. (US), Reynolds Consumer Products (US), Poly-America, L.P. (US), Cosmoplast (UAE), Novplasta (Slovakia) are among the major players leading the market through their innovative offerings, enhanced production capacities, and efficient distribution channels.
Trash Bags Market Report Scope
|
Report Metric |
Details |
|
Market Size Available for Years |
2017 to 2028 |
|
Base Year Considered |
2022 |
|
Forecast Period |
2023–2028 |
|
Forecast Units |
Value (USD Billion), Volume (KiloTons) |
|
Segments Covered |
Material, Type, Size, Distribution Channel, End-Use, and Region |
|
Geographies Covered |
Europe, Asia Pacific, North America, South America, and Middle East & Africa. |
|
Companies Covered |
The major market players include are Berry Global Inc. (US), Cosmoplast (UAE), Four Star Plastics (US), The Clorox Company (US), International Plastics, Inc. (US), Novolex (US), Novplasta (Slovakia), Inteplast Group, Ltd. (US), Poly-America, L.P., (US), and Reynolds Consumer Products (US), and others |
This research report categorizes the trash bags market based on material, type, size, distribution channel, end-use, and region.
Based on material, the trash bags market has been segmented as follows:
- High Density Polyethylene (HDPE)
- Low Density Polyethylene (LDPE)
- Linear Low Density Polyethylene (LLDPE)
- Bio-degradable Polyethylene
- Others
Based on type, the trash bags market has been segmented as follows:
- Draw Tape/ Drawstring Bag
- Star Sealed Bags
- Others
Based on size, the trash bags market has been segmented as follows:
- Small Size (3 to <13 Gallon)
- Medium Size (>13 to <50 Gallon)
- Large Size (>50 Gallon)
Based on distribution channel, the trash bags market has been segmented as follows:
- Supermarkets/Hypermarkets
- Convenience Stores
- Specialty Stores
- E-Commerce
- Others
Based on end-use, the trash bags market has been segmented as follows:
- Retail
- Institutional
- Industrial
Based on the region, the trash bags market has been segmented as follows:
-
Asia Pacific
- China
- India
- Japan
- South Korea
- Rest of Asia Pacific
-
Europe
- Germany
- UK
- France
- Greece
- Russia
- Poland
- Italy
- Rest of Europe
-
North America
- US
- Canada
- Mexico
-
South America
- Brazil
- Argentina
- Rest of South America
-
Middle East & Africa
- Saudi Arabia
- Nigeria
- South Africa
- Rest of Middle East & Africa
Recent Developments
- In May 2023, Reynolds Consumer Products launched Hefty Ultra Strong with a fabulous lemon scent. It is generally made for kitchen trash and works to keep homes smelling fresh.
- In September 2022, Novolex invested USD 10 million to expand its plastic bag and polyethylene film recycling capacity at its facility in North Vernon, Indiana. This strategic move demonstrates Novolex's commitment to promoting recycling and furthering its capabilities in the sustainable management of plastic materials.
- In April 2022, Apollo Funds have completed the acquisition of a majority stake in Novolex. The intent is to drive innovation and growth.
Frequently Asked Questions (FAQ):
What is the current size of the trash bags market?
The trash bags market is projected to grow from USD 10.6 billion in 2023 to USD 13.7 billion by 2028, at a CAGR of 5.2% from 2023 to 2030.
Which region is expected to hold the highest market share in the trash bags market?
The trash bags market in Europe is estimated to hold the highest market share.
What is the major end-use of trash bags?
The institutional industry is the major end-use industry of trash bags.
Who are the major players operating in the trash bags market?
The major players operating in the market include Berry Global Inc. (US), The Clorox Company (US), Novolex (US), Inteplast Group Ltd. (US), and Reynolds Consumer Products (US).
What is the total CAGR expected to record for the trash bags market during 2023-2028?
The market is expected to record a CAGR of 5.2% from 2023-2028.
What are the primary market drivers for trash bags in Europe, especially in light of increasing sustainability and waste management regulations?
A look at how trends like eco-friendly materials, recycling initiatives, and waste reduction targets are influencing demand in Europe.
How are EU policies, such as plastic bans and recycling mandates, impacting the trash bags market in Europe?
Discussion on the effect of regulations on materials used in trash bag production, including shifts toward biodegradable and recyclable materials.
What are the biggest challenges facing North American trash bag manufacturers, particularly regarding raw material costs and environmental regulations?
Insight into how companies are managing cost fluctuations, meeting environmental standards, and adapting to consumer preferences for sustainable options.
How are technological innovations transforming the North American trash bags market, especially regarding biodegradable and compostable alternatives?
Overview of new product developments in North America, including the adoption of advanced materials and manufacturing processes to meet sustainability goals.
To speak to our analyst for a discussion on the above findings, click Speak to Analyst

The study involved four major activities in estimating the current market size of trash bags. Exhaustive secondary research was done to collect information on the market, the peer market, and the parent market. The next step was to validate these findings, assumptions, and sizes with industry experts across the value chain of trash bags through primary research. Both top-down and bottom-up approaches were employed to estimate the complete market size. After that, market breakdown and data triangulation were used to estimate the size of the segments and sub-segments of the market.
Secondary Research
The research methodology used to estimate and forecast the access control market begins with capturing data on revenues of key vendors in the market through secondary research. In the secondary research process, various secondary sources, such as Hoovers, Bloomberg BusinessWeek, Factiva, World Bank, and Industry Journals, were referred to for identifying and collecting information for this study. These secondary sources included annual reports, press releases & investor presentations of companies; white papers; certified publications; articles by recognized authors; notifications by regulatory bodies; trade directories; and databases. Vendor offerings have also been taken into consideration to determine market segmentation.
Primary Research
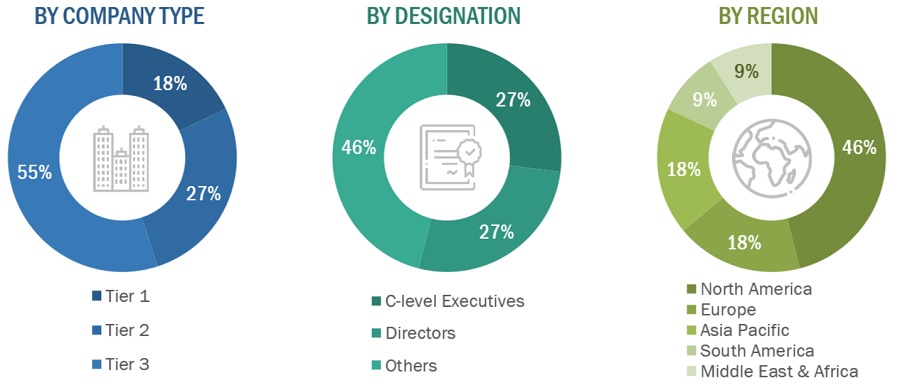
The trash bags market comprises several stakeholders, such as raw material suppliers, processors, trash bag manufacturers, end users, and regulatory organizations in the supply chain. Various primary sources from both the supply and demand sides of the market were interviewed to obtain qualitative and quantitative information. Primary sources from the supply side included industry experts such as Chief Executive Officers (CEOs), vice presidents, marketing directors, technology and innovation directors, and related key executives from various key companies and organizations operating in the trash bags market. Primary sources from the demand side included directors, marketing heads, and purchase managers from various sourcing industries.
Following is the breakdown of the primary respondents:
To know about the assumptions considered for the study, download the pdf brochure
Market Size Estimation
Both the top-down and bottom-up approaches were used to estimate and validate the total size of the trash bags market. These methods were also used extensively to determine the size of various sub-segments in the market. The research methodology used to estimate the market size included the following:
- The key players were identified through extensive primary and secondary research.
- The value chain and market size of the trash bags market, in terms of value, were determined through primary and secondary research.
- All percentage shares, splits, and breakdowns were determined using secondary sources and verified through primary sources.
- All possible parameters that affect the market covered in this research study were accounted for, viewed in extensive detail, verified through primary research, and analyzed to obtain the final quantitative and qualitative data.
- The research included the study of reports, reviews, and newsletters of top market players, along with extensive interviews for opinions from key leaders, such as CEOs, directors, and marketing executives.
Global Trash Bags Market Size: Bottom-Up Approach

To know about the assumptions considered for the study, Request for Free Sample Report
Global Trash Bags Market Size: Top-Down Approach

Data Triangulation
After arriving at the overall market size using the market size estimation processes as explained above, the market was split into several segments and sub-segments. To complete the overall market engineering process and arrive at the exact statistics of each market segment and subsegment, the data triangulation and market breakdown procedures were employed, wherever applicable. The data was triangulated by studying various factors and trends from both the demand and supply sides in the automotive and non-automotive sources.
Market Definition
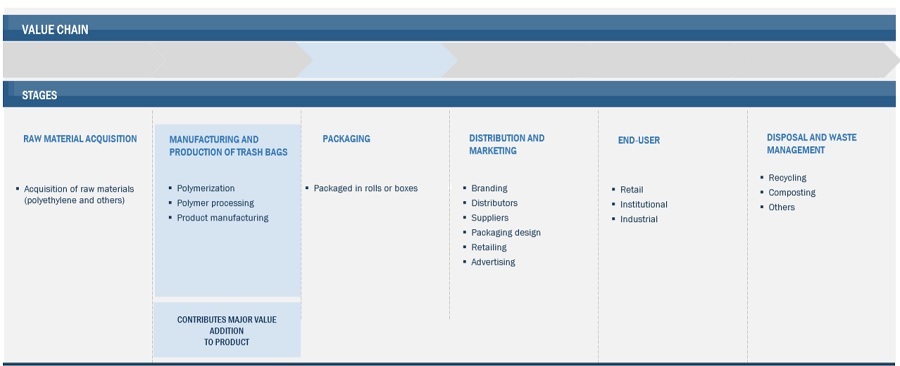
Trash bags, also known as garbage bags, bin bags, rubbish bags, bin liners, waste liners, and can liners, are used for the collection, handling, and disposal of trash. Trash bags can be made from different materials that are commercially viable. Trash bags are used in the retail, institutional, and industrial end-use industries for efficient trash handling. The serviceability of a trash bag is defined by the material as well as the weight it can carry.
The trash bag was invented by a Canadian inventor, Harry Wasylyk, along with Larry Hansen, in 1950. During the early years after its invention, trash bags were intended to be used for commercial rather than household purposes. Garbage bags are commonly manufactured using thermoplastics, such as Low-density Polyethylene (LDPE) and High-density Polyethylene (HDPE). LDPE trash bags are thick, flexible, and highly resistant to puncturing and tearing, making them ideal for use in kitchen and outdoor trash cans. HDPE trash bags undergo a different manufacturing process as compared with LDPE trash bags, making them thinner and less puncture resistant, ideal for use in offices and restrooms.
Key Stakeholders
- Raw material manufacturers
- Manufacturers of trash bags
- Traders, distributors, and suppliers of trash bags
- Regulatory Bodies and Government Agencies
- Research & Development (R&D) Institutions
- Consulting Firms, Trade Associations, and Industry Bodies
- Investment Banks and Private Equity Firms
- End users of trash bags
Report Objectives:
- To analyze and forecast the market size of trash bags in terms of value and volume.
- To provide detailed information regarding the major factors (drivers, restraints, challenges, and opportunities) influencing the regional market
- To analyze and forecast the global trash bags market on the basis of type and end-use.
- To analyze the opportunities in the market for stakeholders and provide details of a competitive landscape for market leaders.
- To strategically analyze the micromarkets with respect to individual growth trends, growth prospects, and their contribution to the overall market
- To forecast the size of various market segments based on five major regions: North America, Europe, Asia Pacific, South America, and the Middle East & Africa, and along with their respective key countries.
- To analyze competitive developments, such as expansions, agreements, acquisitions, partnerships, new product launches, investments, joint ventures, contracts, mergers and collaborations, new technology developments, and new process developments, in the market.
- To strategically profile the key players and comprehensively analyze their market shares and core competencies.
Available Customizations:
With the given market data, MarketsandMarkets offers customizations according to the client-specific needs.
The following customization options are available for the report:
- Additional country-level analysis of the trash bags market
- Profiling of additional market players (up to 5)
Product Analysis
- Product matrix, which gives a detailed comparison of the product portfolio of each company.


Growth opportunities and latent adjacency in Trash Bags Market