Urban Air Mobility Market

Urban Air Mobility Market Size, Share, Industry, Statistics & Growth Analysis Report by Solution (Infrastructure, Platform), Mobility Type (Air Taxi, Personal Air Vehicle, Cargo Air Vehicle, Air Ambulance), Platform Operation, Range, Platform Architecture, End User, Region- Global Growth Driver and Forecast to 2030

Report Code: AS 6957 Jun, 2023, by marketsandmarkets.com

[295 Pages Report] The Global Urban Air Mobility Market Size is estimated to grow from USD 3.8 billion in 2023 to USD 28.5 billion by 2030, at a CAGR of 33.5% from 2023 to 2030. The market is driven by factors such as growing smart city initiatives, a rise in environmental concerns, and increasing advancements in technology for UAM Industry.

Urban Air Mobility Market

Urban Air Mobility Market

Urban Air Mobility Market Forecast to 2030

To know about the assumptions considered for the study, Request for Free Sample Report

Urban Air Mobility Market Dynamics:

Driver: Need for fast and effective transportation

As urban populations grow and traffic congestion worsens, there is an increasing need for transportation options that can overcome these challenges and provide faster, point-to-point travel. UAM offers a promising solution by leveraging airspace and vertical takeoff and landing (VTOL) capabilities to provide on-demand aerial transportation services. The demand for UAM arises from both individuals and businesses seeking improved mobility. Commuters are looking for faster and more efficient ways to navigate congested cities, while businesses require efficient logistics solutions to move goods swiftly and reliably. UAM addresses these demands by offering direct and rapid connections between urban locations, bypassing the limitations of ground infrastructure. Flexibility is a key aspect driving the demand for UAM. UAM vehicles, such as electric-powered drones or flying taxis, can transport passengers and cargo directly to their destinations, reducing travel times compared to ground-based alternatives. This flexibility allows UAM to bridge gaps in existing transportation networks, reaching areas that are underserved by traditional ground infrastructure.

Moreover, the convenience factor plays a vital role in driving the demand for UAM. The ability to request a UAM vehicle on-demand and enjoy seamless point-to-point travel offers a compelling alternative to traditional transportation modes. The integration of digital platforms and applications further enhances the user experience, allowing individuals to book and track UAM flights with ease. The demand for mobility solutions also extends to specific use cases such as emergency medical services, where UAM can provide quick and efficient transportation of medical personnel and equipment to remote or congested areas. Additionally, UAM can support last-mile delivery services, enabling rapid and efficient distribution of goods in urban environments.

Restraint: Limited regulatory framework

UAM technology is continuously advancing, requiring the regulatory framework to adapt and keep up with innovations such as electric propulsion, autonomous flight, and communication networks. This dynamic environment leads to delays and uncertainties as regulations are constantly revised and updated. The complexity of UAM operations presents challenges for regulators. Integrating UAM vehicles into existing airspace management systems, alongside traditional manned aircraft and helicopters, requires standardization of protocols, coordination, and the development of new air traffic management mechanisms. The intricacy of this task can create bottlenecks in the regulatory process, as ensuring safety and efficient integration takes time and resources.

Certification of UAM vehicles poses an additional restraint. Traditional aviation certification processes may not directly apply to the innovative features of UAM technology. Regulators must establish new standards and procedures tailored to UAM vehicles, considering their unique characteristics, such as electric propulsion systems, vertical take-off and landing capabilities, and autonomous flight. Developing these new standards necessitates rigorous testing, evaluation, and validation, further contributing to regulatory constraints. Specialized infrastructure requirements, including vertiports, charging stations, and maintenance facilities, also present regulatory challenges. Coordinating with local authorities, urban planners, and regulatory bodies responsible for land use and zoning is necessary. Addressing land-use restrictions, environmental considerations, and safety standards associated with UAM infrastructure development requires a regulatory framework that accommodates these factors.

Opportunity: Need for sustainable development

UAM represents a significant opportunity for sustainable development in urban transportation. One of the primary drivers of sustainability in UAM is the use of electric vertical takeoff and landing (eVTOL) aircraft. These aircraft employ electric propulsion systems, reducing dependence on fossil fuels and minimizing greenhouse gas emissions. By transitioning from conventional combustion engines to electric power, UAM contributes to global efforts to combat climate change and achieve decarbonization targets in the transportation sector.

Additionally, UAM offers the potential to optimize urban infrastructure and reduce the need for expanding ground transportation networks. By utilizing the three-dimensional airspace, UAM maximizes the use of existing infrastructure, decreasing the demand for new roads and parking facilities. This approach helps to preserve valuable land and resources while minimizing the environmental impact associated with expanding traditional ground-based transportation infrastructure. Noise pollution is another critical aspect addressed by UAM. Electric-powered eVTOL aircraft produce significantly lower noise levels compared to conventional helicopters or airplanes. The adoption of UAM can help mitigate noise pollution in urban areas, contributing to more livable and sustainable cities. The development of quieter propulsion systems and the implementation of noise abatement procedures further enhance the environmentally friendly nature of UAM.

In terms of sustainable urban mobility, UAM provides faster and more efficient transportation options, potentially reducing the reliance on personal vehicles. This shift can lead to a decrease in traffic congestion and associated environmental issues such as air pollution and carbon emissions. By offering direct point-to-point connectivity, UAM minimizes travel times, contributing to efficient resource utilization and reduced environmental impact. Moreover, the UAM industry drives innovation in sustainable technologies. The development of lightweight materials, efficient battery systems, and advanced energy management solutions for eVTOL aircraft can have broader implications for renewable energy adoption and energy efficiency in various industries. Lessons learned from UAM's sustainable practices, such as optimizing energy consumption and implementing smart charging infrastructure, can be transferred to other sectors, fostering sustainable development and promoting the use of clean energy solutions.

Challenges: Lack of skilled labor

The lack of qualified workers and skills poses a variety of problems for the market and industry for UAM. UAM systems need to be developed, operated, and maintained successfully, which calls for highly qualified personnel with specialized knowledge in numerous technical fields. Manufacturing of aircraft is one area where specialized labor is essential. Advanced electric vertical takeoff and landing (eVTOL) aircraft are a key component of UAM's business. These aircraft require the development and manufacture of skilled technicians, engineers, and designers that have specialized understanding in fields like aerodynamics, electric propulsion systems, avionics, and composite materials. The lack of qualified workers in these disciplines can cause quality control problems, innovation challenges, and delays in aircraft construction.

The effective operation of intricate electric propulsion systems, avionics, and other specialized components depends on skilled technicians and mechanics.

Additionally, qualified experts in air traffic control and airspace management are required for the integration of UAM into current airspace and air traffic management systems. UAM operations must be properly coordinated and integrated with conventional aviation, which calls for proficiency in handling increased air traffic, putting in place cutting-edge traffic management systems, and guaranteeing the safe and effective use of airspace. The lack of qualified individuals in these fields can make it difficult for UAM operations to integrate smoothly into the current aviation ecosystem, leading to operational inefficiencies and significant safety issues. The lack of skilled labor can also impact research and development efforts in the UAM industry. Skilled researchers, scientists, and engineers play a vital role in advancing UAM technologies, exploring innovative solutions, and addressing complex challenges. The shortage of skilled labor in research and development can hinder progress in areas such as energy efficiency, noise reduction, autonomous systems, and infrastructure development.

Urban Air Mobility Market Ecosystem:

Urban Air Mobility Market by Ecosystem

Based on end user, the scheduled operator’s segment is projected to have the second highest share in 2023

Based on end users, the urban air mobility market has been segmented into ridesharing companies, scheduled operators, e-commerce companies, hospitals & medical agencies, and private operators. Scheduled operators are responsible for providing regular and planned UAM services to passengers, similar to traditional scheduled airlines. They ensure that UAM operations adhere to specific routes, timetables, and service standards. Scheduled operators play a crucial role in managing passenger bookings, coordinating flights, optimizing routes, and maintaining operational efficiency. The growth of scheduled operators contributes to the development of reliable and accessible urban air transportation, providing commuters with a convenient and predictable mode of travel within urban areas while enhancing connectivity and reducing congestion on the ground.

Based on platform architecture, the fixed-wing segment of the market is projected to grow at the highest CAGR from 2023 to 2030.

Based on platform architecture, urban air mobility has been segmented into rotary wing, fixed-wing hybrid, and fixed-wing.  A fixed-wing aircraft generates a forward thrust as the wings generate lift due to the aircraft’s speed and the shape of the wings. The wings are not always static, and a pilot does not always fly the aircraft. Fixed-wing UAM vehicles require shorter take-off and landing distances, allowing for the utilization of existing infrastructure. The integration of advanced technologies such as electric propulsion and autonomous flight systems further enhances the potential of fixed-wing UAM, contributing to the expansion of this exciting and transformative mode of transportation.

Based on mobility type, the air taxis segment of the market is projected to grow at the highest CAGR from 2023 to 2030.

Based on mobility type, the urban air mobility market has been segmented into air taxis, air shuttles & air metros, personal air vehicles, cargo air vehicles, and air ambulances & medical emergency vehicles. The air taxis segment is estimated to lead during the forecast period owing to increasing developments in manned and unmanned aircraft. Air taxis have emerged as an appealing solution, capable of mitigating traffic congestion and minimizing travel durations. As a result, they have garnered interest from both commuters and travellers seeking faster and more convenient mobility options. By offering the potential to reduce travel times and alleviate urban congestion, air taxis have become increasingly attractive within the transportation landscape.

North America is expected to account for the highest CAGR in the forecasted period.

North America is estimated to account for the highest CAGR in the forecasted period. The market growth in this region is expected to be fueled by an advancement in technology and investments in the UAM industry during the forecast period. The major countries considered under this region are the US and Canada. The key factor responsible for North America leading the UAM market is the high demand for new modes of transportation in the region. The growing demand for aircraft for commercial applications and their increasing utility in the civil sector to carry out transport and logistics activities are additional factors influencing the growth of the North America UAM market.

Urban Air Mobility Market by Region

Urban Air Mobility Market by Region

To know about the assumptions considered for the study, download the pdf brochure

Key Market Players

Players such as Airbus SE (Netherlands), Eve Holding, Inc. (Brazil), Joby Aviation, Inc. (US), Textron Inc. (US), Airo Group Holdings, Inc. (US), and Wingcopter GmbH (Germany). The report covers various industry trends and new technological innovations in the urban air mobility companies for the period 2020-2030.

Get online access to the report on the World's First Market Intelligence Cloud

  • Easy to Download Historical Data & Forecast Numbers
  • Company Analysis Dashboard for high growth potential opportunities
  • Research Analyst Access for customization & queries
  • Competitor Analysis with Interactive dashboard
  • Latest News, Updates & Trend analysis
Request Sample

Scope of the Report

Report Metric

Details

Estimated Market Size

USD 3.8 Billion by 2023

Projected Market Size

USD 28.5 Billion by 2030

CAGR

33.5%

Market size available for years

2020-2030

Base year considered

2022

Forecast period

2023-2030

Forecast units

Value (USD)

Segments Covered

By Solution, By Mobility type, By Range, By Platform Operation, By Platform Architecture, By End User

Geographies covered

North America, Europe, Asia Pacific, Latin America, and Rest of the World

Companies covered

Airbus SE (Netherlands), Wisk Aero LLC (US), Volocopter GmbH (Germany), Ehang (China), Joby Aviation Inc. (US), and Textron Inc. (US), among others

Urban Air Mobility Market Highlights

This research report categorizes the urban air mobility Market based on solution, mobility type, range, platform operation, platform architecture, end user, and region.

Segment

Subsegment

By Solution

  • Infrastructures
    • Charging Stations
    • Vertiports
    • Air Traffic Management Facilities
    • Maintenance Facilities
  • Platforms
    • Aerostructures
    • Avionics
    • Electrical Systems
    • Propulsion Systems
    • Software


By Range

  • Intercity (> 100 km)
  • Intracity (< 100 km)


By Platform Operation

  • Piloted
  • Autonomous
    • Remotely Piloted
    • Fully Autonomous

By Platform Architecture

  • Rotary-wing
  • Fixed-wing Hybrid
  • Fixed-wing

By End User

  • Ridesharing Companies
  • Scheduled Operators
  • E-commerce Companies
  • Hospitals & Medical Agencies
  • Private Operators

By Mobility Type

  • Air Taxis
  • Air Shuttles and & Air Metros
  • Personal Air Vehicles
  • Cargo Air Vehicles
  • Air Ambulances & Medical Emergency Vehicles

By Region

  • North America
  •  Europe
  • Asia Pacific
  • Latin America
  • Rest of the World

Recent Developments

  • In March 2023, Lilium Aviation GmbH, a company pioneering all-electric vertical take-off, and landing (eVTOL) jets, entered into a partnership with Air-Dynamic SA, a private jet and helicopter company based in Switzerland. Under the definitive agreement, Air-Dynamic SA has committed to purchasing up to five Lilium Jets and has made deposit payments to secure the orders.
  • In March 2023, in order to explore the use of Eve Air Mobility's Urban Air Traffic Management (Urban ATM) software solution to support the safe and dependable operation of vertiports and electric vertical take-off and landing (eVTOL) aircraft, Eve Holding, Inc. and Ferrovial Vertiports have signed a Letter of Intent (LOI). Ferrovial Vertiports is a subsidiary of the world's largest infrastructure operator Ferrovial.
  • In March 2023, Kakao Mobility, a South Korean mobility technology business, placed a pre-order for up to 50 of Vertical's VX4 aircraft, expanding the number of customer launch regions for the company.
  • In April 2023, Joby Aviation, Inc. announced the third extension of its contract with the United States Air Force under the Agility Prime program. This contract extension, valued at $55 million, increases the potential total value of Joby's existing contract with the Air Force to $131 million. As per the agreement, Joby will provide and operate up to nine of its five-seat aircraft, characterized by low noise levels and zero operating emissions.
  • In March 2023, in order to collaboratively develop the safe and dependable operation of vertiports and eVTOLs, Ferrovial Airports, part of Ferrovial S.A. and Eve Holding, Inc., a developer of eVTOL aircraft, services, & support, as well as software for urban air traffic management (Urban ATM), have entered into a partnership. Ferrovial's dedication to urban air mobility is strengthened by this collaboration, which is expressed in a declaration of intent.

Frequently Asked Questions (FAQ):

To speak to our analyst for a discussion on the above findings, click Speak to Analyst

TABLE OF CONTENTS
 
1 INTRODUCTION (Page No. - 38)
    1.1 STUDY OBJECTIVES 
    1.2 MARKET DEFINITION 
    1.3 STUDY SCOPE 
           1.3.1 MARKETS COVERED
                    FIGURE 1 URBAN AIR MOBILITY MARKET SEGMENTATION
           1.3.2 REGIONS COVERED
           1.3.3 YEARS CONSIDERED
    1.4 INCLUSIONS AND EXCLUSIONS 
           TABLE 1 INCLUSIONS AND EXCLUSIONS
    1.5 CURRENCY 
           TABLE 2 USD EXCHANGE RATES
    1.6 LIMITATIONS 
    1.7 MARKET STAKEHOLDERS 
    1.8 SUMMARY OF CHANGES 
 
2 RESEARCH METHODOLOGY (Page No. - 44)
    2.1 RESEARCH DATA 
           FIGURE 2 RESEARCH PROCESS FLOW
           FIGURE 3 RESEARCH DESIGN
           2.1.1 SECONDARY DATA
                    2.1.1.1 Key data from secondary sources
           2.1.2 PRIMARY DATA
                    2.1.2.1 Key primary sources
                    2.1.2.2 Key data from primary sources
                               FIGURE 4 BREAKDOWN OF PRIMARIES
    2.2 FACTOR ANALYSIS 
           2.2.1 INTRODUCTION
           2.2.2 DEMAND-SIDE INDICATORS
           2.2.3 SUPPLY-SIDE INDICATORS
           2.2.4 RECESSION IMPACT ANALYSIS
    2.3 MARKET SIZE ESTIMATION 
           2.3.1 BOTTOM-UP APPROACH
                    2.3.1.1 Market size estimation and methodology
                               FIGURE 5 BOTTOM-UP APPROACH
           2.3.2 TOP-DOWN APPROACH
                    FIGURE 6 TOP-DOWN APPROACH
    2.4 DATA TRIANGULATION 
           FIGURE 7 DATA TRIANGULATION
    2.5 RESEARCH ASSUMPTIONS 
    2.6 RESEARCH LIMITATIONS 
 
3 EXECUTIVE SUMMARY (Page No. - 53)
    FIGURE 8 INTERCITY (>100 KM) SEGMENT TO HOLD LEADING MARKET POSITION IN 2023
    FIGURE 9 AIR TAXIS TO SURPASS OTHER SEGMENTS DURING FORECAST PERIOD
    FIGURE 10 PLATFORMS TO HOLD LARGEST MARKET SHARE BETWEEN 2023 AND 2030
    FIGURE 11 NORTH AMERICAN URBAN AIR MOBILITY MARKET TO ACCOUNT FOR HIGHEST CAGR DURING FORECAST PERIOD
 
4 PREMIUM INSIGHTS (Page No. - 56)
    4.1 ATTRACTIVE OPPORTUNITIES FOR PLAYERS IN URBAN AIR MOBILITY MARKET 
           FIGURE 12 NEED FOR ALTERNATIVE MODES OF TRANSPORTATION IN URBAN AREAS
    4.2 URBAN AIR MOBILITY MARKET, BY END USER 
           FIGURE 13 RIDESHARING COMPANIES TO SECURE MAXIMUM MARKET SHARE DURING FORECAST PERIOD
    4.3 URBAN AIR MOBILITY MARKET, BY PLATFORM OPERATION 
           FIGURE 14 AUTONOMOUS SEGMENT TO RECORD HIGHEST CAGR BY 2030
    4.4 URBAN AIR MOBILITY MARKET, BY COUNTRY 
           FIGURE 15 UK TO BE FASTEST-GROWING COUNTRY BETWEEN 2023 AND 2030
 
5 MARKET OVERVIEW (Page No. - 58)
    5.1 INTRODUCTION 
    5.2 MARKET DYNAMICS 
           FIGURE 16 URBAN AIR MOBILITY MARKET: DRIVERS, RESTRAINTS, OPPORTUNITIES, AND CHALLENGES
           5.2.1 DRIVERS
                    5.2.1.1 Increased urban congestion
                    5.2.1.2 Technological advancements in UAM industry
                    5.2.1.3 Need for fast and effective transportation
                    5.2.1.4 Rise in environmental concerns
                    5.2.1.5 Smart city initiatives
           5.2.2 RESTRAINTS
                    5.2.2.1 Limited regulatory framework
                    5.2.2.2 Psychological obstacles involving UAM
           5.2.3 OPPORTUNITIES
                    5.2.3.1 High demand for shorter lead time
                    5.2.3.2 Need for sustainable development
           5.2.4 CHALLENGES
                    5.2.4.1 Cybersecurity concerns
                    5.2.4.2 Lack of skilled labor
    5.3 RECESSION IMPACT ANALYSIS 
    5.4 VALUE CHAIN ANALYSIS 
           FIGURE 17 VALUE CHAIN ANALYSIS
    5.5 TRENDS/DISRUPTIONS IMPACTING CUSTOMER BUSINESS 
           5.5.1 REVENUE SHIFT AND NEW REVENUE POCKETS FOR URBAN AIR MOBILITY MANUFACTURERS
                    FIGURE 18 REVENUE SHIFT CURVE
    5.6 URBAN AIR MOBILITY MARKET ECOSYSTEM 
           5.6.1 PROMINENT COMPANIES
           5.6.2 PRIVATE AND SMALL ENTERPRISES
           5.6.3 END USERS
                    FIGURE 19 URBAN AIR MOBILITY MARKET ECOSYSTEM MAP
                    TABLE 3 URBAN AIR MOBILITY MARKET ECOSYSTEM
    5.7 PORTER’S FIVE FORCES ANALYSIS 
           TABLE 4 PORTER’S FIVE FORCE ANALYSIS
           5.7.1 THREAT OF NEW ENTRANTS
           5.7.2 THREAT OF SUBSTITUTES
           5.7.3 BARGAINING POWER OF SUPPLIERS
           5.7.4 BARGAINING POWER OF BUYERS
           5.7.5 INTENSITY OF COMPETITIVE RIVALRY
    5.8 PRICING ANALYSIS 
           TABLE 5 AVERAGE PRICE ANALYSIS OF URBAN AIR MOBILITY, BY PLATFORM ARCHITECTURE
    5.9 VOLUME DATA, BY DELIVERIES 
           TABLE 6 PASSENGER URBAN AIR MOBILITY VOLUME DATA (UNITS)
    5.10 TARIFF AND REGULATORY LANDSCAPE 
           TABLE 7 NORTH AMERICA: REGULATORY BODIES, GOVERNMENT AGENCIES, AND OTHER AGENCIES
           TABLE 8 EUROPE: REGULATORY BODIES, GOVERNMENT AGENCIES, AND OTHER AGENCIES
           TABLE 9 ASIA PACIFIC: REGULATORY BODIES, GOVERNMENT AGENCIES, AND OTHER AGENCIES
    5.11 TRADE ANALYSIS 
           TABLE 10 COUNTRY-WISE IMPORTS, 2019–2022 (USD THOUSAND)
           TABLE 11 COUNTRY-WISE EXPORTS, 2019–2022 (USD THOUSAND)
    5.12 KEY STAKEHOLDERS AND BUYING CRITERIA 
           5.12.1 KEY STAKEHOLDERS IN BUYING PROCESS
                    FIGURE 20 INFLUENCE OF STAKEHOLDERS ON BUYING PROCESS OF URBAN AIR MOBILITY, BY SOLUTION
                    TABLE 12 INFLUENCE OF STAKEHOLDERS ON BUYING PROCESS OF URBAN AIR MOBILITY, BY SOLUTION (%)
           5.12.2 BUYING CRITERIA
                    FIGURE 21 KEY BUYING CRITERIA FOR URBAN AIR MOBILITY, BY SOLUTION
                    TABLE 13 KEY BUYING CRITERIA FOR URBAN AIR MOBILITY, BY SOLUTION
    5.13 KEY CONFERENCES AND EVENTS, 2023–2024 
           TABLE 14 CONFERENCES AND EVENTS, 2023–2024
    5.14 TECHNOLOGY ANALYSIS 
           5.14.1 ROBOTICS
           5.14.2 ELECTRIC PROPULSION
    5.15 USE CASE ANALYSIS 
           5.15.1 USE OF DRONES FOR DELIVERY BY WING
           5.15.2 NEED FOR HIGH-RANGE CARGO DRONES
           5.15.3 DESIGNING OF COST-EFFECTIVE ALL-ELECTRIC MID-RANGE AIRCRAFT
 
6 INDUSTRY TRENDS (Page No. - 83)
    6.1 INTRODUCTION 
    6.2 TECHNOLOGY TRENDS 
           6.2.1 HYDROGEN PROPULSION
           6.2.2 AUTOMATION
           6.2.3 INTERNET OF THINGS
           6.2.4 ADVANCED MATERIALS AND MANUFACTURING TECHNIQUES
           6.2.5 BLOCKCHAIN TECHNOLOGY
           6.2.6 BATTERY TECHNOLOGY
           6.2.7 INDUSTRY 4.0
    6.3 IMPACT OF MEGATRENDS 
           6.3.1 CONNECTIVITY AND COMMUNICATIONS
           6.3.2 ARTIFICIAL INTELLIGENCE
           6.3.3 SUSTAINABLE AVIATION FUEL
    6.4 INNOVATION AND PATENT ANALYSIS 
           TABLE 15 MAJOR PATENTS FOR URBAN AIR MOBILITY
    6.5 ROADMAP FOR URBAN AIR MOBILITY MARKET 
           FIGURE 22 DEVELOPMENT POTENTIAL OF URBAN AIR MOBILITY FROM 2010 ONWARDS
 
7 URBAN AIR MOBILITY MARKET, BY SOLUTION (Page No. - 93)
    7.1 INTRODUCTION 
           FIGURE 23 URBAN AIR MOBILITY MARKET, BY SOLUTION, 2023–2030 (USD MILLION)
           TABLE 16 URBAN AIR MOBILITY MARKET, BY SOLUTION, 2020–2022 (USD MILLION)
           TABLE 17 URBAN AIR MOBILITY MARKET, BY SOLUTION, 2023–2030 (USD MILLION)
    7.2 INFRASTRUCTURES 
           TABLE 18 URBAN AIR MOBILITY MARKET, BY INFRASTRUCTURES, 2020–2022 (USD MILLION)
           TABLE 19 URBAN AIR MOBILITY MARKET, BY INFRASTRUCTURES, 2023–2030 (USD MILLION)
           7.2.1 CHARGING STATIONS
                    7.2.1.1 Technological advancements to ensure effective charging
           7.2.2 VERTIPORTS
                    7.2.2.1 Construction of vertiports in small spaces to propel market
           7.2.3 AIR TRAFFIC MANAGEMENT FACILITIES
                    7.2.3.1 Need for management of air traffic in urban spaces to promote demand
           7.2.4 MAINTENANCE FACILITIES
                    7.2.4.1 Need for on-site maintenance to impel development of maintenance facilities
    7.3 PLATFORMS 
           TABLE 20 URBAN AIR MOBILITY MARKET, BY PLATFORMS, 2020–2022 (USD MILLION)
           TABLE 21 URBAN AIR MOBILITY MARKET, BY PLATFORMS, 2023–2030 (USD MILLION)
           7.3.1 AEROSTRUCTURES
                    7.3.1.1 Need for modern aircraft to increase demand for aerostructures
           7.3.2 AVIONICS
                    TABLE 22 URBAN AIR MOBILITY MARKET, BY AVIONICS, 2020–2022 (USD MILLION)
                    TABLE 23 URBAN AIR MOBILITY MARKET, BY AVIONICS, 2023–2030 (USD MILLION)
                    7.3.2.1 Flight control systems
                               7.3.2.1.1 Need for improved automation capabilities
                    7.3.2.2 Navigation systems
                               7.3.2.2.1 Need to prevent collision with other vehicles
                    7.3.2.3 Communications systems
                               7.3.2.3.1 Need for robust ground-based infrastructure
                    7.3.2.4 Sensors
                               7.3.2.4.1 Need for efficient navigation information
                                            TABLE 24 URBAN AIR MOBILITY MARKET, BY SENSORS, 2020–2022 (USD MILLION)
                                            TABLE 25 URBAN AIR MOBILITY MARKET, BY SENSORS, 2023–2030 (USD MILLION)
                               7.3.2.4.2 Speed sensors
                               7.3.2.4.3 Light sensors
                               7.3.2.4.4 Proximity sensors
                               7.3.2.4.5 Position sensors
                               7.3.2.4.6 Temperature sensors
           7.3.3 PROPULSION SYSTEMS
                    TABLE 26 URBAN AIR MOBILITY MARKET, BY PROPULSION SYSTEMS, 2020–2022 (USD MILLION)
                    TABLE 27 URBAN AIR MOBILITY MARKET, BY PROPULSION SYSTEMS, 2023–2030 (USD MILLION)
                    7.3.3.1 Electric Batteries
                               7.3.3.1.1 Easy operability to drive electric propulsion systems
                    7.3.3.2 Solar cells
                               7.3.3.2.1 Durable power generation to drive solar cell propulsion systems
                    7.3.3.3 Fuel cells
                               7.3.3.3.1 Low emissions to drive fuel-cell propulsion systems
                    7.3.3.4 Hybrid electric
                               7.3.3.4.1 Enhanced aircraft performance to drive hybrid electric propulsion systems
                    7.3.3.5 Fuel-powered
                               7.3.3.5.1 Extended range and endurance to drive fuel-powered propulsion systems
           7.3.4 ELECTRICAL SYSTEMS
                    TABLE 28 URBAN AIR MOBILITY MARKET, BY ELECTRICAL SYSTEMS, 2020–2022 (USD MILLION)
                    TABLE 29 URBAN AIR MOBILITY MARKET, BY ELECTRICAL SYSTEMS, 2023–2030 (USD MILLION)
                    7.3.4.1 Generators
                               7.3.4.1.1 Demand for zero emissions to spur use of generators
                    7.3.4.2 Motors
                               7.3.4.2.1 Need for high power density to raise demand for motors
                    7.3.4.3 Electric actuators
                               7.3.4.3.1 Need for linear electromechanical-type motions to propel this segment
                    7.3.4.4 Electric pumps
                               7.3.4.4.1 Rigorous developments in more electric aircraft to generate demand for electric pumps
                    7.3.4.5 Distribution devices
                               7.3.4.5.1 Demand for reliable electrical power to boost market growth
           7.3.5 SOFTWARE
                    7.3.5.1 Advances in software to foster demand for urban air mobility
 
8 URBAN AIR MOBILITY MARKET, BY PLATFORM ARCHITECTURE (Page No. - 107)
    8.1 INTRODUCTION 
           FIGURE 24 URBAN AIR MOBILITY MARKET, BY PLATFORM ARCHITECTURE, 2023–2030 (USD MILLION)
           TABLE 30 URBAN AIR MOBILITY MARKET, BY PLATFORM ARCHITECTURE, 2020–2022 (USD MILLION)
           TABLE 31 URBAN AIR MOBILITY MARKET, BY PLATFORM ARCHITECTURE, 2023–2030 (USD MILLION)
    8.2 FIXED-WING 
           8.2.1 HIGH CAPACITY OF FIXED-WING AIRCRAFT TO SPUR THIS SEGMENT
    8.3 ROTARY-WING 
           8.3.1 HELICOPTERS
                    8.3.1.1 Ability to navigate in congested urban areas to raise demand for this segment
           8.3.2 MULTICOPTERS
                    8.3.2.1 Enhanced maneuverability and agility to support this segment
    8.4 FIXED-WING HYBRID 
           8.4.1 LIFT + CRUISE
                    8.4.1.1 Versatility and high speed to be key factors promoting growth
           8.4.2 VECTOR THRUST
                    8.4.2.1 Precise landing and optimal flight path to drive this segment
 
9 URBAN AIR MOBILITY MARKET, BY MOBILITY TYPE (Page No. - 112)
    9.1 INTRODUCTION 
           FIGURE 25 URBAN AIR MOBILITY MARKET, BY MOBILITY TYPE, 2023–2030 (USD MILLION)
           TABLE 32 URBAN AIR MOBILITY MARKET, BY MOBILITY TYPE, 2020–2022 (USD MILLION)
           TABLE 33 URBAN AIR MOBILITY MARKET, BY MOBILITY TYPE, 2023–2030 (USD MILLION)
    9.2 AIR TAXIS 
           9.2.1 RISE IN URBAN POPULATION TO RAISE DEMAND FOR AIR TAXIS
           9.2.2 MANNED TAXIS
           9.2.3 DRONE TAXIS
    9.3 AIR SHUTTLES & AIR METROS 
           9.3.1 ADVENT OF CUTTING-EDGE TECHNOLOGIES TO GENERATE DEMAND FOR AIR METROS
    9.4 PERSONAL AIR VEHICLES 
           9.4.1 PREFERENCE FOR SAFE AND CONVENIENT TRANSPORTATION TO SPUR THIS SEGMENT
    9.5 CARGO AIR VEHICLES 
           9.5.1 GROWING FOCUS ON LIGHT AND HEAVY CARGO FOR INTERCITY AND INTRACITY DELIVERIES TO FUEL MARKET
           9.5.2 FIRST-MILE DELIVERY
           9.5.3 MIDDLE-MILE DELIVERY
           9.5.4 LAST-MILE DELIVERY
    9.6 AIR AMBULANCES & MEDICAL EMERGENCY VEHICLES 
           9.6.1 GROWTH IN HEALTHCARE INDUSTRY TO DRIVE USE OF AIR AMBULANCES
 
10 URBAN AIR MOBILITY MARKET, BY END USER (Page No. - 117)
     10.1 INTRODUCTION 
             FIGURE 26 URBAN AIR MOBILITY MARKET, BY END USER, 2023–2030 (USD MILLION)
             TABLE 34 URBAN AIR MOBILITY MARKET, BY END USER, 2020–2022 (USD MILLION)
             TABLE 35 URBAN AIR MOBILITY MARKET, BY END USER, 2023–2030 (USD MILLION)
     10.2 RIDESHARING COMPANIES 
             10.2.1 INCREASED ACCESSIBILITY, AFFORDABILITY, AND EFFICIENCY TO ENCOURAGE RIDESHARING
     10.3 SCHEDULED OPERATORS 
             10.3.1 DEMAND FOR OPERATIONAL EFFICIENCY TO BOOST SEGMENT GROWTH
     10.4 E-COMMERCE COMPANIES 
             10.4.1 NEED FOR LAST-MILE DELIVERY TO INCREASE DEMAND FOR E-COMMERCE COMPANIES
     10.5 HOSPITALS & MEDICAL AGENCIES 
             10.5.1 EMERGENCE OF AIR AMBULANCES TO PROPEL THIS SEGMENT
     10.6 PRIVATE OPERATORS 
             10.6.1 GROWING INTEREST OF PRIVATE OPERATORS IN URBAN AIR MOBILITY TO DRIVE MARKET
 
11 URBAN AIR MOBILITY MARKET, BY PLATFORM OPERATION (Page No. - 122)
     11.1 INTRODUCTION 
             FIGURE 27 URBAN AIR MOBILITY MARKET, BY PLATFORM OPERATION, 2023–2030 (USD MILLION)
             TABLE 36 URBAN AIR MOBILITY MARKET, BY PLATFORM OPERATION, 2020–2022 (USD MILLION)
             TABLE 37 URBAN AIR MOBILITY MARKET, BY PLATFORM OPERATION, 2023–2030 (USD MILLION)
     11.2 PILOTED 
             11.2.1 NEED FOR REAL-TIME DECISION-MAKING TO AMPLIFY MARKET DEMAND
     11.3 AUTONOMOUS 
             11.3.1 REMOTELY PILOTED
                        11.3.1.1 Enhanced safety of piloted aircraft to increase its demand
             11.3.2 FULLY AUTONOMOUS
                        11.3.2.1 Integration of AI and ML to boost this segment
 
12 URBAN AIR MOBILITY MARKET, BY RANGE (Page No. - 126)
     12.1 INTRODUCTION 
             FIGURE 28 URBAN AIR MOBILITY MARKET, BY RANGE, 2023–2030 (USD MILLION)
             TABLE 38 URBAN AIR MOBILITY MARKET, BY RANGE, 2020–2022 (USD MILLION)
             TABLE 39 URBAN AIR MOBILITY MARKET, BY RANGE, 2023–2030 (USD MILLION)
     12.2 INTERCITY (>100 KM) 
             12.2.1 DEVELOPMENTS IN BATTERY TECHNOLOGIES TO STRENGTHEN INTERCITY URBAN AIR MOBILITY
     12.3 INTRACITY (<100 KM) 
             12.3.1 NEED FOR CARGO DELIVERY TO SPUR DEMAND FOR INTRACITY TRANSPORTATION
 
13 URBAN AIR MOBILITY MARKET, BY REGION (Page No. - 129)
     13.1 INTRODUCTION 
             FIGURE 29 NORTH AMERICA TO ACCOUNT FOR LARGEST SHARE OF URBAN AIR MOBILITY MARKET IN 2023
             TABLE 40 URBAN AIR MOBILITY MARKET, BY REGION, 2020–2022 (USD MILLION)
             TABLE 41 URBAN AIR MOBILITY MARKET, BY REGION, 2023–2030 (USD MILLION)
     13.2 NORTH AMERICA 
             13.2.1 RECESSION IMPACT ANALYSIS
             13.2.2 PESTLE ANALYSIS
                        FIGURE 30 NORTH AMERICA: URBAN AIR MOBILITY MARKET SNAPSHOT
                        TABLE 42 NORTH AMERICA: URBAN AIR MOBILITY MARKET, BY COUNTRY, 2020–2022 (USD MILLION)
                        TABLE 43 NORTH AMERICA: URBAN AIR MOBILITY MARKET, BY COUNTRY, 2023–2030 (USD MILLION)
                        TABLE 44 NORTH AMERICA: URBAN AIR MOBILITY MARKET, BY SOLUTION, 2020–2022 (USD MILLION)
                        TABLE 45 NORTH AMERICA: URBAN AIR MOBILITY MARKET, BY SOLUTION, 2023–2030 (USD MILLION)
                        TABLE 46 NORTH AMERICA: URBAN AIR MOBILITY MARKET, BY MOBILITY TYPE, 2020–2022 (USD MILLION)
                        TABLE 47 NORTH AMERICA: URBAN AIR MOBILITY MARKET, BY MOBILITY TYPE, 2023–2030 (USD MILLION)
                        TABLE 48 NORTH AMERICA: URBAN AIR MOBILITY MARKET, BY PLATFORM OPERATION, 2020–2022 (USD MILLION)
                        TABLE 49 NORTH AMERICA: URBAN AIR MOBILITY MARKET, BY PLATFORM OPERATION, 2023–2030 (USD MILLION)
                        TABLE 50 NORTH AMERICA: URBAN AIR MOBILITY MARKET, BY RANGE, 2020–2022 (USD MILLION)
                        TABLE 51 NORTH AMERICA: URBAN AIR MOBILITY MARKET, BY RANGE, 2023–2030 (USD MILLION)
                        TABLE 52 NORTH AMERICA: URBAN AIR MOBILITY MARKET, BY END USER, 2020–2022 (USD MILLION)
                        TABLE 53 NORTH AMERICA: URBAN AIR MOBILITY MARKET, BY END USER, 2023–2030 (USD MILLION)
             13.2.3 US
                        13.2.3.1 Presence of leading players to drive demand
                                     TABLE 54 US: URBAN AIR MOBILITY MARKET, BY SOLUTION, 2020–2022 (USD MILLION)
                                     TABLE 55 US: URBAN AIR MOBILITY MARKET, BY SOLUTION, 2023–2030 (USD MILLION)
                                     TABLE 56 US: URBAN AIR MOBILITY MARKET, BY PLATFORM OPERATION, 2020–2022 (USD MILLION)
                                     TABLE 57 US: URBAN AIR MOBILITY MARKET, BY PLATFORM OPERATION, 2023–2030 (USD MILLION)
                                     TABLE 58 US: URBAN AIR MOBILITY MARKET, BY RANGE, 2020–2022 (USD MILLION)
                                     TABLE 59 US: URBAN AIR MOBILITY MARKET, BY RANGE, 2023–2030 (USD MILLION)
             13.2.4 CANADA
                        13.2.4.1 CAAM to support commercialization of drones and air taxis
                                     TABLE 60 CANADA: URBAN AIR MOBILITY MARKET, BY SOLUTION, 2020–2022 (USD MILLION)
                                     TABLE 61 CANADA: URBAN AIR MOBILITY MARKET, BY SOLUTION, 2023–2030 (USD MILLION)
                                     TABLE 62 CANADA: URBAN AIR MOBILITY MARKET, BY PLATFORM OPERATION, 2020–2022 (USD MILLION)
                                     TABLE 63 CANADA: URBAN AIR MOBILITY MARKET, BY PLATFORM OPERATION, 2023–2030 (USD MILLION)
                                     TABLE 64 CANADA: URBAN AIR MOBILITY MARKET, BY RANGE, 2020–2022 (USD MILLION)
                                     TABLE 65 CANADA: URBAN AIR MOBILITY MARKET, BY RANGE, 2023–2030 (USD MILLION)
     13.3 EUROPE 
             13.3.1 RECESSION IMPACT ANALYSIS
             13.3.2 PESTLE ANALYSIS
                        FIGURE 31 EUROPE: URBAN AIR MOBILITY MARKET SNAPSHOT
                        TABLE 66 EUROPE: URBAN AIR MOBILITY MARKET, BY COUNTRY, 2020–2022 (USD MILLION)
                        TABLE 67 EUROPE: URBAN AIR MOBILITY MARKET, BY COUNTRY, 2023–2030 (USD MILLION)
                        TABLE 68 EUROPE: URBAN AIR MOBILITY MARKET, BY SOLUTION, 2020–2022 (USD MILLION)
                        TABLE 69 EUROPE: URBAN AIR MOBILITY MARKET, BY SOLUTION, 2023–2030 (USD MILLION)
                        TABLE 70 EUROPE: URBAN AIR MOBILITY MARKET, BY MOBILITY TYPE, 2020–2022 (USD MILLION)
                        TABLE 71 EUROPE: URBAN AIR MOBILITY MARKET, BY MOBILITY TYPE, 2023–2030 (USD MILLION)
                        TABLE 72 EUROPE: URBAN AIR MOBILITY MARKET, BY PLATFORM OPERATION, 2020–2022 (USD MILLION)
                        TABLE 73 EUROPE: URBAN AIR MOBILITY MARKET, BY PLATFORM OPERATION, 2023–2030 (USD MILLION)
                        TABLE 74 EUROPE: URBAN AIR MOBILITY MARKET, BY RANGE, 2020–2022 (USD MILLION)
                        TABLE 75 EUROPE: URBAN AIR MOBILITY MARKET, BY RANGE, 2023–2030 (USD MILLION)
                        TABLE 76 EUROPE: URBAN AIR MOBILITY MARKET, BY END USER, 2020–2022 (USD MILLION)
                        TABLE 77 EUROPE: URBAN AIR MOBILITY MARKET, BY END USER, 2023–2030 (USD MILLION)
             13.3.3 UK
                        13.3.3.1 Technological advancements in UAV to drive market
                                     TABLE 78 UK: URBAN AIR MOBILITY MARKET, BY SOLUTION, 2020–2022 (USD MILLION)
                                     TABLE 79 UK: URBAN AIR MOBILITY MARKET, BY SOLUTION, 2023–2030 (USD MILLION)
                                     TABLE 80 UK: URBAN AIR MOBILITY MARKET, BY PLATFORM OPERATION, 2020–2022 (USD MILLION)
                                     TABLE 81 UK: URBAN AIR MOBILITY MARKET, BY PLATFORM OPERATION, 2023–2030 (USD MILLION)
                                     TABLE 82 UK: URBAN AIR MOBILITY MARKET, BY RANGE, 2020–2022 (USD MILLION)
                                     TABLE 83 UK: URBAN AIR MOBILITY MARKET, BY RANGE, 2023–2030 (USD MILLION)
             13.3.4 FRANCE
                        13.3.4.1 Government programs to aid in development of UAM capabilities
                                     TABLE 84 FRANCE: URBAN AIR MOBILITY MARKET, BY SOLUTION, 2020–2022 (USD MILLION)
                                     TABLE 85 FRANCE: URBAN AIR MOBILITY MARKET, BY SOLUTION, 2023–2030 (USD MILLION)
                                     TABLE 86 FRANCE: URBAN AIR MOBILITY MARKET, BY PLATFORM OPERATION, 2020–2022 (USD MILLION)
                                     TABLE 87 FRANCE: URBAN AIR MOBILITY MARKET, BY PLATFORM OPERATION, 2023–2030 (USD MILLION)
                                     TABLE 88 FRANCE: URBAN AIR MOBILITY MARKET, BY RANGE, 2020–2022 (USD MILLION)
                                     TABLE 89 FRANCE: URBAN AIR MOBILITY MARKET, BY RANGE, 2023–2030 (USD MILLION)
             13.3.5 GERMANY
                        13.3.5.1 Increasing investments in R&D to drive market
                                     TABLE 90 GERMANY: URBAN AIR MOBILITY MARKET, BY SOLUTION, 2020–2022 (USD MILLION)
                                     TABLE 91 GERMANY: URBAN AIR MOBILITY MARKET, BY SOLUTION, 2023–2030 (USD MILLION)
                                     TABLE 92 GERMANY: URBAN AIR MOBILITY MARKET, BY PLATFORM OPERATION, 2020–2022 (USD MILLION)
                                     TABLE 93 GERMANY: URBAN AIR MOBILITY MARKET, BY PLATFORM OPERATION, 2023–2030 (USD MILLION)
                                     TABLE 94 GERMANY: URBAN AIR MOBILITY MARKET, BY RANGE, 2020–2022 (USD MILLION)
                                     TABLE 95 GERMANY: URBAN AIR MOBILITY MARKET, BY RANGE, 2023–2030 (USD MILLION)
             13.3.6 ITALY
                        13.3.6.1 Airbus and ITA Airways to join forces for tailored UAM services
                                     TABLE 96 ITALY: URBAN AIR MOBILITY MARKET, BY SOLUTION, 2020–2022 (USD MILLION)
                                     TABLE 97 ITALY: URBAN AIR MOBILITY MARKET, BY SOLUTION, 2023–2030 (USD MILLION)
                                     TABLE 98 ITALY: URBAN AIR MOBILITY MARKET, BY PLATFORM OPERATION, 2020–2022 (USD MILLION)
                                     TABLE 99 ITALY: URBAN AIR MOBILITY MARKET, BY PLATFORM OPERATION, 2023–2030 (USD MILLION)
                                     TABLE 100 ITALY: URBAN AIR MOBILITY MARKET, BY RANGE, 2020–2022 (USD MILLION)
                                     TABLE 101 ITALY: URBAN AIR MOBILITY MARKET, BY RANGE, 2023–2030 (USD MILLION)
             13.3.7 SWITZERLAND
                        13.3.7.1 Development of inter-hospital drone delivery network for time-critical medical supplies to boost market
                                     TABLE 102 SWITZERLAND: URBAN AIR MOBILITY MARKET, BY SOLUTION, 2020–2022 (USD MILLION)
                                     TABLE 103 SWITZERLAND: URBAN AIR MOBILITY MARKET, BY SOLUTION, 2023–2030 (USD MILLION)
                                     TABLE 104 SWITZERLAND: URBAN AIR MOBILITY MARKET, BY PLATFORM OPERATION, 2020–2022 (USD MILLION)
                                     TABLE 105 SWITZERLAND: URBAN AIR MOBILITY MARKET, BY PLATFORM OPERATION, 2023–2030 (USD MILLION)
                                     TABLE 106 SWITZERLAND: URBAN AIR MOBILITY MARKET, BY RANGE, 2020–2022 (USD MILLION)
                                     TABLE 107 SWITZERLAND: URBAN AIR MOBILITY MARKET, BY RANGE, 2023–2030 (USD MILLION)
             13.3.8 REST OF EUROPE
                        TABLE 108 REST OF EUROPE: URBAN AIR MOBILITY MARKET, BY SOLUTION, 2020–2022 (USD MILLION)
                        TABLE 109 REST OF EUROPE: URBAN AIR MOBILITY MARKET, BY SOLUTION, 2023–2030 (USD MILLION)
                        TABLE 110 REST OF EUROPE: URBAN AIR MOBILITY MARKET, BY PLATFORM OPERATION, 2020–2022 (USD MILLION)
                        TABLE 111 REST OF EUROPE: URBAN AIR MOBILITY MARKET, BY PLATFORM OPERATION, 2023–2030 (USD MILLION)
                        TABLE 112 REST OF EUROPE: URBAN AIR MOBILITY MARKET, BY RANGE, 2020–2022 (USD MILLION)
                        TABLE 113 REST OF EUROPE: URBAN AIR MOBILITY MARKET, BY RANGE, 2023–2030 (USD MILLION)
     13.4 ASIA PACIFIC 
             13.4.1 RECESSION IMPACT ANALYSIS
             13.4.2 PESTLE ANALYSIS
                        FIGURE 32 ASIA PACIFIC: URBAN AIR MOBILITY MARKET SNAPSHOT
                        TABLE 114 ASIA PACIFIC: URBAN AIR MOBILITY MARKET, BY COUNTRY, 2020–2022 (USD MILLION)
                        TABLE 115 ASIA PACIFIC: URBAN AIR MOBILITY MARKET, BY COUNTRY, 2023–2030 (USD MILLION)
                        TABLE 116 ASIA PACIFIC: URBAN AIR MOBILITY MARKET, BY MOBILITY TYPE, 2020–2022 (USD MILLION)
                        TABLE 117 ASIA PACIFIC: URBAN AIR MOBILITY MARKET, BY MOBILITY TYPE, 2023–2030 (USD MILLION)
                        TABLE 118 ASIA PACIFIC: URBAN AIR MOBILITY MARKET, BY SOLUTION, 2020–2022 (USD MILLION)
                        TABLE 119 ASIA PACIFIC: URBAN AIR MOBILITY MARKET, BY SOLUTION, 2023–2030 (USD MILLION)
                        TABLE 120 ASIA PACIFIC: URBAN AIR MOBILITY MARKET, BY PLATFORM OPERATION, 2020–2022 (USD MILLION)
                        TABLE 121 ASIA PACIFIC: URBAN AIR MOBILITY MARKET, BY PLATFORM OPERATION, 2023–2030 (USD MILLION)
                        TABLE 122 ASIA PACIFIC: URBAN AIR MOBILITY MARKET, BY RANGE, 2020–2022 (USD MILLION)
                        TABLE 123 ASIA PACIFIC: URBAN AIR MOBILITY MARKET, BY RANGE, 2023–2030 (USD MILLION)
                        TABLE 124 ASIA PACIFIC: URBAN AIR MOBILITY MARKET, BY END USER, 2020–2022 (USD MILLION)
                        TABLE 125 ASIA PACIFIC: URBAN AIR MOBILITY MARKET, BY END USER, 2023–2030 (USD MILLION)
             13.4.3 CHINA
                        13.4.3.1 Strategic planning and standard formulation for UAM to drive market
                                     TABLE 126 CHINA: URBAN AIR MOBILITY MARKET, BY SOLUTION, 2020–2022 (USD MILLION)
                                     TABLE 127 CHINA: URBAN AIR MOBILITY MARKET, BY SOLUTION, 2023–2030 (USD MILLION)
                                     TABLE 128 CHINA: URBAN AIR MOBILITY MARKET, BY PLATFORM OPERATION, 2020–2022 (USD MILLION)
                                     TABLE 129 CHINA: URBAN AIR MOBILITY MARKET, BY PLATFORM OPERATION, 2023–2030 (USD MILLION)
                                     TABLE 130 CHINA: URBAN AIR MOBILITY MARKET, BY RANGE, 2020–2022 (USD MILLION)
                                     TABLE 131 CHINA: URBAN AIR MOBILITY MARKET, BY RANGE, 2023–2030 (USD MILLION)
             13.4.4 INDIA
                        13.4.4.1 Growing population and road traffic congestion to boost market
                                     TABLE 132 INDIA: URBAN AIR MOBILITY MARKET, BY SOLUTION, 2020–2022 (USD MILLION)
                                     TABLE 133 INDIA: URBAN AIR MOBILITY MARKET, BY SOLUTION, 2023–2030 (USD MILLION)
                                     TABLE 134 INDIA: URBAN AIR MOBILITY MARKET, BY PLATFORM OPERATION, 2020–2022 (USD MILLION)
                                     TABLE 135 INDIA: URBAN AIR MOBILITY MARKET, BY PLATFORM OPERATION, 2023–2030 (USD MILLION)
                                     TABLE 136 INDIA: URBAN AIR MOBILITY MARKET, BY RANGE, 2020–2022 (USD MILLION)
                                     TABLE 137 INDIA: URBAN AIR MOBILITY MARKET, BY RANGE, 2023–2030 (USD MILLION)
             13.4.5 JAPAN
                        13.4.5.1 Diversification of commercial operations to drive market
                                     TABLE 138 JAPAN: URBAN AIR MOBILITY MARKET, BY SOLUTION, 2020–2022 (USD MILLION)
                                     TABLE 139 JAPAN: URBAN AIR MOBILITY MARKET, BY SOLUTION, 2023–2030 (USD MILLION)
                                     TABLE 140 JAPAN: URBAN AIR MOBILITY MARKET, BY PLATFORM OPERATION, 2020–2022 (USD MILLION)
                                     TABLE 141 JAPAN: URBAN AIR MOBILITY MARKET, BY PLATFORM OPERATION, 2023–2030 (USD MILLION)
                                     TABLE 142 JAPAN: URBAN AIR MOBILITY MARKET, BY RANGE, 2020–2022 (USD MILLION)
                                     TABLE 143 JAPAN: URBAN AIR MOBILITY MARKET, BY RANGE, 2023–2030 (USD MILLION)
             13.4.6 AUSTRALIA
                        13.4.6.1 Demand for cargo drones in medical supplies and food delivery services to propel market
                                     TABLE 144 AUSTRALIA: URBAN AIR MOBILITY MARKET, BY SOLUTION, 2020–2022 (USD MILLION)
                                     TABLE 145 AUSTRALIA: URBAN AIR MOBILITY MARKET, BY SOLUTION, 2023–2030 (USD MILLION)
                                     TABLE 146 AUSTRALIA: URBAN AIR MOBILITY MARKET, BY PLATFORM OPERATION, 2020–2022 (USD MILLION)
                                     TABLE 147 AUSTRALIA: URBAN AIR MOBILITY MARKET, BY PLATFORM OPERATION, 2023–2030 (USD MILLION)
                                     TABLE 148 AUSTRALIA: URBAN AIR MOBILITY MARKET, BY RANGE, 2020–2022 (USD MILLION)
                                     TABLE 149 AUSTRALIA: URBAN AIR MOBILITY MARKET, BY RANGE, 2023–2030 (USD MILLION)
             13.4.7 SOUTH KOREA
                        13.4.7.1 Launch of air taxi services by 2025 to favor market growth
                                     TABLE 150 SOUTH KOREA: URBAN AIR MOBILITY MARKET, BY SOLUTION, 2020–2022 (USD MILLION)
                                     TABLE 151 SOUTH KOREA: URBAN AIR MOBILITY MARKET, BY SOLUTION, 2023–2030 (USD MILLION)
                                     TABLE 152 SOUTH KOREA: URBAN AIR MOBILITY MARKET, BY PLATFORM OPERATION, 2020–2022 (USD MILLION)
                                     TABLE 153 SOUTH KOREA: URBAN AIR MOBILITY MARKET, BY PLATFORM OPERATION, 2023–2030 (USD MILLION)
                                     TABLE 154 SOUTH KOREA: URBAN AIR MOBILITY MARKET, BY RANGE, 2020–2022 (USD MILLION)
                                     TABLE 155 SOUTH KOREA: URBAN AIR MOBILITY MARKET, BY RANGE, 2023–2030 (USD MILLION)
             13.4.8 REST OF ASIA PACIFIC
                        TABLE 156 REST OF ASIA PACIFIC: URBAN AIR MOBILITY MARKET, BY SOLUTION, 2020–2022 (USD MILLION)
                        TABLE 157 REST OF ASIA PACIFIC: URBAN AIR MOBILITY MARKET, BY SOLUTION, 2023–2030 (USD MILLION)
                        TABLE 158 REST OF ASIA PACIFIC: URBAN AIR MOBILITY MARKET, BY PLATFORM OPERATION, 2020–2022 (USD MILLION)
                        TABLE 159 REST OF ASIA PACIFIC: URBAN AIR MOBILITY MARKET, BY PLATFORM OPERATION, 2023–2030 (USD MILLION)
                        TABLE 160 REST OF ASIA PACIFIC: URBAN AIR MOBILITY MARKET, BY RANGE, 2020–2022 (USD MILLION)
                        TABLE 161 REST OF ASIA PACIFIC: URBAN AIR MOBILITY MARKET, BY RANGE, 2023–2030 (USD MILLION)
     13.5 LATIN AMERICA 
             13.5.1 RECESSION IMPACT ANALYSIS
             13.5.2 PESTLE ANALYSIS
                        FIGURE 33 LATIN AMERICA: URBAN AIR MOBILITY MARKET SNAPSHOT
                        TABLE 162 LATIN AMERICA: URBAN AIR MOBILITY MARKET, BY COUNTRY, 2020–2022 (USD MILLION)
                        TABLE 163 LATIN AMERICA: URBAN AIR MOBILITY MARKET, BY COUNTRY, 2023–2030 (USD MILLION)
                        TABLE 164 LATIN AMERICA: URBAN AIR MOBILITY MARKET, BY MOBILITY TYPE, 2020–2022 (USD MILLION)
                        TABLE 165 LATIN AMERICA: URBAN AIR MOBILITY MARKET, BY MOBILITY TYPE, 2023–2030 (USD MILLION)
                        TABLE 166 LATIN AMERICA: URBAN AIR MOBILITY MARKET, BY SOLUTION, 2020–2022 (USD MILLION)
                        TABLE 167 LATIN AMERICA: URBAN AIR MOBILITY MARKET, BY SOLUTION, 2023–2030 (USD MILLION)
                        TABLE 168 LATIN AMERICA: URBAN AIR MOBILITY MARKET, BY PLATFORM OPERATION, 2020–2022 (USD MILLION)
                        TABLE 169 LATIN AMERICA: URBAN AIR MOBILITY MARKET, BY PLATFORM OPERATION, 2023–2030 (USD MILLION)
                        TABLE 170 LATIN AMERICA: URBAN AIR MOBILITY MARKET, BY RANGE, 2020–2022 (USD MILLION)
                        TABLE 171 LATIN AMERICA: URBAN AIR MOBILITY MARKET, BY RANGE, 2023–2030 (USD MILLION)
                        TABLE 172 LATIN AMERICA: URBAN AIR MOBILITY MARKET, BY END USER, 2020–2022 (USD MILLION)
                        TABLE 173 LATIN AMERICA: URBAN AIR MOBILITY MARKET, BY END USER, 2023–2030 (USD MILLION)
             13.5.3 BRAZIL
                        13.5.3.1 Intercity and intracity air taxi services by Airbus to support market
                                     TABLE 174 BRAZIL: URBAN AIR MOBILITY MARKET, BY SOLUTION, 2020–2022 (USD MILLION)
                                     TABLE 175 BRAZIL: URBAN AIR MOBILITY MARKET, BY SOLUTION, 2023–2030 (USD MILLION)
                                     TABLE 176 BRAZIL: URBAN AIR MOBILITY MARKET, BY PLATFORM OPERATION, 2020–2022 (USD MILLION)
                                     TABLE 177 BRAZIL: URBAN AIR MOBILITY MARKET, BY PLATFORM OPERATION, 2023–2030 (USD MILLION)
                                     TABLE 178 BRAZIL: URBAN AIR MOBILITY MARKET, BY RANGE, 2020–2022 (USD MILLION)
                                     TABLE 179 BRAZIL: URBAN AIR MOBILITY MARKET, BY RANGE, 2023–2030 (USD MILLION)
             13.5.4 MEXICO
                        13.5.4.1 Pioneering efforts by Airbus for enhanced and sustainable UAM to drive market
                                     TABLE 180 MEXICO: URBAN AIR MOBILITY MARKET, BY SOLUTION, 2020–2022 (USD MILLION)
                                     TABLE 181 MEXICO: URBAN AIR MOBILITY MARKET, BY SOLUTION, 2023–2030 (USD MILLION)
                                     TABLE 182 MEXICO: URBAN AIR MOBILITY MARKET, BY PLATFORM OPERATION, 2020–2022 (USD MILLION)
                                     TABLE 183 MEXICO: URBAN AIR MOBILITY MARKET, BY PLATFORM OPERATION, 2023–2030 (USD MILLION)
                                     TABLE 184 MEXICO: URBAN AIR MOBILITY MARKET, BY RANGE, 2020–2022 (USD MILLION)
                                     TABLE 185 MEXICO: URBAN AIR MOBILITY MARKET, BY RANGE, 2023–2030 (USD MILLION)
             13.5.5 REST OF LATIN AMERICA
                        TABLE 186 REST OF LATIN AMERICA: URBAN AIR MOBILITY MARKET, BY SOLUTION, 2020–2022 (USD MILLION)
                        TABLE 187 REST OF LATIN AMERICA: URBAN AIR MOBILITY MARKET, BY SOLUTION, 2023–2030 (USD MILLION)
                        TABLE 188 REST OF LATIN AMERICA: URBAN AIR MOBILITY MARKET, BY PLATFORM OPERATION, 2020–2022 (USD MILLION)
                        TABLE 189 REST OF LATIN AMERICA: URBAN AIR MOBILITY MARKET, BY PLATFORM OPERATION, 2023–2030 (USD MILLION)
                        TABLE 190 REST OF LATIN AMERICA: URBAN AIR MOBILITY MARKET, BY RANGE, 2020–2022 (USD MILLION)
                        TABLE 191 REST OF LATIN AMERICA: URBAN AIR MOBILITY MARKET, BY RANGE, 2023–2030 (USD MILLION)
     13.6 ROW 
             13.6.1 RECESSION IMPACT ANALYSIS
                        FIGURE 34 ROW: URBAN AIR MOBILITY MARKET SNAPSHOT
                        TABLE 192 ROW: URBAN AIR MOBILITY MARKET, BY REGION, 2020–2022 (USD MILLION)
                        TABLE 193 ROW: URBAN AIR MOBILITY MARKET, BY REGION, 2023–2030 (USD MILLION)
                        TABLE 194 ROW: URBAN AIR MOBILITY MARKET, BY SOLUTION, 2020–2022 (USD MILLION)
                        TABLE 195 ROW: URBAN AIR MOBILITY MARKET, BY SOLUTION, 2023–2030 (USD MILLION)
                        TABLE 196 ROW: URBAN AIR MOBILITY MARKET, BY MOBILITY TYPE, 2020–2022 (USD MILLION)
                        TABLE 197 ROW: URBAN AIR MOBILITY MARKET, BY MOBILITY TYPE, 2023–2030 (USD MILLION)
                        TABLE 198 ROW: URBAN AIR MOBILITY MARKET, BY PLATFORM OPERATION, 2020–2022 (USD MILLION)
                        TABLE 199 ROW: URBAN AIR MOBILITY MARKET, BY PLATFORM OPERATION, 2023–2030 (USD MILLION)
                        TABLE 200 ROW: URBAN AIR MOBILITY MARKET, BY RANGE, 2020–2022 (USD MILLION)
                        TABLE 201 ROW: URBAN AIR MOBILITY MARKET, BY RANGE, 2023–2030 (USD MILLION)
                        TABLE 202 ROW: URBAN AIR MOBILITY MARKET, BY END USER, 2020–2022 (USD MILLION)
                        TABLE 203 ROW: URBAN AIR MOBILITY MARKET, BY END USER, 2023–2030 (USD MILLION)
             13.6.2 MIDDLE EAST
                        13.6.2.1 Airport expansions to drive market
                                     TABLE 204 MIDDLE EAST: URBAN AIR MOBILITY MARKET, BY SOLUTION, 2020–2022 (USD MILLION)
                                     TABLE 205 MIDDLE EAST: URBAN AIR MOBILITY MARKET, BY SOLUTION, 2023–2030 (USD MILLION)
                                     TABLE 206 MIDDLE EAST: URBAN AIR MOBILITY MARKET, BY PLATFORM OPERATION, 2020–2022 (USD MILLION)
                                     TABLE 207 MIDDLE EAST: URBAN AIR MOBILITY MARKET, BY PLATFORM OPERATION, 2023–2030 (USD MILLION)
                                     TABLE 208 MIDDLE EAST: URBAN AIR MOBILITY MARKET, BY RANGE, 2020–2022 (USD MILLION)
                                     TABLE 209 MIDDLE EAST: URBAN AIR MOBILITY MARKET, BY RANGE, 2023–2030 (USD MILLION)
             13.6.3 AFRICA
                        13.6.3.1 Emergency medical services to boost market
                                     TABLE 210 AFRICA: URBAN AIR MOBILITY MARKET, BY SOLUTION, 2020–2022 (USD MILLION)
                                     TABLE 211 AFRICA: URBAN AIR MOBILITY MARKET, BY SOLUTION, 2023–2030 (USD MILLION)
                                     TABLE 212 AFRICA: URBAN AIR MOBILITY MARKET, BY PLATFORM OPERATION, 2020–2022 (USD MILLION)
                                     TABLE 213 AFRICA: URBAN AIR MOBILITY MARKET, BY PLATFORM OPERATION, 2023–2030 (USD MILLION)
                                     TABLE 214 AFRICA: URBAN AIR MOBILITY MARKET, BY RANGE, 2020–2022 (USD MILLION)
                                     TABLE 215 AFRICA: URBAN AIR MOBILITY MARKET, BY RANGE, 2023–2030 (USD MILLION)
 
14 COMPETITIVE LANDSCAPE (Page No. - 190)
     14.1 INTRODUCTION 
             TABLE 216 KEY DEVELOPMENTS BY LEADING PLAYERS IN URBAN AIR MOBILITY MARKET, 2022–2023
     14.2 RANKING ANALYSIS, 2022 
             FIGURE 35 MARKET RANKING OF TOP FIVE PLAYERS, 2022
     14.3 REVENUE ANALYSIS, 2022 
             FIGURE 36 REVENUE ANALYSIS OF TOP FIVE PLAYERS, 2022
     14.4 MARKET SHARE ANALYSIS, 2022 
             FIGURE 37 MARKET SHARE OF TOP FIVE PLAYERS, 2022
             TABLE 217 URBAN AIR MOBILITY MARKET: DEGREE OF COMPETITION
     14.5 COMPANY EVALUATION MATRIX 
             14.5.1 STARS
             14.5.2 EMERGING LEADERS
             14.5.3 PERVASIVE PLAYERS
             14.5.4 PARTICIPANTS
                        FIGURE 38 KEY COMPANY EVALUATION MATRIX, 2022
             14.5.5 COMPANY FOOTPRINT
                        TABLE 218 COMPANY PRODUCT FOOTPRINT
                        TABLE 219 COMPANY SEGMENT FOOTPRINT
     14.6 START-UP/SME EVALUATION MATRIX 
             14.6.1 PROGRESSIVE COMPANIES
             14.6.2 RESPONSIVE COMPANIES
             14.6.3 DYNAMIC COMPANIES
             14.6.4 STARTING BLOCKS
                        FIGURE 39 START-UP/SME EVALUATION MATRIX, 2022
             14.6.5 COMPETITIVE BENCHMARKING
                        TABLE 220 LIST OF KEY START-UPS/SMES
                        TABLE 221 COMPETITIVE BENCHMARKING OF KEY START-UPS/SMES
     14.7 COMPETITIVE SCENARIO 
             14.7.1 DEALS
                        TABLE 222 URBAN AIR MOBILITY MARKET: DEALS, FEBRUARY 2021–MAY 2023
             14.7.2 OTHER DEALS/DEVELOPMENTS
                        TABLE 223 URBAN AIR MOBILITY MARKET: OTHER DEALS/DEVELOPMENTS, JANUARY 2021– MAY 2023
 
15 COMPANY PROFILES (Page No. - 223)
(Business Overview, Products Offered, Recent Developments, MnM View Right to win, Strategic choices made, Weaknesses and competitive threats) *  
     15.1 KEY PLAYERS 
             15.1.1 AIRBUS SE
                        TABLE 224 AIRBUS SE: BUSINESS OVERVIEW
                        FIGURE 40 AIRBUS SE: COMPANY SNAPSHOT
                        TABLE 225 AIRBUS SE: PRODUCTS/SOLUTIONS/SERVICES OFFERED
                        TABLE 226 AIRBUS SE: DEALS
             15.1.2 LILIUM AVIATION GMBH
                        TABLE 227 LILIUM AVIATION GMBH: BUSINESS OVERVIEW
                        FIGURE 41 LILIUM AVIATION GMBH: COMPANY SNAPSHOT
                        TABLE 228 LILIUM AVIATION GMBH: PRODUCTS/SOLUTIONS/SERVICES OFFERED
                        TABLE 229 LILIUM AVIATION GMBH: DEALS
             15.1.3 EHANG
                        TABLE 230 EHANG: BUSINESS OVERVIEW
                        FIGURE 42 EHANG: COMPANY SNAPSHOT
                        TABLE 231 EHANG: PRODUCTS/SOLUTIONS/SERVICES OFFERED
                        TABLE 232 EHANG: DEALS
             15.1.4 EVE HOLDING, INC.
                        TABLE 233 EVE HOLDING, INC.: BUSINESS OVERVIEW
                        FIGURE 43 EVE HOLDING, INC.: COMPANY SNAPSHOT
                        TABLE 234 EVE HOLDING, INC.: PRODUCTS/SOLUTIONS/SERVICES OFFERED
                        TABLE 235 EVE HOLDING, INC.: DEALS
             15.1.5 VERTICAL AEROSPACE
                        TABLE 236 VERTICAL AEROSPACE: BUSINESS OVERVIEW
                        FIGURE 44 VERTICAL AEROSPACE: COMPANY SNAPSHOT
                        TABLE 237 VERTICAL AEROSPACE: PRODUCTS/SOLUTIONS/SERVICES OFFERED
                        TABLE 238 VERTICAL AEROSPACE: DEALS
             15.1.6 TEXTRON INC.
                        TABLE 239 TEXTRON INC.: BUSINESS OVERVIEW
                        FIGURE 45 TEXTRON INC.: COMPANY SNAPSHOT
                        TABLE 240 TEXTRON INC.: PRODUCTS/SOLUTIONS/SERVICES OFFERED
                        TABLE 241 TEXTRON INC.: DEALS
             15.1.7 JOBY AVIATION, INC.
                        TABLE 242 JOBY AVIATION, INC.: BUSINESS OVERVIEW
                        FIGURE 46 JOBY AVIATION, INC.: COMPANY SNAPSHOT
                        TABLE 243 JOBY AVIATION, INC.: PRODUCTS/SOLUTIONS/SERVICES OFFERED
                        TABLE 244 JOBY AVIATION, INC.: DEALS
             15.1.8 FERROVIAL S.A.
                        TABLE 245 FERROVIAL S.A.: BUSINESS OVERVIEW
                        FIGURE 47 FERROVIAL S.A.: COMPANY SNAPSHOT
                        TABLE 246 FERROVIAL S.A.: PRODUCTS/SOLUTIONS/SERVICES OFFERED
                        TABLE 247 FERROVIAL S.A.: DEALS
             15.1.9 HYUNDAI MOTOR COMPANY
                        TABLE 248 HYUNDAI MOTOR COMPANY: BUSINESS OVERVIEW
                        FIGURE 48 HYUNDAI MOTOR COMPANY: COMPANY SNAPSHOT
                        TABLE 249 HYUNDAI MOTOR COMPANY: PRODUCTS/SOLUTIONS/SERVICES OFFERED
                        TABLE 250 HYUNDAI MOTOR COMPANY: DEALS
             15.1.10 ARCHER AVIATION INC.
                        TABLE 251 ARCHER AVIATION INC.: BUSINESS OVERVIEW
                        FIGURE 49 ARCHER AVIATION INC.: COMPANY SNAPSHOT
                        TABLE 252 ARCHER AVIATION INC.: PRODUCTS/SOLUTIONS/SERVICES OFFERED
                        TABLE 253 ARCHER AVIATION INC.: DEALS
             15.1.11 WISK AERO LLC
                        TABLE 254 WISK AERO LLC: BUSINESS OVERVIEW
                        TABLE 255 WISK AERO LLC: PRODUCTS/SOLUTIONS/SERVICES OFFERED
                        TABLE 256 WISK AERO LLC: DEALS
             15.1.12 AIRO GROUP HOLDINGS, INC.
                        TABLE 257 AIRO GROUP HOLDINGS, INC.: BUSINESS OVERVIEW
                        TABLE 258 AIRO GROUP HOLDINGS, INC.: PRODUCTS/SOLUTIONS/SERVICES OFFERED
                        TABLE 259 AIRO GROUP HOLDINGS, INC.: DEALS
             15.1.13 WINGCOPTER GMBH
                        TABLE 260 WINGCOPTER GMBH: BUSINESS OVERVIEW
                        TABLE 261 WINGCOPTER GMBH: PRODUCTS/SOLUTIONS/SERVICES OFFERED
                        TABLE 262 WINGCOPTER GMBH: DEALS
             15.1.14 BETA TECHNOLOGIES, INC.
                        TABLE 263 BETA TECHNOLOGIES, INC.: BUSINESS OVERVIEW
                        TABLE 264 BETA TECHNOLOGIES, INC.: PRODUCTS/SOLUTIONS/SERVICES OFFERED
                        TABLE 265 BETA TECHNOLOGIES, INC.: DEALS
             15.1.15 VOLOCOPTER GMBH
                        TABLE 266 VOLOCOPTER GMBH: BUSINESS OVERVIEW
                        TABLE 267 VOLOCOPTER GMBH: PRODUCTS/SOLUTIONS/SERVICES OFFERED
                        TABLE 268 VOLOCOPTER GMBH: DEALS
     15.2 OTHER PLAYERS 
             15.2.1 SKYPORTS LIMITED
                        TABLE 269 SKYPORTS LIMITED: COMPANY OVERVIEW
             15.2.2 SKYDRIVE INC.
                        TABLE 270 SKYDRIVE INC.: COMPANY OVERVIEW
             15.2.3 ELECTRA AERO, INC.
                        TABLE 271 ELECTRA AERO, INC.: COMPANY OVERVIEW
             15.2.4 AUTOFLIGHT LIMITED
                        TABLE 272 AUTOFLIGHT LIMITED: COMPANY OVERVIEW
             15.2.5 TRANSCEND AIR CORPORATION
                        TABLE 273 TRANSCEND AIR CORPORATION: COMPANY OVERVIEW
             15.2.6 OVERAIR, INC.
                        TABLE 274 OVERAIR, INC.: COMPANY OVERVIEW
             15.2.7 MANTA AIRCRAFT S.R.L.
                        TABLE 275 MANTA AIRCRAFT S.R.L.: COMPANY OVERVIEW
             15.2.8 PLANA
                        TABLE 276 PLANA: COMPANY OVERVIEW
             15.2.9 SKYFLY TECHNOLOGIES LTD.
                        TABLE 277 SKYFLY TECHNOLOGIES LTD.: COMPANY OVERVIEW
             15.2.10 AIR VEV LTD.
                        TABLE 278 AIR VEV LTD.: COMPANY OVERVIEW
*Details on Business Overview, Products Offered, Recent Developments, MnM View, Right to win, Strategic choices made, Weaknesses and competitive threats might not be captured in case of unlisted companies.  
 
16 APPENDIX (Page No. - 289)
     16.1 DISCUSSION GUIDE 
     16.2 KNOWLEDGESTORE: MARKETSANDMARKETS’ SUBSCRIPTION PORTAL 
     16.3 CUSTOMIZATION OPTIONS 
     16.4 RELATED REPORTS 
     16.5 AUTHOR DETAILS 


This research study used secondary sources, directories, and databases like D&B Hoovers, Bloomberg Businessweek, and Factiva to identify and collect information relevant to the urban air mobility market. Primary sources included industry experts from the core and related industries, preferred suppliers, manufacturers, solution providers, technology developers, alliances, and organizations related to all the segments of this industry’s value chain. All primary sources were interviewed to obtain and verify critical qualitative and quantitative information and assess prospects for the market's growth during the forecast period.

Secondary Research

The share of companies in the urban air mobility market was determined using secondary data made available through paid and unpaid sources and by analyzing their product portfolios. The companies were rated based on the performance and quality of their products. These data points were further validated by primary sources. Secondary sources that were referred to for this research study on the urban air mobility market included financial statements of companies offering and developing UAM products and solutions and information from various trade, business, and professional associations, among others. Secondary data was collected and analyzed to arrive at the overall size of the urban air mobility market, which was further validated by primary respondents.

Primary Research

Extensive primary research was conducted after obtaining information about the current scenario of the urban air mobility market through secondary research. Several primary interviews were conducted with market experts from the demand and supply sides across North America, Europe, Asia Pacific, Latin America, and RoW. This primary data was collected through questionnaires, emails, and telephonic interviews.

In the primary research process, various primary sources from both the supply and demand sides were interviewed to obtain qualitative and quantitative information on the market. The primary sources from the supply side included various industry experts, such as vice presidents, directors, regional managers, technology providers, product development teams, distributors, and end users.

Primary interviews were conducted to gather insights such as market statistics, data on revenue collected from the products & services, market breakdowns, market size estimations, market forecasting, and data triangulation. Primary research also helped in understanding the trends related to technology, application, platform, and region. Stakeholders from the demand side, such as CXOs, production managers, engineers, and installation teams of end users of UAM, were interviewed to understand the buyer’s perspective on the suppliers, products, service providers, and their current usage and future outlook of their business, which could affect the urban air mobility market.

Urban Air Mobility Market Size, and Share

To know about the assumptions considered for the study, download the pdf brochure

Market Size Estimation

The top-down and bottom-up approaches were used to estimate and validate the size of the urban air mobility market.  The research methodology that was used to estimate the size of the urban air mobility market includes the following details.

Key players in the urban air mobility market were identified through secondary research, and their market share was determined through primary and secondary research. This included a study of the annual and financial reports of the top market players and extensive interviews of leaders such as chief executive officers, directors, and marketing executives of the leading companies operating in the urban air mobility market.

All percentage shares, splits, and breakdowns were determined using secondary sources and were verified through primary sources. All possible parameters that affect the markets covered in this research study were accounted for, viewed in extensive detail, verified through primary research, and analyzed to obtain the final quantitative and qualitative data on the urban air mobility market. This data was consolidated, enhanced with detailed inputs, analyzed by MarketsandMarkets, and presented in this report.

Market size estimation methodology: Bottom-up Approach

Urban Air Mobility Market Size, and Bottom-up Approach

Market size estimation methodology: Top-Down Approach

Urban Air Mobility Market Size, and Top-Down Approach

Market Definition

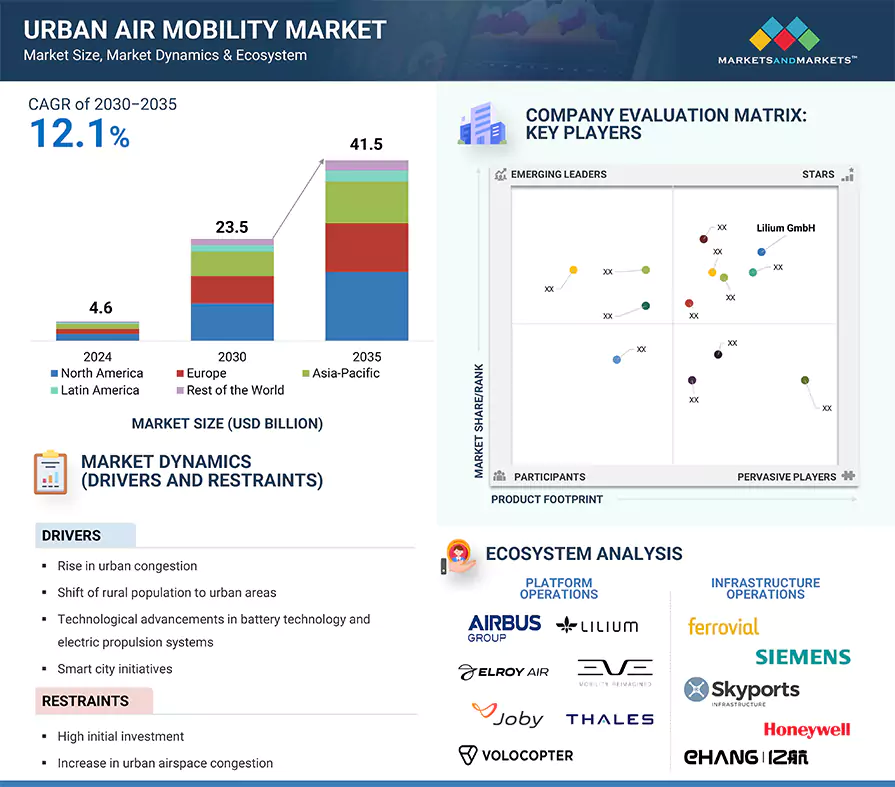
Urban air mobility (UAM) can be defined as an aerial mode of intracity or inter-city transportation of passengers and cargo using manned or electrical-unmanned aerial vehicles. This transportation is limited to 20 to 100 kilometers for intracity or 100 to 400 kilometers for intercity journeys. UAM, which offers a combination of onboard/ground-piloted and increasingly autonomous operations, is a safe and effective system for air passenger and cargo transport within an urban area, including small package delivery and other urban unmanned aerial system (UAS) services.

Key Stakeholders

  • UAM solution providers
  • UAM manufacturers
  • Subsystem manufacturers
  • Technology support providers
  • Logistics and transport solution providers
  • Regulatory authorities
  • Unmanned aircraft systems (UAS) software/hardware/service providers
  • Maintenance, repair, and overhaul (MRO) service providers

Objectives of the Study

  • To define, describe, and forecast the size of the urban air mobility market based on solution, platform operation, platform architecture, mobility type, range, end user, and region.
  • To understand the structure of the urban air mobility market by identifying its various segments and subsegments
  • To identify and analyze key drivers, restraints, opportunities, and challenges influencing market growth.
  • To provide an overview of the tariff and regulatory landscape for the adoption of urban air mobility as an alternate mode of mobility worldwide
  • To forecast the size of market segments across North America, Europe, Asia Pacific, Latin America, and the Rest of the World (RoW), along with major countries in each region
  • To identify transportation industry trends, market trends, and technology trends prevailing in the urban air mobility market
  • To analyze micro markets with respect to individual technological trends and their contribution to the total market
  • To analyze opportunities for stakeholders in the urban air mobility market by identifying key market trends
  • To profile key market players and comprehensively analyze their market share and core competencies.
  • To provide a detailed competitive landscape of the market, along with an analysis of business and strategies such as mergers & acquisitions, partnerships, agreements, and product launches in the urban air mobility market
  • To identify detailed financial positions, key products, and unique selling points of leading companies in the urban air mobility market

Available Customizations

MarketsandMarkets offers the following customizations for this market report:

  • Additional country-level analysis of the urban air mobility market
  • Profiling of additional market players (up to 5)

Product Analysis

  • Product matrix, which provides a detailed comparison of the product portfolio of each company in the urban air mobility market.
Custom Market Research Services

We will customize the research for you, in case the report listed above does not meet with your exact requirements. Our custom research will comprehensively cover the business information you require to help you arrive at strategic and profitable business decisions.

Request Customization

Instant Answers with GPT - Ask Now!

Ask real questions. Get complete answers !
Report Code
AS 6957
Published ON
Jun, 2023
Choose License Type
BUY NOW
  • SHARE
X
Request Customization
Speak to Analyst
Speak to Analyst
OR FACE-TO-FACE MEETING
PERSONALIZE THIS RESEARCH
  • Triangulate with your Own Data
  • Get Data as per your Format and Definition
  • Gain a Deeper Dive on a Specific Application, Geography, Customer or Competitor
  • Any level of Personalization
REQUEST A FREE CUSTOMIZATION
LET US HELP YOU!
  • What are the Known and Unknown Adjacencies Impacting the Urban Air Mobility Market
  • What will your New Revenue Sources be?
  • Who will be your Top Customer; what will make them switch?
  • Defend your Market Share or Win Competitors
  • Get a Scorecard for Target Partners
CUSTOMIZED WORKSHOP REQUEST
+1-888-600-6441
  • Call Us
  • +1-888-600-6441 (Corporate office hours)
  • +1-888-600-6441 (US/Can toll free)
  • +44-800-368-9399 (UK office hours)
CONNECT WITH US
ABOUT TRUST ONLINE
©2024 MarketsandMarkets Research Private Ltd. All rights reserved
DMCA.com Protection Status Website Feedback