Video on Demand in Hospitality Market by Solution (Pay TV, IPTV, and OTT), by Service, by Delivery Model, by User type, by Revenue Model, and by Region - Global Forecast to 2021


[127 Pages Report] MarketsandMarkets estimates the Video on Demand in Hospitality Market to grow from USD 6.89 Billion in 2016 to USD 19.11 Billion by 2021, at a CAGR of 22.6% during 2016-2021.
The base year considered for the study is 2015 and the market size has been projected from 2016 to 2021. The report covers the hospitality market and usage of VOD solutions in it. This report provides brief introduction of VOD solutions and the current trends of using them in the hospitality market. The objective of this market study includes analysis of each subsegments with respect to individual growth trends and contribution towards the overall market. Another objective of the study is to forecast market size of each and every segment with respect to the five major regions.
Major players in the VOD ecosystem were identified across regions, their offerings, and distribution channels; the regional presence has been studied through in-depth discussions. The average revenue generated by these companies segmented by region was used to arrive at the overall VOD market size. This overall Video on Demand in Hospitality Market size is used in the top-down procedure to estimate the sizes of other individual markets via percentage splits from secondary and primary research.
All percentage splits and breakdowns were determined using secondary sources and verified through primary sources. All possible parameters that affect the market covered in this research study have been verified through primary research, and analyzed from the market knowledge. The breakdown of profiles of primary is depicted in the below figure.

To know about the assumptions considered for the study, download the pdf brochure
The ecosystem of the Video on Demand in Hospitality Market consists of video on demand solution providers such as Cisco, Netflix, and Huawei, video on demand platform providers such as Akamai, internet service providers such as Alcatel Lucent, and cloud service provider such as Google and Microsoft. The video on demand solution providers deliver their solutions to customers as per the need, which are later on assisted by service providers for implementation of solutions properly. Other players such as internet service providers like Vodafone also plays important role by providing strong network connections.
Target Audience:
- VOD solution providers
- VOD platform providers
- Service providers
- Third party providers
- Internet service providers
Report Scope:
The report segments the Video on Demand in Hospitality Market on the following basis.
- By Solution:
- Pay TV
- Internet Protocol Television
- Over The Top
- By Service:
- Training & Support
- Professional Services
- By Delivery Model:
- Laptops and Desktops
- Smart phones and Tablets
- Smart TV
- By User Type:
- Hotels
- Cruise/Luxury Yachts
- Day Care Center
- Others (Restaurants and Lounges)
- By Revenue Model:
- Subscription
- Rental
- Retail
- Advertisement
- By Region:
- North America
- U.S.
- Canada
- Europe
- Asia-Pacific (APAC)
- Middle East and Africa (MEA)
- Latin America
- North America
Available Customizations:
With the given market data, MarketsandMarkets offers customizations as per the company�s specific needs. The following customization options are available for the report:
Product Analysis
- Product matrix which gives a detailed comparison of product portfolio of each company
Geographic Analysis
- Further breakdown of the Europe VOD in hospitality market
- Further breakdown of the APAC VOD in hospitality market
- Further breakdown of the MEA VOD in hospitality market
- Further breakdown of the Latin America VOD in hospitality market
Company Information
- Detailed analysis and profiling of additional market players
The Video on Demand in Hospitality Marketis estimated to grow from USD 6.89 Billion in 2016 to USD 19.11 Billion by 2021. The VOD in hospitality market is expected to grow at an impressive Compound Annual Growth Rate (CAGR) of 22.6% because of the rising usage of VOD solution for streaming video anytime. The VOD has provided many advantages to users such as ability to skip advertisements, access to episodes anytime, and ability to watch events and shows with flexibility in time. The online video streaming has also increased the viewership up to 60%, which includes young individuals.
In solutions, IPTV is expected to have the significant market growth rate and dominate the Video on Demand in Hospitality Market from 2016 to 2021. It provides various services such as high speed internet access and on demand TV shows. Due to these rising usage of IPTV, many hospitality segments such as cruise and luxury hotels have started adopting IPTV for enriching guest viewing experience. Moreover, in service segment, professional services are growing at a faster rate. Training and support services are already been adopted by customers at the time of implementing VOD solutions, so professional services such as managed services are being demanded by customers for proper and continuous usage of VOD solutions.
Smartphones and tablets are the widely used delivery models for streaming on-demand videos. This delivery model allows users to watch movie, stream other videos, browsing, gaming, and entertainment. In hospitality segments such as hotels and cruises, usually people carry their own smartphones; so many hotels have started offering internet connectivity services to allow their guest to stream videos on their smart devices.
The VOD solution and services are being increasingly adopted in various hospitality segments, such as hotels, cruises, day care centers, and restaurants, which have led to the growth of the market globally. The cruise and luxury yachts sector is expected to grow at the highest rate from 2016 to 2021.
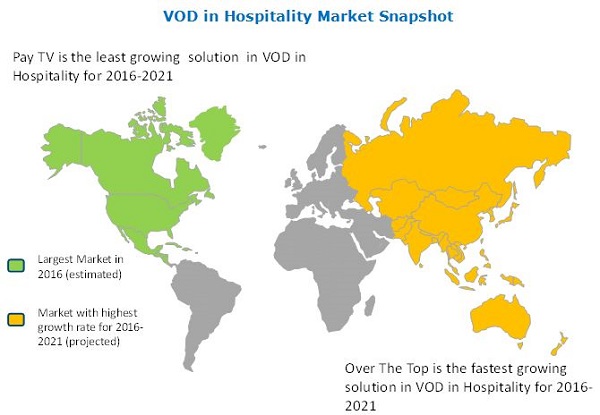
North America is expected to hold the largest market share and dominate the Video on Demand in Hospitality Market from 2016 to 2021. The higher adoption rate is expected due to the rise in demand for entertainment technologies in hospitality sector in North America. APAC offers potential growth opportunities, as there is a rise in cloud technology and digital technology adoption among small and large businesses of hospitality sector for increasing their profitability.
However, the high cost of VOD solutions restricts the market growth. These solutions involve cost of maintenance and timely upgradations, which adds cost to the organization budget. Moreover, these VOD solutions need better network connectivity to stream HD videos that must be compatible with the devices. Thus, this hinders the adoption of VOD solutions across various hospitality segments.
The major vendors in the Video on Demand in Hospitality Market includes Alcatel-lucent(France), Ericsson(Sweden),Huawei (China), AT&T (U.S.), Cisco (U.S.), Apple(U.S.), Microsoft (U.S.), Akamai (U.S.), Avaya (U.S.), and Netflix (U.S.). Alcatel-lucent is one of the major players in this market. This player has adopted various strategies such as new product launches, to cater to the needs of the VOD users. This can be witnessed with the recent launch of Akamai�s Predictive Content Delivery Solutions to allow instant HD quality video distribution on mobile devices. This solution also manages offline video on any device over any network.
To speak to our analyst for a discussion on the above findings, click Speak to Analyst
 Exclusive indicates content/data unique to MarketsandMarkets and not available with any competitors.
Table of Contents
1 Introduction (Page No. - 14)
1.1 Objectives of the Study
1.2 Market Definition
1.3 Market Scope
1.3.1 Markets Covered
1.3.2 Years Considered for the Study
1.4 Currency
1.5 Limitations
1.6 Stakeholders
2 Research Methodology (Page No. - 17)
2.1 Research Data
2.1.1 Secondary Data
2.1.1.1 Key Data Taken From Secondary Sources
2.1.2 Primary Data
2.1.2.1 Key Data Taken From Primary Sources
2.1.2.2 Break Down of Primary Interviews
2.2 Market Size Estimation
2.2.1 Bottom-Up Approach
2.2.2 Top-Down Approach
2.3 Market Breakdown and Data Triangulation
2.4 Assumptions
3 Executive Summary (Page No. - 24)
4 Premium Insights (Page No. - 27)
4.1 Attractive Market Opportunities in the Market
4.2 Market, By User Type and By Region
4.3 Video on Demand in Hospitality Market Potential
4.4 Lifecycle Analysis, By Region, 2016
5 Market Overview (Page No. - 30)
5.1 Introduction
5.2 Market Segmentation
5.2.1 By Solution
5.2.2 By Service
5.2.3 By User Type
5.2.4 By Delivery Model
5.2.5 By Revenue Model
5.2.6 By Region
5.3 Market Dynamics
5.3.1 Drivers
5.3.1.1 Improvement in Guest Viewing Experience
5.3.1.2 Increasing Usage of Mobile Device for Video on Demand
5.3.2 Restraints
5.3.2.1 High Cost of Video on Demand Solutions
5.3.2.2 Network Connectivity Issues
5.3.3 Opportunities
5.3.3.1 Increasing Usage of Web-Based Video on Demand Services
5.3.3.2 Development of New Technology
5.3.4 Challenges
5.3.4.1 Frequent Changes in Customer Demand
6 Industry Trends (Page No. - 37)
6.1 Introduction
6.2 Value Chain Analysis
6.3 Strategic Benchmarking
6.4 Current Trends in the Video on Demand in Hospitality Market
6.4.1 Subscription Video on Demand (SVOD)
6.4.2 Usage of Mobile Technology
6.4.3 Enrich Viewer Experience
6.4.4 High-Speed Internet Services
6.4.5 Increase in Number of Viewing Options
6.4.6 Bring Your Own Device Adoption in Video on Demand
7 Video on Demand in Hospitality Market Analysis, By Component (Page No. - 41)
7.1 Introduction
7.2 Solution
7.2.1 Introduction
7.2.2 Pay TV
7.2.3 Internet Protocol Television
7.2.4 Over the Top
7.3 Service
7.3.1 Introduction
7.3.2 Training and Support Services
7.3.3 Professional Services
8 Video on Demand in Hospitality Market Analysis, By Delivery Model (Page No. - 49)
8.1 Introduction
8.2 Laptops and Desktops
8.3 Smartphones and Tablets
8.4 Smart TV
9 Video on Demand in Hospitality Market Analysis, By User Type (Page No. - 54)
9.1 Introduction
9.2 Hotels
9.3 Cruise/Luxury Yachts
9.4 Day Care Centers
9.5 Others
10 Video on Demand in Hospitality Market Analysis, By Revenue Model (Page No. - 60)
10.1 Introduction
10.2 Subscription
10.3 Rental
10.4 Retail
10.5 Advertisement
11 Geographic Analysis (Page No. - 66)
11.1 Introduction
11.2 North America
11.2.1 United States
11.2.2 Canada
11.3 Europe
11.4 Asia-Pacific
11.5 Middle East and Africa
11.6 Latin America
12 Competitive Landscape (Page No. - 86)
12.1 Overview
12.2 Competitive Situation and Trends
12.3 Product Mapping for Major Players
12.3.1 New Product Launches and Upgradations
12.3.2 Partnerships and Collaborations
12.3.3 Acquisitions
13 Company Profile (Page No. - 92)
(Overview, Products & Services, Strategies & Insights, Developments and MnM View)*
13.1 Tier 1 Players
13.1.1 Alcatel-Lucent
13.1.2 Ericsson
13.1.3 Huawei Technologies Co, Ltd.
13.1.4 AT&T, Inc.
13.1.5 Cisco Systems Inc.
13.1.6 Apple, Inc.
13.2 Tier 2 Players
13.2.1 Akamai Technologies, Inc.
13.2.2 Avaya, Inc.
13.2.3 Netflix, Inc.
*Details on Overview, Products & Services, Strategies & Insights, Developments and MnM View Might Not Be Captured in Case of Unlisted Companies.
14 Appendix (Page No. - 119)
14.1 Other Key Developments
14.2 Discussion Guide
14.3 Knowledge Store: Marketsandmarkets� Subscription Portal
14.4 Introducing RT: Real-Time Market Intelligence
14.5 Available Customizations
14.6 Related Reports
List of Tables (65 Tables)
Table 1 Global Video on Demand in Hospitality Market Size and Growth Rate, 2014�2021 (USD Million, Yoy %)
Table 2 Market Size, By Component, 2014�2021 (USD Million)
Table 3 Market Size, By Solution Type, 2014�2021 (USD Million)
Table 4 Pay TV: Market Size, By Region, 2014�2021 (USD Million)
Table 5 Internet Protocol Television: Market Size, By Region, 2014�2021 (USD Million)
Table 6 Over the Top: Market Size, By Region, 2014�2021 (USD Million)
Table 7 Video on Demand in Hospitality Market Size, By Service, 2014�2021 (USD Million)
Table 8 Training and Support Service: Market Size, By Region, 2014�2021 (USD Million)
Table 9 Professional Services: Market Size, By Region, 2014�2021 (USD Million)
Table 10 Market Size, By Delivery Model, 2014�2021 (USD Million)
Table 11 Laptops and Desktops: Market Size, By Region, 2014�2021 (USD Million)
Table 12 Smartphones and Tablets: Market Size, By Region, 2014�2021 (USD Million)
Table 13 Smart TV: Market Size, By Region, 2014�2021 (USD Million)
Table 14 Market Size, By User Type, 2014�2021 (USD Million)
Table 15 Hotels: Market Size, By Region, 2014�2021 (USD Million)
Table 16 Cruise/Luxury Yachts: VoD in Hospitality Market Size, By Region, 2014�2021 (USD Million)
Table 17 Day Care Centers: Market Size, By Region, 2014�2021 (USD Million)
Table 18 Others: Market Size, By Region, 2014�2021 (USD Million)
Table 19 Market Size, By Revenue Model, 2014�2021 (USD Million)
Table 20 Subscription: Market Size, By Region, 2014�2021 (USD Million)
Table 21 Rental: Market, By Region, 2014�2021 (USD Million)
Table 22 Retail: Market Size, By Region, 2014�2021 (USD Million)
Table 23 Advertisement: Market Size, By Region, 2014�2021 (USD Million)
Table 24 Video on Demand in Hospitality Market Size, By Region, 2014�2021 (USD Million)
Table 25 North America: Market Size, By Solution, 2014�2021 (USD Million)
Table 26 North America: Market Size, By Service, 2014�2021 (USD Million)
Table 27 North America: Market Size, By Delivery Model, 2014�2021 (USD Million)
Table 28 North America: Market Size, By User Type, 2014�2021 (USD Million)
Table 29 North America: Market Size, By Revenue Model, 2014�2021 (USD Million)
Table 30 United States: Market Size, By Solution, 2014�2021 (USD Million)
Table 31 United States: Market Size, By Service, 2014�2021 (USD Million)
Table 32 United States : Market Size, By Delivery Model, 2014�2021 (USD Million)
Table 33 United States: Market Size, By User Type, 2014�2021 (USD Million)
Table 34 United States: VoD in Hospitality Market Size, By Revenue Model, 2014�2021 (USD Million)
Table 35 Canada: Market Size, By Solution, 2014�2021 (USD Million)
Table 36 Canada: Market, By Service, 2014�2021 (USD Million)
Table 37 Canada: Market Size, By Delivery Model, 2014�2021 (USD Million)
Table 38 Canada: Market Size, By User Type, 2014�2021 (USD Million)
Table 39 Canada: Market Size, By Revenue Model, 2014�2021 (USD Million)
Table 40 Europe: Market Size, By Solution, 2014�2021 (USD Million)
Table 41 Europe: Market Size, By Service, 2014�2021 (USD Million)
Table 42 Europe: Market Size, By Delivery Model, 2014�2021 (USD Million)
Table 43 Europe: Market Size, By User Type, 2014�2021 (USD Million)
Table 44 Europe: Market Size, By Revenue Model, 2014�2021 (USD Million)
Table 45 Asia-Pacific: Video on Demand in Hospitality Market Size, By Solution, 2014�2021 (USD Million)
Table 46 Asia-Pacific: Market Size, By Service, 2014�2021 (USD Million)
Table 47 Asia-Pacific: Market Size, By Delivery Model, 2014�2021 (USD Million)
Table 48 Asia-Pacific: Market Size, By User Type, 2014�2021 (USD Million)
Table 49 Asia-Pacific: Market Size, By Revenue Model, 2014�2021 (USD Million)
Table 50 Middle East and Africa: Market Size, By Solution, 2014�2021 (USD Million)
Table 51 Middle East and Africa: Market Size, By Service, 2014�2021 (USD Million)
Table 52 Middle East and Africa: Market Size, By Delivery Model, 2014�2021 (USD Million)
Table 53 Middle East and Africa: Market Size, By User Type, 2014�2021 (USD Million)
Table 54 Middle East and Africa: Market Size, By Revenue Model, 2014�2021 (USD Million)
Table 55 Latin America: Video on Demand in Hospitality Market Size, By Solution, 2014�2021 (USD Million)
Table 56 Latin America: Market Size, By Service, 2014�2021 (USD Million)
Table 57 Latin America: Market Size, By Delivery Model, 2014�2021 (USD Million)
Table 58 Latin America: Market Size, By User Type, 2014�2021 (USD Million)
Table 59 Latin America: Market Size, By Revenue Model, 2014�2021 (USD Million)
Table 60 New Product Launches and Upgradations, 2015-2016
Table 61 Partnerships, 2015-2016
Table 62 Acquisitions, 2015-2016
Table 63 New Product Launches, 2013-2014
Table 64 Partnerships and Collaborations, 2013-2014
Table 65 Acquisitions, 2013-2014
List of Figures (55 Figures)
Figure 1 Research Design
Figure 2 Breakdown of Primary Interview: By Company, Designation, and Region
Figure 3 Market Size Estimation Methodology: Bottom-Up Approach
Figure 4 Market Size Estimation Methodology: Top-Down Approach
Figure 5 Data Triangulation
Figure 6 Video on Demand in Hospitality Market Size, By Revenue Model (2016�2021): Market for Subscription Revenue Model is Expected to Double During the Forecast Period
Figure 7 Global Market Share, By Region: North America is Expected to Hold the Largest Market Share in 2016
Figure 8 Growing Usage of Video on Demand Solutions for Watching Online Videos is Expected to Drive Market Growth During the Forecast Period
Figure 9 Hotel User Type is Expected to Hold the Largest Market Share in 2016
Figure 10 Asia-Pacific is Expected to Have the Highest Market Growth Potential During the Forecast Period
Figure 11 Regional Lifecycle: North America is Expected to Be in the Growth Phase in 2016
Figure 12 Video on Demand Market Segmentation: By Solution
Figure 13 Video on Demand Market Segmentation: By Service
Figure 14 Video on Demand Market Segmentation: By User Type
Figure 15 Video on Demand Market Segmentation: By Delivery Model
Figure 16 Video on Demand Market Segmentation: By Revenue Model
Figure 17 Video on Demand Market Segmentation: By Region
Figure 18 Market: Drivers, Restraints, Opportunities, and Challenges
Figure 19 Video on Demand Market: Value Chain Analysis
Figure 20 Video on Demand in Hospitality Market: Strategic Benchmarking
Figure 21 Over the Top Solution is Growing at the Highest CAGR in 2016�2020
Figure 22 North America is Expected to Adopt IPTV Solution Swiftly During the Forecast Period
Figure 23 Services Segment Expected to Grow Extensively During the Forecast Period
Figure 24 Smartphones and Tablets Delivery Model is Expected to Exhibit the Highest Growth Rate in the Video on Demand Market During 2016�2021
Figure 25 Asia-Pacific is Expected to Have the Highest Adoption Rate of Video on Demand Solutions for Smartphones and Tablets Delivery Model
Figure 26 North America is Expected to Increasingly Adopt Video on Demand Solutions for Smart TV
Figure 27 Hotels Segment is Expected to Have the Largest Market Size During the Forecast Period
Figure 28 Cruise/Yachts Segment is Expected to Adopt Video on Demand Solutions Extensively in North America
Figure 29 Rental Revenue Model is Expected to Exhibit the Highest Growth Rate in the Video on Demand in Hospitality Market During 2016�2021
Figure 30 Subscription Revenue Model is Growing Significantly in North America
Figure 31 North America is Expected to Increasingly Adopt Retail Revenue Model for Video on Demand for Hospitality Solutions
Figure 32 Geographic Analysis
Figure 33 North America Market Snapshot: On-Premises Deployment to Contribute Maximum to the Market
Figure 34 Asia-Pacific Market Snapshot: Media and Entertainment Industry is Expected to Gain Popularity
Figure 35 Companies Adopted New Product Launches as the Key Growth Strategy Over the Past Three Years
Figure 36 Market Evaluation Framework
Figure 37 Video on Demand in Hospitality: Product Category Mapping
Figure 38 Battle for Market Share: Partnerships and New Product Launches are the Key Strategies
Figure 39 Alcatel-Lucent: Company Snapshot
Figure 40 Alcatel-Lucent : SWOT Analysis
Figure 41 Ericsson : Company Snapshot
Figure 42 Ericsson : SWOT Analysis
Figure 43 Huawei Technologies Co., Ltd. : Company Snapshot
Figure 44 Huawei Technologies Co., Ltd.: SWOT Analysis
Figure 45 AT&T, Inc.: Company Snapshot
Figure 46 AT&T, Inc.: SWOT Analysis
Figure 47 Cisco Systems Inc.: Company Snapshot
Figure 48 Cisco Systems : SWOT Analysis
Figure 49 Apple, Inc.: Company Snapshot
Figure 50 Apple, Inc.: SWOT Analysis
Figure 51 Microsoft Corporation: Company Snapshot
Figure 52 Microsoft Corporation: SWOT Analysis
Figure 53 Akamai Technologies, Inc.: Company Snapshot
Figure 54 Avaya, Inc.: Company Snapshot
Figure 55 Netflix, Inc. : Company Snapshot


Growth opportunities and latent adjacency in Video on Demand in Hospitality Market