Washable Markers Market by Washability (Basic washable, Super washable), End user (Children, Professionals) and Region (North America, Europe, Asia Pacific, Middle East and Africa, South America) - Global Forecast to 2023


The washable markers market is projected to reach USD 507.0 million by 2023, at a CAGR of 3.57%. The base year considered for the study is 2017, and the market size is projected from 2018 to 2023.
The washable markers market report aims to study the various segments that are part of the manufacturing process of washable markers and the end consumers. The other objectives include providing detailed information regarding the main factors influencing the growth of the market (drivers, restraints, opportunities, and industry-specific challenges). It also aims to study the individual growth trends, future prospects, and contribution of various segments to the total market. The study also analyzes the opportunities in the market for stakeholders and details of the competitive landscape for the market leaders. The study strategically profiles key players and comprehensively analyzes their core competencies. Finally, the study tracks and analyzes the competitive developments such as partnerships, agreements, and joint ventures; mergers & acquisitions; new product developments; and research & development activities in the washable marker market.
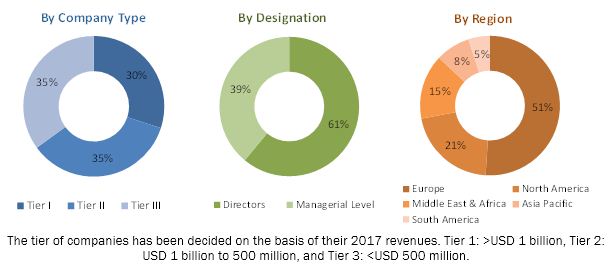
The research methodology used to estimate and forecast the washable markers market includes the top-down and bottom-up approaches. The total market size of washable markers was calculated based on the percentage split of washable markers as well as on the percentage split of different end users. The allotment and calculation were done on the basis of extensive primary interviews and secondary research. Primary research involved in this report includes extensive interviews with key people such as CEOs, VPs, directors, and executives. After arriving at the overall market size, the total market was split into several segments and subsegments. Data triangulation and market breakdown procedures were employed to complete the overall market engineering process and arrive at the exact statistics for all segments and subsegments. The breakdown of profiles of primaries is depicted in the following figure:
To know about the assumptions considered for the study, download the pdf brochure
Key Players in Washable Markers Market
The market’s ecosystem includes various stakeholders involved in the supply chain of the washable markers industry starting from raw materials suppliers, research & development, manufacturing, and the assembly team. Post this, the marketing and sales of the finished products take place, which is only possible if an efficient distribution channel is developed. Finally, the end products are made available to the consumers. The global market for washable markers is dominated by players such as Crayola LLC (US), Faber-Castell (Germany), F.I.L.A. - Fabbrica Italiana Lapis ed Affini S.p.A (Italy), BIC Group (France), Newell Brands (US), Carioca S.p.a (US), Liqui-Mark (US), STABILO International GMBH (Germany), Dri Mark Products Inc. (US), and Luxor Group (India).
Target Audience in Washable Markers Market
- Washable marker manufacturers
- Raw material suppliers
- End users
Washable Markers Market Report Scope
The research report segments the washable markers market into the following submarkets:
By washability:
- Basic- Washable
- Super-Washable
By end user:
- Children
- Professionals
By region:
- North America
- Europe
- Asia Pacific
- South America
- Middle East & Africa
Washable Markers Market Report Available Customizations
With the given market data, MarketsandMarkets offers customizations according to client-specific needs. The following customization options are available for the report:
Product Analysis
- Product Matrix, which gives a detailed comparison of the product portfolio of each company
Geographic Analysis
- Further analysis of the washable markers market for additional countries
Company Information
- Detailed analysis and profiling of additional market players
MarketsandMarkets projects that the washable markers market size will grow from USD 425.5 million in 2018 to USD 507.0 million by 2023, at a CAGR of 3.57%. The washable marker market is expected to witness high growth as a result of the increasing number of school-going children coupled with the rising disposable income of households, owing to which parents are spending more on children’s education and on creative expression products.
The segmentation for this report is based on washability, end user, and region. On the basis of washability, the market is segmented into basic and super washable markers, wherein the super washable segment is projected to be faster-growing. The ink from super-washable markers is water-based and can be cleaned from non-porous laminate surfaces found on most classroom desks by simply using water. One of the key advantages of super-washable markers is that they do not require any additional solvent for the ink to be removed.
Washable markers have witnessed extensive traction from the children segment. These markers are drawing tools that are ideal for young children who may accidentally mark their clothes or bodies. Marks from washable markers can be easily removed from skin, clothes, and walls just by wiping a wet sponge across the surface. Since washable markers do not permanently stain a surface, they are perfect for home and classroom use. Moreover, washable markers are non-toxic. The children segment held a larger share and is expected to dominate the washable markers market from 2018 to 2023.
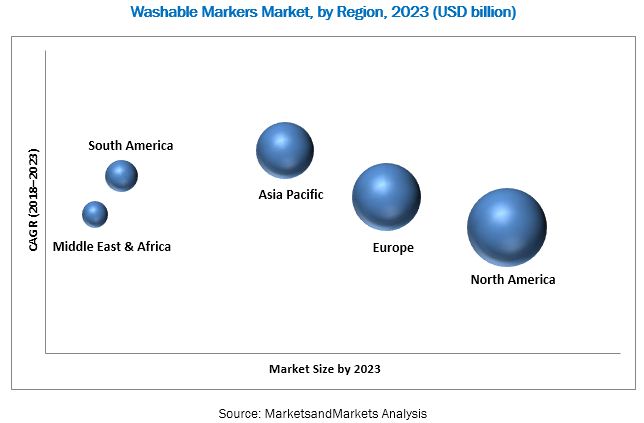
North America is projected to have the largest share in the washable markers market. The region is a significant market for washable markers owing to the growing demand for writing instruments from schools, households, and corporates. Crayola LLC, headquartered in the US, is a major player operating in North America. According to Crayola LLC, it has 99% name recognition in the US. Other writing instrument manufacturers operating in North America include Bic Corp and Faber-Castell USA, with a significant market share in the North American washable marker market. The washable markers market is unorganized, which is a major factor restraining its growth.
Key Washable Markers Market Industry Players
The global market for washable markers is dominated by players such as Crayola LLC (US), Faber-Castell (Germany), F.I.L.A. - Fabbrica Italiana Lapis ed Affini S.p.A (Italy), BIC Group (France), Newell Brands (US), Carioca S.p.a (US), Liqui-Mark (US), Stabilo International GMBH (Germany), Dri Mark Products Inc. (US), and Luxor Group (India). These players adopted various strategies such as agreements, contracts, and partnership, mergers & acquisitions, and new product & technology launches to cater to the needs of the washable markers market.
Frequently Asked Questions (FAQ):
How big is the Washable Markers Market industry?
The washable markers market size is projected to grow from USD 425.5 million in 2018 to USD 507.0 million by 2023, at a CAGR of 3.57%.
Who leading market players in Washable Markers industry?
The major players in the washable markers market include Crayola LLC (US), Faber-Castell (Germany), F.I.L.A. - Fabbrica Italiana Lapis ed Affini S.p.A (Italy), BIC Group (France), Newell Brands (US), Carioca S.p.a (US), Liqui-Mark (US), Stabilo International GMBH (Germany), Dri Mark Products Inc. (US), and Luxor Group (India).
To speak to our analyst for a discussion on the above findings, click Speak to Analyst
 Exclusive indicates content/data unique to MarketsandMarkets and not available with any competitors.
Table of Contents
1 Introduction (Page No. - 14)
1.1 Objectives of the Study
1.2 Market Definition
1.3 Study Scope
1.3.1 Regional Scope
1.3.2 Periodization Considered
1.4 Currency Considered
1.5 Unit Considered
1.6 Stakeholders
2 Research Methodology (Page No. - 18)
2.1 Research Data
2.1.1 Secondary Data
2.1.1.1 Key Data From Secondary Sources
2.1.2 Primary Data
2.1.2.1 Key Data From Primary Sources
2.1.2.2 Breakdown of Primaries
2.2 Market Size Estimation
2.3 Data Triangulation
2.4 Research Assumptions & Limitations
2.4.1 Assumptions
2.4.2 Limitations
3 Executive Summary (Page No. - 25)
4 Premium Insights (Page No. - 28)
4.1 Attractive Opportunities in the Washable Markers Market
4.2 Washable Marker Market, By Type
4.3 Washable Markers Market, By End User
4.4 Washable Marker Market: Regional Snapshot
5 Market Overview (Page No. - 30)
5.1 Introduction
5.2 Market Dynamics
5.2.1 Drivers
5.2.1.1 Increase in Number of School-Going Children Coupled With A Rise in Disposable Income of Households
5.2.2 Restraints
5.2.2.1 Unorganized Market
5.2.3 Opportunities
5.2.3.1 Emerging Economies
5.2.4 Challenges
5.2.4.1 the Increase in Shift Toward E-Learning and Digital Platforms
5.3 Macroeconomic Indicators
5.3.1 Introduction
5.3.2 Rise in Disposable Income
5.3.3 Increase in Middle-Class Population
5.3.4 Increase in Gdp in Emerging Economies
6 Washable Markers Market, By Washability (Page No. - 35)
6.1 Introduction
6.2 Basic Washable Markers
6.3 Super-Washable Markers
7 Washable Markers Market, By End User (Page No. - 38)
7.1 Introduction
7.2 Children
7.3 Professionals
8 Regional Analysis (Page No. - 41)
8.1 Introduction
8.2 North America
8.2.1 US
8.2.2 Canada
8.3 Europe
8.3.1 Germany
8.3.2 UK
8.3.3 Italy
8.3.4 France
8.3.5 Rest of Europe
8.4 Asia Pacific
8.4.1 China
8.4.2 Japan
8.4.3 Australia
8.4.4 Rest of Asia Pacific
8.5 Middle East & Africa
8.5.1 UAE
8.5.2 Turkey
8.5.3 Rest of Middle East & Africa
8.6 South America
8.6.1 Brazil
8.6.2 Rest of South America
9 Competitive Landscape (Page No. - 73)
9.1 Overview
9.2 Competitive Scenario
9.2.1 Expansion & Investments
9.2.2 Mergers & Acquisitions
9.2.3 Agreement, Contracts, and Partnerships
9.2.4 New Product Launch
10 Company Profiles (Page No. - 76)
Business Overview, Products Offered, Recent Developments, SWOT Analysis, MnM View
10.1 Crayola LLC
10.2 F.I.L.A. - Fabbrica Italiana Lapis Ed Affini S.P.A
10.3 BIC Group
10.4 Newell Brands
10.5 Faber-Castell
10.6 Carioca S.p.A
10.7 Liqui-Mark
10.8 Stabilo International Gmbh
10.9 Dri Mark Products Inc
10.10 Luxor Group
*Details on (Business Overview, Products Offered, Recent Developments, SWOT Analysis, MnM View)
11 Appendix (Page No. - 91)
11.1 Discussion Guide
11.2 Knowledge Store: Marketsandmarkets’ Subscription Portal
11.3 Available Customizations
11.4 Author Details
List of Tables (106 Tables)
Table 1 Annual Growth Rate in Household Disposable Income Across Countries, 2015–2016
Table 2 Trend and Forecast of Nominal Gdp, 2015–2022 (USD Billion)
Table 3 Washable Markers Market Size, By Washability, 2016–2023 (USD Million)
Table 4 Washable Marker Market Size, By Washability, 2016–2023 (Million Units)
Table 5 Washable Markers Market Size, By End Users, 2016–2023 (USD Million)
Table 6 Washable Marker Market Size, By End Users, 2016–2023 (Million Units)
Table 7 Washable Markers Market Size, By Region, 2016–2023 (USD Million)
Table 8 Washable Marker Market Size, By Region, 2016–2023 (Million Units)
Table 9 North America: By Market Size, By Country, 2016–2023 (USD Million)
Table 10 North America: By Market Size, By Country, 2016–2023 (Million Units)
Table 11 North America: By Market Size, By Washability, 2016–2023 (USD Million)
Table 12 North America: By Market Size, By Washability, 2016–2023 (Million Units)
Table 13 North America: By Market Size, By End User, 2016–2023 (USD Million)
Table 14 North America: By Market Size, By End User, 2016–2023 (Million Units)
Table 15 US: By Market Size, By Washability, 2016–2023 (USD Million)
Table 16 US: By Market Size, By Washability, 2016–2023 (Million Units)
Table 17 US: By Market Size, By End User, 2016–2023 (USD Million)
Table 18 US: By Market Size, By End User, 2016–2023 (Million Units)
Table 19 Canada : By Market Size, By Washability, 2016–2023 (USD Million)
Table 20 Canada: By Market Size, By Washability, 2016–2023 (Million Units)
Table 21 Canada: By Market Size, By End User, 2016–2023 (USD Million)
Table 22 Canada: By Market Size, By End User, 2016–2023 (Million Units)
Table 23 Europe: By Market Size, By Country, 2016–2023 (USD Million)
Table 24 Europe: By Market Size, By Country, 2016–2023 (Million Units)
Table 25 Europe: By Market Size, By Washability, 2016–2023 (USD Million)
Table 26 Europe: By Market Size, By Washability, 2016–2023 (Million Units)
Table 27 Europe: By Market Size, By End User, 2016–2023 (USD Million)
Table 28 Europe: By Market Size, By End User, 2016–2023 (Million Units)
Table 29 Germany: By Market Size, By Washability, 2016–2023 (USD Million)
Table 30 Germany: By Market Size, By Washability, 2016–2023 (Million Units)
Table 31 Germany: By Market Size, By End User, 2016–2023 (USD Million)
Table 32 Germany: By Market Size, By End User, 2016–2023 (Million Units)
Table 33 UK: By Market Size, By Washability, 2016–2023 (USD Million)
Table 34 UK: By Market Size, By Washability, 2016–2023 (Million Units)
Table 35 UK: By Market Size, By End User, 2016–2023 (USD Million)
Table 36 UK: By Market Size, By End User, 2016–2023 (Million Units)
Table 37 Italy: By Market Size, By Washability, 2016–2023 (USD Million)
Table 38 Italy: By Market Size, By Washability, 2016–2023 (Million Units)
Table 39 Italy: By Market Size, By End User, 2016–2023 (USD Million)
Table 40 Italy: By Market Size, By End User, 2016–2023 (Million Units)
Table 41 France: By Market Size, By Washability, 2016–2023 (USD Million)
Table 42 France: By Market Size, By Washability, 2016–2023 (Million Units)
Table 43 France: By Market Size, By End User, 2016–2023 (USD Million)
Table 44 France: By Market Size, By End User, 2016–2023 (Million Units)
Table 45 Rest of Europe: By Market Size, By Washability, 2016–2023 (USD Million)
Table 46 Rest of Europe: By Market Size, By Washability, 2016–2023 (Million Units)
Table 47 Rest of Europe: By Market Size, By End User, 2016–2023 (USD Million)
Table 48 Rest of Europe: By Market Size, By End User, 2016–2023 (Million Units)
Table 49 Asia Pacific: By Market Size, By Country, 2016–2023 (USD Million)
Table 50 Asia Pacific: By Market Size, By Country, 2016–2023 (Million Units)
Table 51 Asia Pacific: By Market Size, By Washability, 2016–2023 (USD Million)
Table 52 Asia Pacific: By Market Size, By Washability, 2016–2023 (Million Units)
Table 53 Asia Pacific: By Market Size, By End User , 2016–2023 (USD Million)
Table 54 Asia Pacific: By Market Size, By End User , 2016–2023 (Million Units)
Table 55 China: By Market Size, By Washability, 2016–2023 (USD Million)
Table 56 China: By Market Size, By Washability, 2016–2023 (Million Units)
Table 57 China: By Market Size, By End User, 2016–2023 (USD Million)
Table 58 China: By Market Size, By End User, 2016–2023 (Million Units)
Table 59 Japan: By Market Size, By Washability, 2016–2023 (USD Million)
Table 60 Japan: By Market Size, By Washability, 2016–2023 (Million Units)
Table 61 Japan: By Market Size, By End Use, 2016–2023 (USD Million)
Table 62 Japan: By Market Size, By End Use, 2016–2023 (Million Units)
Table 63 Australia: By Market Size, By Washability, 2016–2023 (USD Million)
Table 64 Australia: By Market Size, By Washability, 2016–2023 (Million Units)
Table 65 Australia: By Market Size, By End User, 2016–2023 (USD Million)
Table 66 Australia: By Market Size, By End User, 2016–2023 (Million Units)
Table 67 Rest of Asia Pacific: By Market Size, By Washability, 2016–2023 (USD Million)
Table 68 Rest of Asia Pacific: By Market Size, By Washability, 2016–2023 (Million Units)
Table 69 Rest of Asia Pacific: By Market Size, By End Use, 2016–2023 (USD Million)
Table 70 Rest of Asia Pacific: By Market Size, By End Use, 2016–2023 (Million Units)
Table 71 Middle East & Africa: By Market Size, By Country, 2016–2023 (USD Million)
Table 72 Middle East & Africa: By Market Size, By Country, 2016–2023 (Million Units)
Table 73 Middle East & Africa: By Market Size, By Washability, 2016–2023 (USD Million)
Table 74 Middle East & Africa: By Markers Market Size, By Washability, 2016–2023 (Million Units)
Table 75 Middle East & Africa: By Market Size, By End User , 2016–2023 (USD Million)
Table 76 Middle East & Africa: By Market Size, By End Use, 2016–2023 (Million Units)
Table 77 UAE: By Market Size, By Washability, 2016–2023 (USD Million)
Table 78 UAE: By Market Size, By Washability, 2016–2023 (Million Units)
Table 79 UAE: By Market Size, By End Use, 2016–2023 (USD Million)
Table 80 UAE: By Market Size, By End Use, 2016–2023 (Million Units)
Table 81 Turkey: By Market Size, By Washability, 2016–2023 (USD Million)
Table 82 Turkey: By Market Size, By Washability, 2016–2023 (Million Units)
Table 83 Turkey: By Market Size, By End Use Industry, 2016–2023 (USD Million)
Table 84 Turkey: By Market Size, By End Use, 2016–2023 (Million Units)
Table 85 Rest of Middle East & Africa: By Market Size, By Washability, 2016–2023 (USD Million)
Table 86 Rest of Middle East & Africa: By Market Size, By Washability, 2016–2023 (Million Units)
Table 87 Rest of Middle East & Africa: By Market Size, By End Use, 2016–2023 (USD Million)
Table 88 Rest of Middle East & Africa: By Market Size, By End Use, 2016–2023 (Million Units)
Table 89 South America: By Market Size, By Country, 2016–2023 (USD Million)
Table 90 South America: By Market Size, By Country, 2016–2023 (Million Units)
Table 91 South America: By Market Size, By Washability, 2016–2023 (USD Million)
Table 92 South America: By Market Size, By Washability, 2016–2023 (Million Units)
Table 93 South America: By Market Size, By End User, 2016–2023 (USD Million)
Table 94 South America: By Market Size, By End User, 2016–2023 (Million Units)
Table 95 Brazil: By Market Size, By Washability, 2016–2023 (USD Million)
Table 96 Brazil: By Market Size, By Washability, 2016–2023 (Million Units)
Table 97 Brazil: By Market Size, By End User, 2016–2023 (USD Million)
Table 98 Brazil: By Market Size, By End User, 2016–2023 (Million Units)
Table 99 Rest of South America: By Market Size, By Washability, 2016–2023 (USD Million)
Table 100 Rest of South America: By Market Size, By Washability, 2016–2023 (Million Units)
Table 101 Rest of South America: By Market Size, By End User, 2016–2023 (USD Million)
Table 102 Rest of South America: By Market Size, By End User, 2016–2023 (Million Units)
Table 103 Expansions & Investments
Table 104 Mergers & Acquisitions
Table 105 Agreements, Contracts, and Partnerships
Table 106 New Product Launch
List of Figures (22 Figures)
Figure 1 Washable Markers Market Segmentation
Figure 2 Washable Marker Market, By Region
Figure 3 Washable Markers Market: Research Design
Figure 4 Market Size Estimation Methodology: Bottom-Up Approach
Figure 5 Market Size Estimation Methodology: Top-Down Approach
Figure 6 Washable Marker Market: Data Triangulation
Figure 7 Basic Washable Markers to Dominate the Washable Markers Market, in Terms of Washability, Through 2023
Figure 8 Children are to Form the Larger End-User Segment From 2018 Through 2023
Figure 9 Asia Pacific to Grow at the Highest Rate in the Washable Market From 2018 to 2023
Figure 10 Washable Marker Market to Record Robust Growth Between 2018 and 2023
Figure 11 Basic-Washable Markers Segment to Lead the Market Through 2023
Figure 12 Children Segment to Grow at A Higher Rate During the Forecast Period
Figure 13 Market in China is Projected to Grow at the Highest Rate From 2018 to 2023
Figure 14 Increasing Demand in Emerging Economies: Major Opportunity for the Growth of the Washable Markers Market
Figure 15 Enrollment of Children in Lower Secondary Grades and Below Across Regions, 2030 (Million Children)
Figure 16 Basic-Washable Markers is Projected to Dominate the Market Through 2023
Figure 17 Children to Dominate the Washable Markers Market Through 2023
Figure 18 Regional Washable Marker Market Snapshot: China is Projected to Drive Global Demand
Figure 19 Asia Pacific Washable Markers Market Snapshot: China is Projected to Be the Fastest-Growing Market Between 2018 & 2023
Figure 20 F.I.L.A Group: Company Snapshot
Figure 21 BIC Group: Company Snapshot
Figure 22 Newell Brands: Company Snapshot


Growth opportunities and latent adjacency in Washable Markers Market