TABLE OF CONTENTS
1 INTRODUCTION
2 RESEARCH METHODOLOGY
3 EXECUTIVE SUMMARY
4 PREMIUM INSIGHTS (Page No. - 43)
4.1 ATTRACTIVE OPPORTUNITIES FOR PLAYERS IN WATER-BASED RESINS MARKET
4.2 WATER-BASED RESINS MARKET GROWTH, BY TYPE
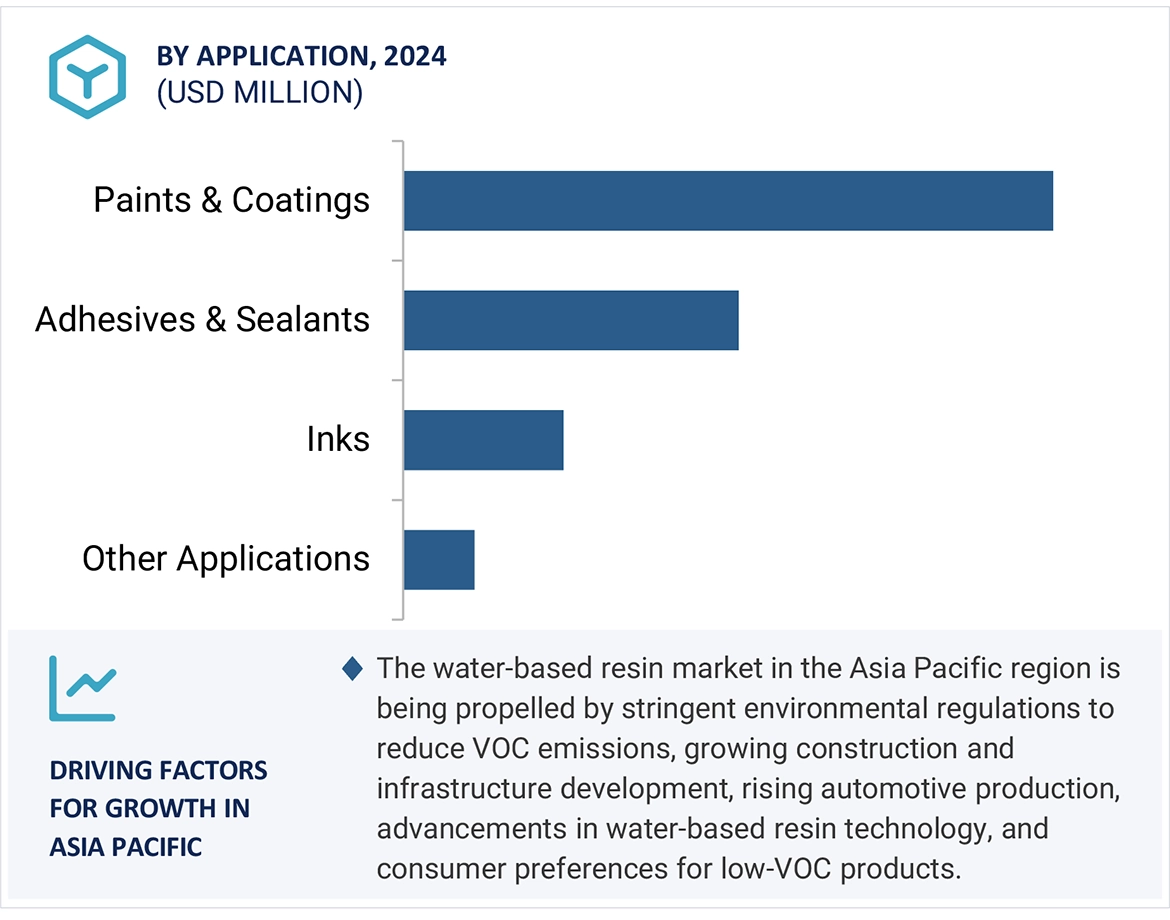
4.3 WATER-BASED RESINS MARKET, BY APPLICATION
4.4 ASIA PACIFIC: WATER-BASED RESINS MARKET, BY APPLICATION & COUNTRY
4.5 WATER-BASED RESINS MARKET: MAJOR COUNTRIES
5 MARKET OVERVIEW (Page No. - 46)
5.1 INTRODUCTION
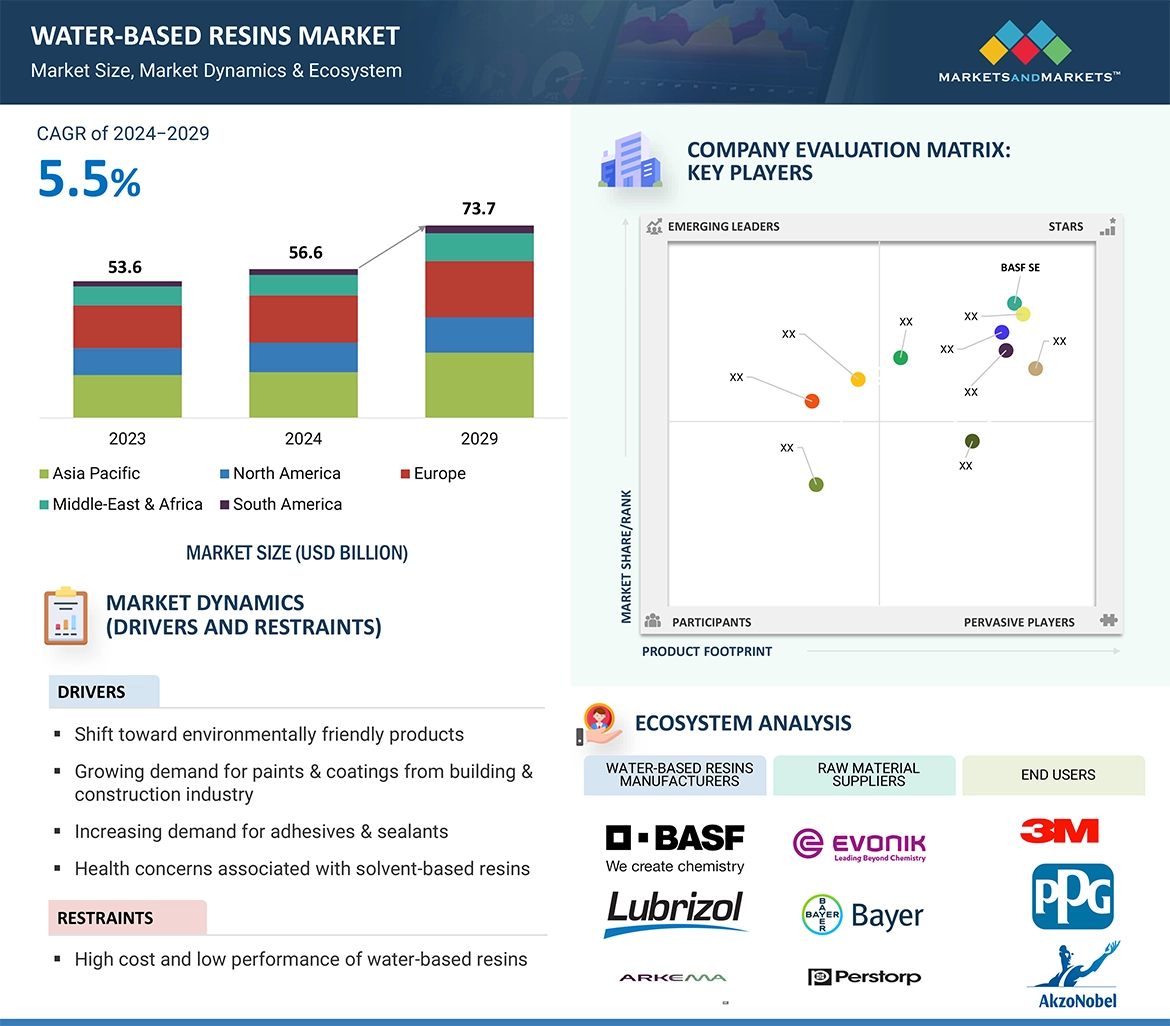
5.2 MARKET DYNAMICS
5.2.1 DRIVERS
5.2.1.1 Growing demand for paints & coatings from building & construction industry
5.2.1.2 Increasing demand for adhesives & sealants
5.2.1.3 Health concerns associated with solvent-based resins
5.2.2 RESTRAINTS
5.2.2.1 High cost and low performance of water-based resins
5.2.3 OPPORTUNITIES
5.2.3.1 Increasing use of water-based resins in emerging applications
5.2.3.2 Demand for water-based resins in developing economies
5.2.4 CHALLENGES
5.2.4.1 Performance limitation of water-based resins compared to solvent-borne resins
5.2.4.2 Growing use of other environmentally friendly technologies
6 INDUSTRY TRENDS (Page No. - 52)
6.1 TRENDS & DISRUPTIONS IMPACTING CUSTOMERS' BUSINESSES
6.2 PRICING ANALYSIS
6.2.1 AVERAGE SELLING PRICE TREND OF KEY PLAYERS, BY TYPE
6.2.2 PRICING TREND ANALYSIS, BY REGION
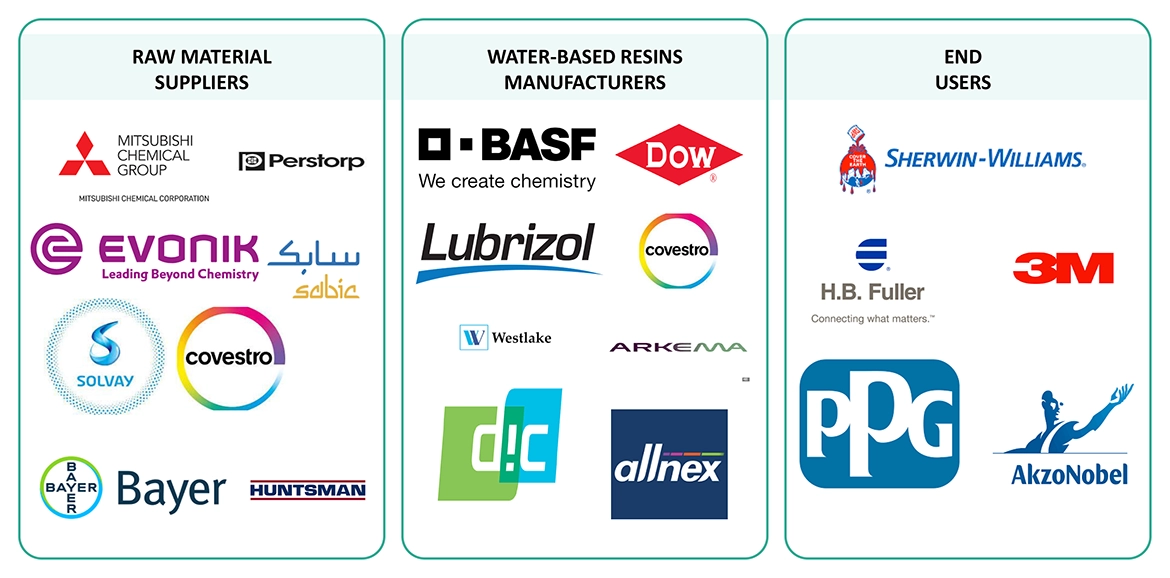
6.3 VALUE CHAIN ANALYSIS
6.3.1 RAW MATERIAL SUPPLIERS
6.3.2 MANUFACTURERS
6.3.3 DISTRIBUTORS
6.3.4 END USERS
6.4 ECOSYSTEM ANALYSIS
6.5 TECHNOLOGY ANALYSIS
6.5.1 KEY TECHNOLOGIES
6.5.1.1 Bio-based waterborne resins
6.5.1.2 Water-based UV (ultraviolet) resins
6.5.1.3 Advancement in water-based resin technology
6.5.1.4 Self-crosslinking water-based resins
6.5.1.5 Hybrid water-based resins
6.5.2 COMPLEMENTARY TECHNOLOGIES
6.5.2.1 Nanotechnology
6.5.2.2 Smart coatings
6.6 PATENT ANALYSIS
6.6.1 INTRODUCTION
6.6.2 METHODOLOGY
6.7 TRADE ANALYSIS
6.8 KEY CONFERENCES & EVENTS
6.9 REGULATORY LANDSCAPE
6.9.1 REGULATORY BODIES, GOVERNMENT AGENCIES, AND OTHER ORGANIZATIONS
6.9.2 REGULATIONS RELATED TO VOCS IN PAINTS & COATING INDUSTRY
6.10 PORTER'S FIVE FORCES ANALYSIS
6.10.1 THREAT OF NEW ENTRANTS
6.10.2 THREAT OF SUBSTITUTES
6.10.3 BARGAINING POWER OF SUPPLIERS
6.10.4 BARGAINING POWER OF BUYERS
6.10.5 INTENSITY OF COMPETITIVE RIVALRY
6.11 KEY STAKEHOLDERS & BUYING CRITERIA
6.11.1 KEY STAKEHOLDERS IN BUYING PROCESS
6.11.2 BUYING CRITERIA
6.12 CASE STUDY ANALYSIS
6.12.1 CASE STUDY 1: WATER-SOLUBLE POLYESTER RESIN
6.12.2 CASE STUDY 2: WATER-BASED RESIN COATING, XL INDUSTRIAL RESINS (UK) LTD., BELLSHILL
6.12.3 CASE STUDY 3: SUBSTITUTION OF AUXILIARY AGENTS IN SOLVENT-BORNE PAINT FORMULATIONS
6.12.4 CASE STUDY 4: GREENER COALESCENT SOLVENT REPLACES UNDESIRED COMMERCIAL COALESCENT IN WATERBORNE SYSTEMS
6.13 MACROECONOMIC ANALYSIS
6.13.1 INTRODUCTION
6.13.2 GDP TRENDS AND FORECASTS
6.13.3 CONSTRUCTION INDUSTRY AND ITS IMPACT ON WATER-BASED RESINS MARKET
6.13.4 GLOBAL AUTOMOBILE PRODUCTION
6.14 INVESTMENT & FUNDING SCENARIO
7 WATER-BASED RESINS MARKET, BY APPLICATION (Page No. - 83)
7.1 INTRODUCTION
7.2 PAINTS & COATINGS
7.2.1 ENVIRONMENTALLY FRIENDLY RESIN TECHNOLOGY AND STRINGENT REGULATIONS TO DRIVE MARKET
7.3 ADHESIVES & SEALANTS
7.3.1 INCREASING DEMAND FOR FLEXIBLE PACKAGING TO DRIVE MARKET
7.4 INKS
7.4.1 EXCELLENT ADHESION AND GOOD COLOR RETENTION TO DRIVE MARKET
7.5 OTHER APPLICATIONS
8 WATER-BASED RESINS MARKET, BY TYPE (Page No. - 89)
8.1 INTRODUCTION
8.2 ACRYLIC
8.2.1 COST-EFFECTIVENESS AND SUPERIOR PROPERTIES TO DRIVE MARKET
8.3 EPOXY
8.3.1 BETTER ADHESION AND EXCELLENT BONDING PROPERTIES TO DRIVE MARKET
8.4 POLYURETHANES
8.4.1 RISING DEMAND FOR PAINTS & COATING TO DRIVE MARKET
8.5 ALKYD
8.5.1 STRINGENT AIR POLLUTION REGULATIONS TO DRIVE MARKET
8.6 POLYESTERS
8.6.1 LOWER VOC CONTENT COUPLED WITH SUPERIOR PROPERTIES TO DRIVE MARKET
8.7 VINYL
8.7.1 FLEXIBILITY AND ADHESION PROPERTIES TO DRIVE MARKET
8.8 OTHER TYPES
9 WATER-BASED RESINS MARKET, BY REGION (Page No. - 96)
9.1 INTRODUCTION
9.2 ASIA PACIFIC
9.2.1 RECESSION IMPACT
9.2.2 CHINA
9.2.2.1 Growth in construction industry to augment demand
9.2.3 JAPAN
9.2.3.1 Investments in reconstruction activities to fuel demand for water-based resins
9.2.4 INDIA
9.2.4.1 Thriving automotive industry supporting market growth
9.2.5 SOUTH KOREA
9.2.5.1 Healthy growth of construction industry to drive demand
9.2.6 INDONESIA
9.2.6.1 Government focus on increasing investment in infrastructure development to drive market
9.2.7 REST OF ASIA PACIFIC
9.3 NORTH AMERICA
9.3.1 RECESSION IMPACT
9.3.2 US
9.3.2.1 Increase in construction spending to fuel demand
9.3.3 CANADA
9.3.3.1 Growth in construction sector to propel demand for water-based resins
9.3.4 MEXICO
9.3.4.1 Growth in residential construction segment to drive market
9.4 EUROPE
9.4.1 RECESSION IMPACT
9.4.2 GERMANY
9.4.2.1 Increased production of automobiles to drive demand for water-based resins
9.4.3 FRANCE
9.4.3.1 Government investments in infrastructure projects to drive market
9.4.4 UK
9.4.4.1 Growth in construction industry to impact water-based resins market
9.4.5 ITALY
9.4.5.1 Rising investments in construction industry to drive demand
9.4.6 SPAIN
9.4.6.1 Government investment in infrastructure and automotive industries to drive growth
9.4.7 RUSSIA
9.4.7.1 Growth in construction industry to augment demand for water-based resins
9.4.8 TURKEY
9.4.8.1 Government reconstruction efforts post-2023 earthquakes and robust paints & coatings industry to drive growth
9.4.9 REST OF EUROPE
9.5 MIDDLE EAST & AFRICA
9.5.1 RECESSION IMPACT
9.5.2 GCC COUNTRIES
9.5.2.1 Saudi Arabia
9.5.2.1.1 Saudi Vision 2030 to play pivotal role in driving market
9.5.2.2 UAE
9.5.2.2.1 Government initiatives to drive market growth
9.5.2.3 Rest of GCC countries
9.5.3 SOUTH AFRICA
9.5.3.1 Investments in infrastructure to drive market
9.5.4 REST OF MIDDLE EAST & AFRICA
9.6 SOUTH AMERICA
9.6.1 RECESSION IMPACT
9.6.2 BRAZIL
9.6.2.1 Growing construction and automotive sectors to drive market
9.6.3 ARGENTINA
9.6.3.1 Investments in small-scale infrastructure projects to drive market
9.6.4 REST OF SOUTH AMERICA
10 COMPETITIVE LANDSCAPE (Page No. - 201)
10.1 OVERVIEW
10.2 KEY PLAYER STRATEGIES/RIGHT TO WIN
10.3 MARKET SHARE ANALYSIS
10.4 REVENUE ANALYSIS
10.5 MARKET RANKING ANALYSIS
10.6 COMPANY VALUATION & FINANCIAL METRICS
10.7 BRAND/PRODUCT COMPARISON
10.8 COMPANY EVALUATION MATRIX: KEY PLAYERS, 2023
10.8.1 STARS
10.8.2 EMERGING LEADERS
10.8.3 PERVASIVE PLAYERS
10.8.4 PARTICIPANTS
10.8.5 COMPANY FOOTPRINT
10.9 COMPANY EVALUATION MATRIX: STARTUPS/SMES, 2023
10.9.1 PROGRESSIVE COMPANIES
10.9.2 RESPONSIVE COMPANIES
10.9.3 DYNAMIC COMPANIES
10.9.4 STARTING BLOCKS
10.9.5 COMPETITIVE BENCHMARKING
10.10 COMPETITIVE SCENARIO
10.10.1 PRODUCT LAUNCHES/DEVELOPMENTS
10.10.2 DEALS
10.10.3 EXPANSIONS
10.10.4 OTHER DEVELOPMENTS
11 COMPANY PROFILES (Page No. - 223)
11.1 KEY PLAYERS
11.1.1 BASF SE
11.1.1.1 Business overview
11.1.1.2 Products/Solutions/Services offered
11.1.1.3 Recent developments
11.1.1.4 MnM view
11.1.1.4.1 Right to win
11.1.1.4.2 Strategic choices
11.1.1.4.3 Weaknesses and competitive threats
11.1.2 THE LUBRIZOL CORPORATION
11.1.2.1 Business overview
11.1.2.2 Products/Solutions/Services offered
11.1.2.3 Recent developments
11.1.2.4 MnM view
11.1.2.4.1 Right to win
11.1.2.4.2 Strategic choices
11.1.2.4.3 Weaknesses and competitive threats
11.1.3 DOW
11.1.3.1 Business overview
11.1.3.2 Products/Solutions/Services offered
11.1.3.3 Recent developments
11.1.3.4 MnM view
11.1.3.4.1 Right to win
11.1.3.4.2 Strategic choices
11.1.3.4.3 Weaknesses and competitive threats
11.1.4 COVESTRO AG
11.1.4.1 Business overview
11.1.4.2 Products/Solutions/Services offered
11.1.4.3 Recent developments
11.1.4.4 MnM view
11.1.4.4.1 Right to win
11.1.4.4.2 Strategic choices
11.1.4.4.3 Weaknesses and competitive threats
11.1.5 WESTLAKE CORPORATION
11.1.5.1 Business overview
11.1.5.2 Products/Solutions/Services offered
11.1.5.3 MnM view
11.1.5.3.1 Right to win
11.1.5.3.2 Strategic choices
11.1.5.3.3 Weaknesses and competitive threats
11.1.6 ARKEMA
11.1.6.1 Business overview
11.1.6.2 Products/Solutions/Services offered
11.1.6.3 Recent developments
11.1.6.4 MnM view
11.1.6.4.1 Right to win
11.1.6.4.2 Strategic choices
11.1.6.4.3 Weaknesses and competitive threats
11.1.7 DIC CORPORATION
11.1.7.1 Business overview
11.1.7.2 Products/Solutions/Services offered
11.1.7.3 Recent developments
11.1.7.4 MnM view
11.1.7.4.1 Right to win
11.1.7.4.2 Strategic choices
11.1.7.4.3 Weaknesses and competitive threats
11.1.8 ALLNEX GMBH
11.1.8.1 Business overview
11.1.8.2 Products/Solutions/Services offered
11.1.8.3 Recent developments
11.1.8.4 MnM view
11.1.8.4.1 Right to win
11.1.8.4.2 Strategic choices
11.1.8.4.3 Weaknesses and competitive threats
11.1.9 ADEKA CORPORATION
11.1.9.1 Business overview
11.1.9.2 Products/Solutions/Services offered
11.1.9.3 MnM view
11.1.9.3.1 Right to win
11.1.9.3.2 Strategic choices
11.1.9.3.3 Weaknesses and competitive threats
11.1.10 OLIN CORPORATION
11.1.10.1 Business overview
11.1.10.2 Products/Solutions/Services offered
11.1.10.3 MnM view
11.1.10.3.1 Right to win
11.1.10.3.2 Strategic choices
11.1.10.3.3 Weaknesses and competitive threats
11.2 OTHER PLAYERS
11.2.1 ALBERDINGK BOLEY GMBH
11.2.2 ADITYA BIRLA CHEMICALS (THAILAND) PVT. LTD
11.2.3 BELIKE CHEMICAL COMPANY LTD.
11.2.4 BOND POLYMERS INTERNATIONAL
11.2.5 STAHL HOLDINGS B.V.
11.2.6 GREAT EASTERN RESINS INDUSTRIAL CO. LTD.
11.2.7 SYNTHESIA TECHNOLOGY GROUP
11.2.8 KUKDO CHEMICAL CO., LTD.
11.2.9 LEUNA-HARZE GMBH
11.2.10 SYNTHOMER PLC
11.2.11 DAIKIN INDUSTRIES LTD.
11.2.12 GELLNER INDUSTRIAL, LLC
11.2.13 ARTIENCE CO., LTD.
11.2.14 SIMAB RESIN COMPANY
11.2.15 REICHHOLD LLC 2
12 ADJACENT & RELATED MARKET (Page No. - 276)
12.1 INTRODUCTION
12.2 EPOXY RESIN MARKET
12.2.1 MARKET DEFINITION
12.2.2 MARKET OVERVIEW
13 APPENDIX (Page No. - 280)
13.1 DISCUSSION GUIDE
13.2 KNOWLEDGESTORE: MARKETSANDMARKETS’ SUBSCRIPTION PORTAL
13.3 CUSTOMIZATION OPTIONS
13.4 RELATED REPORTS
13.5 AUTHOR DETAILS
LIST OF TABLES (362 TABLES)
TABLE 1 AVERAGE SELLING PRICE OF KEY PLAYERS, BY TOP 3 TYPES (USD/KG)
TABLE 2 AVERAGE SELLING PRICE OF WATER-BASED RESINS, BY REGION, 2023−2029 (USD/KG)
TABLE 3 WATER-BASED RESINS MARKET: ROLE IN ECOSYSTEM
TABLE 4 LIST OF MAJOR PATENTS FOR WATER-BASED RESINS
TABLE 5 DETAILED LIST OF CONFERENCES & EVENTS, 2024–2025
TABLE 6 NORTH AMERICA: REGULATORY BODIES, GOVERNMENT AGENCIES, AND OTHER ORGANIZATIONS
TABLE 7 EUROPE: REGULATORY BODIES, GOVERNMENT AGENCIES, AND OTHER ORGANIZATIONS
TABLE 8 ASIA PACIFIC: REGULATORY BODIES, GOVERNMENT AGENCIES, AND OTHER ORGANIZATIONS
TABLE 9 WATER-BASED RESINS MARKET: PORTER'S FIVE FORCES ANALYSIS
TABLE 10 INFLUENCE OF STAKEHOLDERS ON BUYING PROCESS
TABLE 11 KEY BUYING CRITERIA FOR WATER-BASED RESINS IN TOP END-USE INDUSTRIES
TABLE 12 WORLD GDP GROWTH PROJECTION, 2021–2028 (USD TRILLION)
TABLE 13 CONSTRUCTION INDUSTRY'S CONTRIBUTION TO GDP, BY KEY COUNTRIES (2021)
TABLE 14 GLOBAL AUTOMOBILE PRODUCTION (UNIT) AND GROWTH, BY COUNTRY (2021 VS. 2022)
TABLE 15 WATER-BASED RESINS MARKET, BY APPLICATION, 2020–2022 (USD MILLION)
TABLE 16 WATER-BASED RESINS MARKET, BY APPLICATION, 2023–2029 (USD MILLION)
TABLE 17 WATER-BASED RESINS MARKET, BY APPLICATION, 2020–2022 (KILOTON)
TABLE 18 WATER-BASED RESINS MARKET, BY APPLICATION, 2023–2029 (KILOTON)
TABLE 19 WATER-BASED RESINS MARKET, BY TYPE, 2020–2022 (USD MILLION)
TABLE 20 WATER-BASED RESINS MARKET, BY TYPE, 2023–2029 (USD MILLION)
TABLE 21 WATER-BASED RESINS MARKET, BY TYPE, 2020–2022 (KILOTON)
TABLE 22 WATER-BASED RESINS MARKET, BY TYPE, 2023–2029 (KILOTON)
TABLE 23 ASIA PACIFIC: WATER-BASED RESINS MARKET, BY COUNTRY, 2020–2022 (USD MILLION)
TABLE 24 ASIA PACIFIC: WATER-BASED RESINS MARKET, BY COUNTRY, 2023–2029 (USD MILLION)
TABLE 25 ASIA PACIFIC: WATER-BASED RESINS MARKET, BY COUNTRY, 2020–2022 (KILOTON)
TABLE 26 ASIA PACIFIC: WATER-BASED RESINS MARKET, BY COUNTRY, 2023–2029 (KILOTON)
TABLE 27 ASIA PACIFIC: WATER-BASED RESINS MARKET, BY TYPE, 2020–2022 (USD MILLION)
TABLE 28 ASIA PACIFIC: WATER-BASED RESINS MARKET, BY TYPE, 2023–2029 (USD MILLION)
TABLE 29 ASIA PACIFIC: WATER-BASED RESINS MARKET, BY TYPE, 2020–2022 (KILOTON)
TABLE 30 ASIA PACIFIC: WATER-BASED RESINS MARKET, BY TYPE, 2023–2029 (KILOTON)
TABLE 31 ASIA PACIFIC: WATER-BASED RESINS MARKET, BY APPLICATION, 2020–2022 (USD MILLION)
TABLE 32 ASIA PACIFIC: WATER-BASED RESINS MARKET, BY APPLICATION, 2023–2029 (USD MILLION)
TABLE 33 ASIA PACIFIC: WATER-BASED RESINS MARKET, BY APPLICATION, 2020–2022 (KILOTON)
TABLE 34 ASIA PACIFIC: WATER-BASED RESINS MARKET, BY APPLICATION, 2023–2029 (KILOTON)
TABLE 35 CHINA: WATER-BASED RESINS MARKET, BY TYPE, 2020–2022 (USD MILLION)
TABLE 36 CHINA: WATER-BASED RESINS MARKET, BY TYPE 2023–2029 (USD MILLION)
TABLE 37 CHINA: WATER-BASED RESINS MARKET, BY TYPE, 2020–2022 (KILOTON)
TABLE 38 CHINA: WATER-BASED RESINS MARKET, BY TYPE, 2023–2029 (KILOTON)
TABLE 39 CHINA: WATER-BASED RESINS MARKET, BY APPLICATION, 2020–2022 (USD MILLION)
TABLE 40 CHINA: WATER-BASED RESINS MARKET, BY APPLICATION, 2023–2029 (USD MILLION)
TABLE 41 CHINA: WATER-BASED RESINS MARKET, BY APPLICATION, 2020–2022 (KILOTON)
TABLE 42 CHINA: WATER-BASED RESINS MARKET, BY APPLICATION, 2023–2029 (KILOTON)
TABLE 43 JAPAN: WATER-BASED RESINS MARKET, BY TYPE, 2020–2022 (USD MILLION)
TABLE 44 JAPAN: WATER-BASED RESINS MARKET, BY TYPE, 2023–2029 (USD MILLION)
TABLE 45 JAPAN: WATER-BASED RESINS MARKET, BY TYPE, 2020–2022 (KILOTON)
TABLE 46 JAPAN: WATER-BASED RESINS MARKET, BY TYPE, 2023–2029 (KILOTON)
TABLE 47 JAPAN: WATER-BASED RESINS MARKET, BY APPLICATION, 2020–2022 (USD MILLION)
TABLE 48 JAPAN: WATER-BASED RESINS MARKET, BY APPLICATION, 2023–2029 (USD MILLION)
TABLE 49 JAPAN: WATER-BASED RESINS MARKET, BY APPLICATION, 2020–2022 (KILOTON)
TABLE 50 JAPAN: WATER-BASED RESINS MARKET, BY APPLICATION, 2023–2029 (KILOTON)
TABLE 51 INDIA: WATER-BASED RESINS MARKET, BY TYPE, 2020–2022 (USD MILLION)
TABLE 52 INDIA: WATER-BASED RESINS MARKET, BY TYPE, 2023–2029 (USD MILLION)
TABLE 53 INDIA: WATER-BASED RESINS MARKET, BY TYPE, 2020–2022 (KILOTON)
TABLE 54 INDIA: WATER-BASED RESINS MARKET, BY TYPE, 2023–2029 (KILOTON)
TABLE 55 INDIA: WATER-BASED RESINS MARKET, BY APPLICATION, 2020–2022 (USD MILLION)
TABLE 56 INDIA: WATER-BASED RESINS MARKET, BY APPLICATION, 2023–2029 (USD MILLION)
TABLE 57 INDIA: WATER-BASED RESINS MARKET, BY APPLICATION, 2020–2022 (KILOTON)
TABLE 58 INDIA: WATER-BASED RESINS MARKET, BY APPLICATION, 2023–2029 (KILOTON)
TABLE 59 SOUTH KOREA: WATER-BASED RESINS MARKET, BY TYPE, 2020–2022 (USD MILLION)
TABLE 60 SOUTH KOREA: WATER-BASED RESINS MARKET, BY TYPE, 2023–2029 (USD MILLION)
TABLE 61 SOUTH KOREA: WATER-BASED RESINS MARKET, BY TYPE, 2020–2022 (KILOTON)
TABLE 62 SOUTH KOREA: WATER-BASED RESINS MARKET, BY TYPE, 2023–2029 (KILOTON)
TABLE 63 SOUTH KOREA: WATER-BASED RESINS MARKET, BY APPLICATION, 2020–2022 (USD MILLION)
TABLE 64 SOUTH KOREA: WATER-BASED RESINS MARKET, BY APPLICATION, 2023–2029 (USD MILLION)
TABLE 65 SOUTH KOREA: WATER-BASED RESINS MARKET, BY APPLICATION, 2020–2022 (KILOTON)
TABLE 66 SOUTH KOREA: WATER-BASED RESINS MARKET, BY APPLICATION, 2023–2029 (KILOTON)
TABLE 67 INDONESIA: WATER-BASED RESINS MARKET, BY TYPE, 2020–2022 (USD MILLION)
TABLE 68 INDONESIA: WATER-BASED RESINS MARKET, BY TYPE, 2023–2029 (USD MILLION)
TABLE 69 INDONESIA: WATER-BASED RESINS MARKET, BY TYPE, 2020–2022 (KILOTON)
TABLE 70 INDONESIA: WATER-BASED RESINS MARKET, BY TYPE, 2023–2029 (KILOTON)
TABLE 71 INDONESIA: WATER-BASED RESINS MARKET, BY APPLICATION, 2020–2022 (USD MILLION)
TABLE 72 INDONESIA: WATER-BASED RESINS MARKET, BY APPLICATION, 2023–2029 (USD MILLION)
TABLE 73 INDONESIA: WATER-BASED RESINS MARKET, BY APPLICATION, 2020–2022 (KILOTON)
TABLE 74 INDONESIA: WATER-BASED RESINS MARKET, BY APPLICATION, 2023–2029 (KILOTON)
TABLE 75 REST OF ASIA PACIFIC: WATER-BASED RESINS MARKET, BY TYPE, 2020–2022 (USD MILLION)
TABLE 76 REST OF ASIA PACIFIC: WATER-BASED RESINS MARKET, BY TYPE, 2023–2029 (USD MILLION)
TABLE 77 REST OF ASIA PACIFIC: WATER-BASED RESINS MARKET, BY TYPE, 2020–2022 (KILOTON)
TABLE 78 REST OF ASIA PACIFIC: WATER-BASED RESINS MARKET, BY TYPE, 2023–2029 (KILOTON)
TABLE 79 REST OF ASIA PACIFIC: WATER-BASED RESINS MARKET, BY APPLICATION, 2020–2022 (USD MILLION)
TABLE 80 REST OF ASIA PACIFIC: WATER-BASED RESINS MARKET, BY APPLICATION, 2023–2029 (USD MILLION)
TABLE 81 REST OF ASIA PACIFIC: WATER-BASED RESINS MARKET, BY APPLICATION, 2020–2022 (KILOTON)
TABLE 82 REST OF ASIA PACIFIC: WATER-BASED RESINS MARKET, BY APPLICATION, 2023–2029 (KILOTON)
TABLE 83 NORTH AMERICA: WATER-BASED RESINS MARKET, BY COUNTRY, 2020–2022 (USD MILLION)
TABLE 84 NORTH AMERICA: WATER-BASED RESINS MARKET, BY COUNTRY, 2023–2029 (USD MILLION)
TABLE 85 NORTH AMERICA: WATER-BASED RESINS MARKET, BY COUNTRY, 2020–2022 (KILOTON)
TABLE 86 NORTH AMERICA: WATER-BASED RESINS MARKET, BY COUNTRY, 2023–2029 (KILOTON)
TABLE 87 NORTH AMERICA: WATER-BASED RESINS MARKET, BY TYPE, 2020–2022 (USD MILLION)
TABLE 88 NORTH AMERICA: WATER-BASED RESINS MARKET, BY TYPE, 2023–2029 (USD MILLION)
TABLE 89 NORTH AMERICA: WATER-BASED RESINS MARKET, BY TYPE, 2020–2022 (KILOTON)
TABLE 90 NORTH AMERICA: WATER-BASED RESINS MARKET, BY TYPE, 2023–2029 (KILOTON)
TABLE 91 NORTH AMERICA: WATER-BASED RESINS MARKET, BY APPLICATION, 2020–2022 (USD MILLION)
TABLE 92 NORTH AMERICA: WATER-BASED RESINS MARKET, BY APPLICATION, 2023–2029 (USD MILLION)
TABLE 93 NORTH AMERICA: WATER-BASED RESINS MARKET, BY APPLICATION, 2020–2022 (KILOTON)
TABLE 94 NORTH AMERICA: WATER-BASED RESINS MARKET, BY APPLICATION 2023–2029 (KILOTON)
TABLE 95 US: WATER-BASED RESINS MARKET, BY TYPE, 2020–2022 (USD MILLION)
TABLE 96 US: WATER-BASED RESINS MARKET, BY TYPE, 2023–2029 (USD MILLION)
TABLE 97 US: WATER-BASED RESINS MARKET, BY TYPE, 2020–2022 (KILOTON)
TABLE 98 US: WATER-BASED RESINS MARKET, BY TYPE, 2023–2029 (KILOTON)
TABLE 99 US: WATER-BASED RESINS MARKET, BY APPLICATION, 2020–2022 (USD MILLION)
TABLE 100 US: WATER-BASED RESINS MARKET, BY APPLICATION, 2023–2029 (USD MILLION)
TABLE 101 US: WATER-BASED RESINS MARKET, BY APPLICATION, 2020–2022 (KILOTON)
TABLE 102 US: WATER-BASED RESINS MARKET, BY APPLICATION, 2023–2029 (KILOTON)
TABLE 103 CANADA: WATER-BASED RESINS MARKET, BY TYPE, 2020–2022 (USD MILLION)
TABLE 104 CANADA: WATER-BASED RESINS MARKET, BY TYPE, 2023–2029 (USD MILLION)
TABLE 105 CANADA: WATER-BASED RESINS MARKET, BY TYPE, 2020–2022 (KILOTON)
TABLE 106 CANADA: WATER-BASED RESINS MARKET, BY TYPE, 2023–2029 (KILOTON)
TABLE 107 CANADA: WATER-BASED RESINS MARKET, BY APPLICATION, 2020–2022 (USD MILLION)
TABLE 108 CANADA: WATER-BASED RESINS MARKET, BY APPLICATION, 2023–2029 (USD MILLION)
TABLE 109 CANADA: WATER-BASED RESINS MARKET, BY APPLICATION, 2020–2022 (KILOTON)
TABLE 110 CANADA: WATER-BASED RESINS MARKET, BY APPLICATION, 2023–2029 (KILOTON)
TABLE 111 MEXICO: WATER-BASED RESINS MARKET, BY TYPE, 2020–2022 (USD MILLION)
TABLE 112 MEXICO: WATER-BASED RESINS MARKET, BY TYPE, 2023–2029 (USD MILLION)
TABLE 113 MEXICO: WATER-BASED RESINS MARKET, BY TYPE, 2020–2022 (KILOTON)
TABLE 114 MEXICO: WATER-BASED RESINS MARKET, BY TYPE, 2023–2029 (KILOTON)
TABLE 115 MEXICO: WATER-BASED RESINS MARKET, BY APPLICATION, 2020–2022 (USD MILLION)
TABLE 116 MEXICO: WATER-BASED RESINS MARKET, BY APPLICATION, 2023–2029 (USD MILLION)
TABLE 117 MEXICO: WATER-BASED RESINS MARKET, BY APPLICATION, 2020–2022 (KILOTON)
TABLE 118 MEXICO: WATER-BASED RESINS MARKET, BY APPLICATION, 2023–2029 (KILOTON)
TABLE 119 EUROPE: WATER-BASED RESINS MARKET, BY COUNTRY, 2020–2022 (USD MILLION)
TABLE 120 EUROPE: WATER-BASED RESINS MARKET, BY COUNTRY, 2023–2029 (USD MILLION)
TABLE 121 EUROPE: WATER-BASED RESINS MARKET, BY COUNTRY, 2020–2022 (KILOTON)
TABLE 122 EUROPE: WATER-BASED RESINS MARKET, BY COUNTRY, 2023–2029 (KILOTON)
TABLE 123 EUROPE: WATER-BASED RESINS MARKET, BY TYPE, 2020–2022 (USD MILLION)
TABLE 124 EUROPE: WATER-BASED RESINS MARKET, BY TYPE, 2023–2029 (USD MILLION)
TABLE 125 EUROPE: WATER-BASED RESINS MARKET, BY TYPE, 2020–2022 (KILOTON)
TABLE 126 EUROPE: WATER-BASED RESINS MARKET, BY TYPE, 2023–2029 (KILOTON)
TABLE 127 EUROPE: WATER-BASED RESINS MARKET, BY APPLICATION, 2020–2022 (USD MILLION)
TABLE 128 EUROPE: WATER-BASED RESINS MARKET, BY APPLICATION, 2023–2029 (USD MILLION)
TABLE 129 EUROPE: WATER-BASED RESINS MARKET, BY APPLICATION, 2020–2022 (KILOTON)
TABLE 130 EUROPE: WATER-BASED RESINS MARKET, BY APPLICATION, 2023–2029 (KILOTON)
TABLE 131 GERMANY: WATER-BASED RESINS MARKET, BY TYPE, 2020–2022 (USD MILLION)
TABLE 132 GERMANY: WATER-BASED RESINS MARKET, BY TYPE, 2023–2029 (USD MILLION)
TABLE 133 GERMANY: WATER-BASED RESINS MARKET, BY TYPE, 2020–2022 (KILOTON)
TABLE 134 GERMANY: WATER-BASED RESINS MARKET, BY TYPE, 2023–2029 (KILOTON)
TABLE 135 GERMANY: WATER-BASED RESINS MARKET, BY APPLICATION, 2020–2022 (USD MILLION)
TABLE 136 GERMANY: WATER-BASED RESINS MARKET, BY APPLICATION, 2023–2029 (USD MILLION)
TABLE 137 GERMANY: WATER-BASED RESINS MARKET, BY APPLICATION, 2020–2022 (KILOTON)
TABLE 138 GERMANY: WATER-BASED RESINS MARKET, BY APPLICATION, 2023–2029 (KILOTON)
TABLE 139 FRANCE: WATER-BASED RESINS MARKET, BY TYPE, 2020–2022 (USD MILLION)
TABLE 140 FRANCE: WATER-BASED RESINS MARKET, BY TYPE, 2023–2029 (USD MILLION)
TABLE 141 FRANCE: WATER-BASED RESINS MARKET, BY TYPE, 2020–2022 (KILOTON)
TABLE 142 FRANCE: WATER-BASED RESINS MARKET, BY TYPE, 2023–2029 (KILOTON)
TABLE 143 FRANCE: WATER-BASED RESINS MARKET, BY APPLICATION, 2020–2022 (USD MILLION)
TABLE 144 FRANCE: WATER-BASED RESINS MARKET, BY APPLICATION, 2023–2029 (USD MILLION)
TABLE 145 FRANCE: WATER-BASED RESINS MARKET, BY APPLICATION, 2020–2022 (KILOTON)
TABLE 146 FRANCE: WATER-BASED RESINS MARKET, BY APPLICATION, 2023–2029 (KILOTON)
TABLE 147 UK: WATER-BASED RESINS MARKET, BY TYPE, 2020–2022 (USD MILLION)
TABLE 148 UK: WATER-BASED RESINS MARKET, BY TYPE, 2023–2029 (USD MILLION)
TABLE 149 UK: WATER-BASED RESINS MARKET, BY TYPE, 2020–2022 (KILOTON)
TABLE 150 UK: WATER-BASED RESINS MARKET, BY TYPE, 2023–2029 (KILOTON)
TABLE 151 UK: WATER-BASED RESINS MARKET, BY APPLICATION, 2020–2022 (USD MILLION)
TABLE 152 UK: WATER-BASED RESINS MARKET, BY APPLICATION, 2023–2029 (USD MILLION)
TABLE 153 UK: WATER-BASED RESINS MARKET, BY APPLICATION, 2020–2022 (KILOTON)
TABLE 154 UK: WATER-BASED RESINS MARKET, BY APPLICATION, 2023–2029 (KILOTON)
TABLE 155 ITALY: WATER-BASED RESINS MARKET, BY TYPE, 2020–2022 (USD MILLION)
TABLE 156 ITALY: WATER-BASED RESINS MARKET, BY TYPE, 2023–2029 (USD MILLION)
TABLE 157 ITALY: WATER-BASED RESINS MARKET, BY TYPE, 2020–2022 (KILOTON)
TABLE 158 ITALY: WATER-BASED RESINS MARKET, BY TYPE, 2023–2029 (KILOTON)
TABLE 159 ITALY: WATER-BASED RESINS MARKET, BY APPLICATION, 2020–2022 (USD MILLION)
TABLE 160 ITALY: WATER-BASED RESINS MARKET, BY APPLICATION, 2023–2029 (USD MILLION)
TABLE 161 ITALY: WATER-BASED RESINS MARKET, BY APPLICATION, 2020–2022 (KILOTON)
TABLE 162 ITALY: WATER-BASED RESINS MARKET, BY APPLICATION, 2023–2029 (KILOTON)
TABLE 163 SPAIN: WATER-BASED RESINS MARKET, BY TYPE, 2020–2022 (USD MILLION)
TABLE 164 SPAIN: WATER-BASED RESINS MARKET, BY TYPE, 2023–2029 (USD MILLION)
TABLE 165 SPAIN: WATER-BASED RESINS MARKET, BY TYPE, 2020–2022 (KILOTON)
TABLE 166 SPAIN: WATER-BASED RESINS MARKET, BY TYPE, 2023–2029 (KILOTON)
TABLE 167 SPAIN: WATER-BASED RESINS MARKET, BY APPLICATION, 2020–2022 (USD MILLION)
TABLE 168 SPAIN: WATER-BASED RESINS MARKET, BY APPLICATION, 2023–2029 (USD MILLION)
TABLE 169 SPAIN: WATER-BASED RESINS MARKET, BY APPLICATION, 2020–2022 (KILOTON)
TABLE 170 SPAIN: WATER-BASED RESINS MARKET, BY APPLICATION, 2023–2029 (KILOTON)
TABLE 171 RUSSIA: WATER-BASED RESINS MARKET, BY TYPE, 2020–2022 (USD MILLION)
TABLE 172 RUSSIA: WATER-BASED RESINS MARKET, BY TYPE, 2023–2029 (USD MILLION)
TABLE 173 RUSSIA: WATER-BASED RESINS MARKET, BY TYPE, 2020–2022 (KILOTON)
TABLE 174 RUSSIA: WATER-BASED RESINS MARKET, BY TYPE, 2023–2029 (KILOTON)
TABLE 175 RUSSIA: WATER-BASED RESINS MARKET, BY APPLICATION, 2020–2022 (USD MILLION)
TABLE 176 RUSSIA: WATER-BASED RESINS MARKET, BY APPLICATION, 2023–2029 (USD MILLION)
TABLE 177 RUSSIA: WATER-BASED RESINS MARKET, BY APPLICATION, 2020–2022 (KILOTON)
TABLE 178 RUSSIA: WATER-BASED RESINS MARKET, BY APPLICATION, 2023–2029 (KILOTON)
TABLE 179 TURKEY: WATER-BASED RESINS MARKET, BY TYPE, 2020–2022 (USD MILLION)
TABLE 180 TURKEY: WATER-BASED RESINS MARKET, BY TYPE, 2023–2029 (USD MILLION)
TABLE 181 TURKEY: WATER-BASED RESINS MARKET, BY TYPE, 2020–2022 (KILOTON)
TABLE 182 TURKEY: WATER-BASED RESINS MARKET, BY TYPE, 2023–2029 (KILOTON)
TABLE 183 TURKEY: WATER-BASED RESINS MARKET, BY APPLICATION, 2020–2022 (USD MILLION)
TABLE 184 TURKEY: WATER-BASED RESINS MARKET, BY APPLICATION, 2023–2029 (USD MILLION)
TABLE 185 TURKEY: WATER-BASED RESINS MARKET, BY APPLICATION, 2020–2022 (KILOTON)
TABLE 186 TURKEY: WATER-BASED RESINS MARKET, BY APPLICATION, 2023–2029 (KILOTON)
TABLE 187 REST OF EUROPE: WATER-BASED RESINS MARKET, BY TYPE, 2020–2022 (USD MILLION)
TABLE 188 REST OF EUROPE: WATER-BASED RESINS MARKET, BY TYPE, 2023–2029 (USD MILLION)
TABLE 189 REST OF EUROPE: WATER-BASED RESINS MARKET, BY TYPE, 2020–2022 (KILOTON)
TABLE 190 REST OF EUROPE: WATER-BASED RESINS MARKET, BY TYPE, 2023–2029 (KILOTON)
TABLE 191 REST OF EUROPE: WATER-BASED RESINS MARKET, BY APPLICATION, 2020–2022 (USD MILLION)
TABLE 192 REST OF EUROPE: WATER-BASED RESINS MARKET, BY APPLICATION, 2023–2029 (USD MILLION)
TABLE 193 REST OF EUROPE: WATER-BASED RESINS MARKET, BY APPLICATION, 2020–2022 (KILOTON)
TABLE 194 REST OF EUROPE: WATER-BASED RESINS MARKET, BY APPLICATION, 2023–2029 (KILOTON)
TABLE 195 MIDDLE EAST & AFRICA: WATER-BASED RESINS MARKET, BY COUNTRY, 2020–2022 (USD MILLION)
TABLE 196 MIDDLE EAST & AFRICA: WATER-BASED RESINS MARKET, BY COUNTRY, 2023–2029 (USD MILLION)
TABLE 197 MIDDLE EAST & AFRICA: WATER-BASED RESINS MARKET, BY COUNTRY, 2020–2022 (KILOTON)
TABLE 198 MIDDLE EAST & AFRICA: WATER-BASED RESINS MARKET, BY COUNTRY, 2023–2029 (KILOTON)
TABLE 199 MIDDLE EAST & AFRICA: WATER-BASED RESINS MARKET, BY TYPE, 2020–2022 (USD MILLION)
TABLE 200 MIDDLE EAST & AFRICA: WATER-BASED RESINS MARKET, BY TYPE, 2023–2029 (USD MILLION)
TABLE 201 MIDDLE EAST & AFRICA: WATER-BASED RESINS MARKET, BY TYPE, 2020–2022 (KILOTON)
TABLE 202 MIDDLE EAST & AFRICA: WATER-BASED RESINS MARKET, BY TYPE, 2023–2029 (KILOTON)
TABLE 203 MIDDLE EAST & AFRICA: WATER-BASED RESINS MARKET, BY APPLICATION, 2020–2022 (USD MILLION)
TABLE 204 MIDDLE EAST & AFRICA: WATER-BASED RESINS MARKET, BY APPLICATION, 2023–2029 (USD MILLION)
TABLE 205 MIDDLE EAST & AFRICA: WATER-BASED RESINS MARKET, BY APPLICATION, 2020–2022 (KILOTON)
TABLE 206 MIDDLE EAST & AFRICA: WATER-BASED RESINS MARKET, BY APPLICATION, 2023–2029 (KILOTON)
TABLE 207 GCC COUNTRIES: WATER-BASED RESINS MARKET, BY TYPE, 2020–2022 (USD MILLION)
TABLE 208 GCC COUNTRIES: WATER-BASED RESINS MARKET, BY TYPE, 2023–2029 (USD MILLION)
TABLE 209 GCC COUNTRIES: WATER-BASED RESINS MARKET, BY TYPE, 2020–2022 (KILOTON)
TABLE 210 GCC COUNTRIES: WATER-BASED RESINS MARKET, BY TYPE, 2023–2029 (KILOTON)
TABLE 211 GCC COUNTRIES: WATER-BASED RESINS MARKET, BY APPLICATION, 2020–2022 (USD MILLION)
TABLE 212 GCC COUNTRIES: WATER-BASED RESINS MARKET, BY APPLICATION, 2023–2029 (USD MILLION)
TABLE 213 GCC COUNTRIES: WATER-BASED RESINS MARKET, BY APPLICATION, 2020–2022 (KILOTON)
TABLE 214 GCC COUNTRIES: WATER-BASED RESINS MARKET, BY APPLICATION, 2023–2029 (KILOTON)
TABLE 215 SAUDI ARABIA: WATER-BASED RESINS MARKET, BY TYPE, 2020–2022 (USD MILLION)
TABLE 216 SAUDI ARABIA: WATER-BASED RESINS MARKET, BY TYPE, 2023–2029 (USD MILLION)
TABLE 217 SAUDI ARABIA: WATER-BASED RESINS MARKET, BY TYPE, 2020–2022 (KILOTON)
TABLE 218 SAUDI ARABIA: WATER-BASED RESINS MARKET, BY TYPE, 2023–2029 (KILOTON)
TABLE 219 SAUDI ARABIA: WATER-BASED RESINS MARKET, BY APPLICATION, 2020–2022 (USD MILLION)
TABLE 220 SAUDI ARABIA: WATER-BASED RESINS MARKET, BY APPLICATION, 2023–2029 (USD MILLION)
TABLE 221 SAUDI ARABIA: WATER-BASED RESINS MARKET, BY APPLICATION, 2020–2022 (KILOTON)
TABLE 222 SAUDI ARABIA: WATER-BASED RESINS MARKET, BY APPLICATION, 2023–2029 (KILOTON)
TABLE 223 UAE: WATER-BASED RESINS MARKET, BY TYPE, 2020–2022 (USD MILLION)
TABLE 224 UAE: WATER-BASED RESINS MARKET, BY TYPE, 2023–2029 (USD MILLION)
TABLE 225 UAE: WATER-BASED RESINS MARKET, BY TYPE, 2020–2022 (KILOTON)
TABLE 226 UAE: WATER-BASED RESINS MARKET, BY TYPE, 2023–2029 (KILOTON)
TABLE 227 UAE: WATER-BASED RESINS MARKET, BY APPLICATION, 2020–2022 (USD MILLION)
TABLE 228 UAE: WATER-BASED RESINS MARKET, BY APPLICATION, 2023–2029 (USD MILLION)
TABLE 229 UAE: WATER-BASED RESINS MARKET, BY APPLICATION, 2020–2022 (KILOTON)
TABLE 230 UAE: WATER-BASED RESINS MARKET, BY APPLICATION, 2023–2029 (KILOTON)
TABLE 231 REST OF GCC COUNTRIES: WATER-BASED RESINS MARKET, BY TYPE, 2020–2022 (USD MILLION)
TABLE 232 REST OF GCC COUNTRIES: WATER-BASED RESINS MARKET, BY TYPE, 2023–2029 (USD MILLION)
TABLE 233 REST OF GCC COUNTRIES: WATER-BASED RESINS MARKET, BY TYPE, 2020–2022 (KILOTON)
TABLE 234 REST OF GCC COUNTRIES: WATER-BASED RESINS MARKET, BY TYPE, 2023–2029 (KILOTON)
TABLE 235 REST OF GCC COUNTRIES: WATER-BASED RESINS MARKET, BY APPLICATION, 2020–2022 (USD MILLION)
TABLE 236 REST OF GCC COUNTRIES: WATER-BASED RESINS MARKET, BY APPLICATION, 2023–2029 (USD MILLION)
TABLE 237 REST OF GCC COUNTRIES: WATER-BASED RESINS MARKET, BY APPLICATION, 2020–2022 (KILOTON)
TABLE 238 REST OF GCC COUNTRIES: WATER-BASED RESINS MARKET, BY APPLICATION, 2023–2029 (KILOTON)
TABLE 239 SOUTH AFRICA: WATER-BASED RESINS MARKET, BY TYPE, 2020–2022 (USD MILLION)
TABLE 240 SOUTH AFRICA: WATER-BASED RESINS MARKET, BY TYPE, 2023–2029 (USD MILLION)
TABLE 241 SOUTH AFRICA: WATER-BASED RESINS MARKET, BY TYPE, 2020–2022 (KILOTON)
TABLE 242 SOUTH AFRICA: WATER-BASED RESINS MARKET, BY TYPE, 2023–2029 (KILOTON)
TABLE 243 SOUTH AFRICA: WATER-BASED RESINS MARKET, BY APPLICATION, 2020–2022 (USD MILLION)
TABLE 244 SOUTH AFRICA: WATER-BASED RESINS MARKET, BY APPLICATION, 2023–2029 (USD MILLION)
TABLE 245 SOUTH AFRICA: WATER-BASED RESINS MARKET, BY APPLICATION, 2020–2022 (KILOTON)
TABLE 246 SOUTH AFRICA: WATER-BASED RESINS MARKET, BY APPLICATION, 2023–2029 (KILOTON)
TABLE 247 REST OF MIDDLE EAST & AFRICA: WATER-BASED RESINS MARKET, BY TYPE, 2020–2022 (USD MILLION)
TABLE 248 REST OF MIDDLE EAST & AFRICA: WATER-BASED RESINS MARKET, BY TYPE, 2023–2029 (USD MILLION)
TABLE 249 REST OF MIDDLE EAST & AFRICA: WATER-BASED RESINS MARKET, BY TYPE, 2020–2022 (KILOTON)
TABLE 250 REST OF MIDDLE EAST & AFRICA: WATER-BASED RESINS MARKET, BY TYPE, 2023–2029 (KILOTON)
TABLE 251 REST OF MIDDLE EAST & AFRICA: WATER-BASED RESINS MARKET, BY APPLICATION, 2020–2022 (USD MILLION)
TABLE 252 REST OF MIDDLE EAST & AFRICA: WATER-BASED RESINS MARKET, BY APPLICATION, 2023–2029 (USD MILLION)
TABLE 253 REST OF MIDDLE EAST & AFRICA: WATER-BASED RESINS MARKET, BY APPLICATION, 2020–2022 (KILOTON)
TABLE 254 REST OF MIDDLE EAST & AFRICA: WATER-BASED RESINS MARKET, BY APPLICATION, 2023–2029 (KILOTON)
TABLE 255 SOUTH AMERICA: WATER-BASED RESINS MARKET, BY COUNTRY, 2020–2022 (USD MILLION)
TABLE 256 SOUTH AMERICA: WATER-BASED RESINS MARKET, BY COUNTRY, 2023–2029 (USD MILLION)
TABLE 257 SOUTH AMERICA: WATER-BASED RESINS MARKET, BY COUNTRY, 2020–2022 (KILOTON)
TABLE 258 SOUTH AMERICA: WATER-BASED RESINS MARKET, BY COUNTRY, 2023–2029 (KILOTON)
TABLE 259 SOUTH AMERICA: WATER-BASED RESINS MARKET, BY TYPE, 2020–2022 (USD MILLION)
TABLE 260 SOUTH AMERICA: WATER-BASED RESINS MARKET, BY TYPE, 2023–2029 (USD MILLION)
TABLE 261 SOUTH AMERICA: WATER-BASED RESINS MARKET, BY TYPE, 2020–2022 (KILOTON)
TABLE 262 SOUTH AMERICA: WATER-BASED RESINS MARKET, BY TYPE, 2023–2029 (KILOTON)
TABLE 263 SOUTH AMERICA: WATER-BASED RESINS MARKET, BY APPLICATION, 2020–2022 (USD MILLION)
TABLE 264 SOUTH AMERICA: WATER-BASED RESINS MARKET, BY APPLICATION, 2023–2029 (USD MILLION)
TABLE 265 SOUTH AMERICA: WATER-BASED RESINS MARKET, BY APPLICATION, 2020–2022 (KILOTON)
TABLE 266 SOUTH AMERICA: WATER-BASED RESINS MARKET, BY APPLICATION, 2023–2029 (KILOTON)
TABLE 267 BRAZIL: WATER-BASED RESINS MARKET, BY TYPE, 2020–2022 (USD MILLION)
TABLE 268 BRAZIL: WATER-BASED RESINS MARKET, BY TYPE, 2023–2029 (USD MILLION)
TABLE 269 BRAZIL: WATER-BASED RESINS MARKET, BY TYPE, 2020–2022 (KILOTON)
TABLE 270 BRAZIL: WATER-BASED RESINS MARKET, BY TYPE, 2023–2029 (KILOTON)
TABLE 271 BRAZIL: WATER-BASED RESINS MARKET, BY APPLICATION, 2020–2022 (USD MILLION)
TABLE 272 BRAZIL: WATER-BASED RESINS MARKET, BY APPLICATION, 2023–2029 (USD MILLION)
TABLE 273 BRAZIL: WATER-BASED RESINS MARKET, BY APPLICATION, 2020–2022 (KILOTON)
TABLE 274 BRAZIL: WATER-BASED RESINS MARKET, BY APPLICATION, 2023–2029 (KILOTON)
TABLE 275 ARGENTINA: WATER-BASED RESINS MARKET, BY TYPE, 2020–2022 (USD MILLION)
TABLE 276 ARGENTINA: WATER-BASED RESINS MARKET, BY TYPE, 2023–2029 (USD MILLION)
TABLE 277 ARGENTINA: WATER-BASED RESINS MARKET, BY TYPE, 2020–2022 (KILOTON)
TABLE 278 ARGENTINA: WATER-BASED RESINS MARKET, BY TYPE, 2023–2029 (KILOTON)
TABLE 279 ARGENTINA: WATER-BASED RESINS MARKET, BY APPLICATION, 2020–2022 (USD MILLION)
TABLE 280 ARGENTINA: WATER-BASED RESINS MARKET, BY APPLICATION, 2023–2029 (USD MILLION)
TABLE 281 ARGENTINA: WATER-BASED RESINS MARKET, BY APPLICATION, 2020–2022 (KILOTON)
TABLE 282 ARGENTINA: WATER-BASED RESINS MARKET, BY APPLICATION, 2023–2029 (KILOTON)
TABLE 283 REST OF SOUTH AMERICA: WATER-BASED RESINS MARKET, BY TYPE, 2020–2022 (USD MILLION)
TABLE 284 REST OF SOUTH AMERICA: WATER-BASED RESINS MARKET, BY TYPE, 2023–2029 (USD MILLION)
TABLE 285 REST OF SOUTH AMERICA: WATER-BASED RESINS MARKET, BY TYPE, 2020–2022 (KILOTON)
TABLE 286 REST OF SOUTH AMERICA: WATER-BASED RESINS MARKET, BY TYPE, 2023–2029 (KILOTON)
TABLE 287 REST OF SOUTH AMERICA: WATER-BASED RESINS MARKET, BY APPLICATION, 2020–2022 (USD MILLION)
TABLE 288 REST OF SOUTH AMERICA: WATER-BASED RESINS MARKET, BY APPLICATION, 2023–2029 (USD MILLION)
TABLE 289 REST OF SOUTH AMERICA: WATER-BASED RESINS MARKET, BY APPLICATION, 2020–2022 (KILOTON)
TABLE 290 REST OF SOUTH AMERICA: WATER-BASED RESINS MARKET, BY APPLICATION, 2023–2029 (KILOTON)
TABLE 291 OVERVIEW OF STRATEGIES DEPLOYED BY KEY PLAYERS IN WATER-BASED RESINS MARKET
TABLE 292 WATER-BASED RESINS MARKET: DEGREE OF COMPETITION
TABLE 293 WATER-BASED RESINS MARKET: TYPE FOOTPRINT (10 COMPANIES)
TABLE 294 WATER-BASED RESINS MARKET: APPLICATION FOOTPRINT (10 COMPANIES)
TABLE 295 WATER-BASED RESINS MARKET: REGIONAL FOOTPRINT (10 COMPANIES)
TABLE 296 WATER-BASED RESINS MARKET: LIST OF KEY STARTUPS/SMES
TABLE 297 WATER-BASED RESINS MARKET: COMPETITIVE BENCHMARKING OF KEY STARTUPS/SMES
TABLE 298 WATER-BASED RESINS MARKET: COMPETITIVE BENCHMARKING OF KEY STARTUPS/SMES, BY REGION
TABLE 299 WATER-BASED RESINS MARKET: PRODUCT LAUNCHES/DEVELOPMENTS, AUGUST 2018–MARCH 2024
TABLE 300 WATER-BASED RESINS MARKET: DEALS, AUGUST 2018–MARCH 2024
TABLE 301 WATER-BASED RESINS MARKET: EXPANSIONS, AUGUST 2018–MARCH 2024
TABLE 302 WATER-BASED RESINS MARKET: OTHER DEVELOPMENTS, AUGUST 2018–MARCH 2024
TABLE 303 BASF SE: COMPANY OVERVIEW
TABLE 304 BASF SE: PRODUCTS/SOLUTIONS/SERVICES OFFERINGS
TABLE 305 BASF SE: DEALS, AUGUST 2018–MARCH 2024
TABLE 306 BASF SE: PRODUCT LAUNCHES, AUGUST 2018–MARCH 2024
TABLE 307 BASF SE: EXPANSIONS, AUGUST 2018–MARCH 2024
TABLE 308 THE LUBRIZOL CORPORATION: COMPANY OVERVIEW
TABLE 309 THE LUBRIZOL CORPORATION: PRODUCTS/SOLUTIONS/SERVICES OFFERINGS
TABLE 310 THE LUBRIZOL CORPORATION: PRODUCT LAUNCHES, AUGUST 2018–MARCH 2024
TABLE 311 DOW: COMPANY OVERVIEW
TABLE 312 DOW: PRODUCTS/SOLUTIONS/SERVICES OFFERED
TABLE 313 DOW: PRODUCT LAUNCHES, AUGUST 2018–MARCH 2024
TABLE 314 COVESTRO AG: COMPANY OVERVIEW
TABLE 315 COVESTRO AG: PRODUCTS/SOLUTIONS/SERVICES OFFERINGS
TABLE 316 COVESTRO AG: PRODUCT LAUNCHES, AUGUST 2018–MARCH 2024
TABLE 317 COVESTRO AG: DEALS, AUGUST 2018–MARCH 2024
TABLE 318 WESTLAKE CORPORATION: COMPANY OVERVIEW
TABLE 319 WESTLAKE CORPORATION: PRODUCTS/SOLUTIONS/SERVICES OFFERINGS
TABLE 320 WESTLAKE CORPORATION: PRODUCT LAUNCHES, AUGUST 2018–MARCH 2024
TABLE 321 WESTLAKE CORPORATION: DEALS, AUGUST 2018–MARCH 2024
TABLE 322 ARKEMA: COMPANY OVERVIEW
TABLE 323 ARKEMA: PRODUCTS/SOLUTIONS/SERVICES OFFERINGS
TABLE 324 ARKEMA: PRODUCT LAUNCHES, AUGUST 2018–MARCH 2024
TABLE 325 ARKEMA: DEALS, AUGUST 2018–MARCH 2024
TABLE 326 DIC CORPORATION: COMPANY OVERVIEW
TABLE 327 DIC CORPORATION: PRODUCTS/SOLUTIONS/SERVICES OFFERINGS
TABLE 328 DIC CORPORATION: DEALS, AUGUST 2018–MARCH 2024
TABLE 329 DIC CORPORATION: EXPANSIONS, AUGUST 2018–MARCH 2024
TABLE 330 ALLNEX GMBH: COMPANY OVERVIEW
TABLE 331 ALLNEX GMBH: PRODUCTS/SOLUTIONS/SERVICES OFFERINGS
TABLE 332 ALLNEX GMBH: PRODUCT LAUNCHES & DEVELOPMENTS, AUGUST 2018–MARCH 2024
TABLE 333 ALLNEX GMBH: DEALS, AUGUST 2018–MARCH 2024
TABLE 334 ALLNEX GMBH: EXPANSIONS, AUGUST 2018–MARCH 2024
TABLE 335 ALLNEX GMBH: OTHER DEVELOPMENTS, AUGUST 2018–MARCH 2024
TABLE 336 ADEKA CORPORATION: COMPANY OVERVIEW
TABLE 337 ADEKA CORPORATION: PRODUCTS/SOLUTIONS/SERVICES OFFERINGS
TABLE 338 OLIN CORPORATION: COMPANY OVERVIEW
TABLE 339 OLIN CORPORATION: PRODUCTS/SOLUTIONS/SERVICES OFFERINGS
TABLE 340 ALBERDINGK BOLEY GMBH: COMPANY OVERVIEW
TABLE 341 ADITYA BIRLA CHEMICALS (THAILAND) PVT. LTD: COMPANY OVERVIEW
TABLE 342 BELIKE CHEMICAL COMPANY LTD.: COMPANY OVERVIEW
TABLE 343 BOND POLYMERS INTERNATIONAL: COMPANY OVERVIEW
TABLE 344 STAHL HOLDINGS B.V.: COMPANY OVERVIEW
TABLE 345 GREAT EASTERN RESINS INDUSTRIAL CO. LTD.: COMPANY OVERVIEW
TABLE 346 SYNTHESIA TECHNOLOGY GROUP: COMPANY OVERVIEW
TABLE 347 KUKDO CHEMICAL CO., LTD.: COMPANY OVERVIEW
TABLE 348 LEUNA-HARZE GMBH: COMPANY OVERVIEW
TABLE 349 SYNTHOMER PLC: COMPANY OVERVIEW
TABLE 350 DAIKIN INDUSTRIES LTD.: COMPANY OVERVIEW
TABLE 351 GELLNER INDUSTRIAL, LLC: COMPANY OVERVIEW
TABLE 352 ARTIENCE CO., LTD.: COMPANY OVERVIEW
TABLE 353 SIMAB RESIN COMPANY: COMPANY OVERVIEW
TABLE 354 REICHHOLD LLC 2: COMPANY OVERVIEW
TABLE 355 EPOXY RESIN MARKET SIZE, BY PHYSICAL FORM, 2019–2022 (KILOTON)
TABLE 356 EPOXY RESIN MARKET SIZE, BY PHYSICAL FORM, 2023–2028 (KILOTON)
TABLE 357 EPOXY RESIN MARKET SIZE, BY PHYSICAL FORM, 2019–2022 (USD MILLION)
TABLE 358 EPOXY RESIN MARKET SIZE, BY PHYSICAL FORM, 2023–2028 (USD MILLION)
TABLE 359 EPOXY RESIN MARKET, BY REGION, 2019–2022 (KILOTON)
TABLE 360 EPOXY RESIN MARKET, BY REGION, 2023–2028 (KILOTON)
TABLE 361 EPOXY RESIN MARKET, BY REGION, 2019–2022 (USD MILLION)
TABLE 362 EPOXY RESIN MARKET, BY REGION, 2023–2028 (USD MILLION)
LIST OF FIGURES (52 FIGURES)
FIGURE 1 WATER-BASED RESINS MARKET: RESEARCH DESIGN
FIGURE 2 MARKET SIZE ESTIMATION: TOP-DOWN APPROACH
FIGURE 3 MARKET SIZE ESTIMATION: BOTTOM-UP APPROACH
FIGURE 4 WATER-BASED RESINS MARKET: APPROACH 1
FIGURE 5 WATER-BASED RESINS MARKET: APPROACH 2
FIGURE 6 WATER-BASED RESINS MARKET: DATA TRIANGULATION
FIGURE 7 ACRYLIC TO ACCOUNT FOR LARGEST SHARE OF WATER-BASED RESINS MARKET
FIGURE 8 PAINTS & COATINGS TO BE LARGEST APPLICATION OF WATER-BASED RESINS
FIGURE 9 ASIA PACIFIC ACCOUNTED FOR LARGEST SHARE OF WATER-BASED RESINS MARKET IN 2023
FIGURE 10 ASIA PACIFIC TO BE FASTEST-GROWING MARKET FOR WATER-BASED RESINS DURING FORECAST PERIOD
FIGURE 11 ACRYLIC TO LEAD WATER-BASED RESINS MARKET DURING FORECAST PERIOD
FIGURE 12 PAINTS & COATINGS TO BE LARGEST APPLICATION OF WATER-BASED RESINS
FIGURE 13 CHINA ACCOUNTED FOR LARGEST MARKET SHARE IN ASIA PACIFIC
FIGURE 14 CHINA TO REGISTER HIGHEST GROWTH DURING FORECAST PERIOD
FIGURE 15 DRIVERS, RESTRAINTS, OPPORTUNITIES, AND CHALLENGES IN WATER-BASED RESINS MARKET
FIGURE 16 GLOBAL MOTOR VEHICLE PRODUCTION (MILLION UNITS)
FIGURE 17 REVENUE SHIFT & NEW REVENUE POCKETS IN WATER-BASED RESINS MARKET
FIGURE 18 AVERAGE SELLING PRICE OF WATER-BASED RESINS, BY REGION (USD/KG)
FIGURE 19 WATER-BASED RESINS MARKET: VALUE CHAIN ANALYSIS
FIGURE 20 WATER-BASED RESINS MARKET: ECOSYSTEM MAPPING
FIGURE 21 TOP PATENT OWNERS IN WATER-BASED RESINS MARKET (2014–2023)
FIGURE 22 EXPORT SCENARIO: HS CODE 390730 - EPOXIDE RESINS, IN PRIMARY FORMS, 2014–2023 (USD MILLION)
FIGURE 23 IMPORT SCENARIO: HS CODE 390730 - EPOXIDE RESINS, IN PRIMARY FORMS, 2014–2023 (USD MILLION)
FIGURE 24 EXPORT SCENARIO: HS CODE 390750 - ALKYD RESINS, IN PRIMARY FORMS, 2014–2023 (USD MILLION)
FIGURE 25 IMPORT SCENARIO: HS CODE 390750 - ALKYD RESINS, IN PRIMARY FORMS, 2014–2023 (USD MILLION)
FIGURE 26 WATER-BASED RESINS MARKET: PORTER'S FIVE FORCES ANALYSIS
FIGURE 27 INFLUENCE OF STAKEHOLDERS ON BUYING PROCESS
FIGURE 28 KEY BUYING CRITERIA FOR WATER-BASED RESINS
FIGURE 29 INVESTOR DEALS & FUNDING IN AUTOMOTIVE SECTOR SOARED IN 2021
FIGURE 30 PAINTS & COATINGS SEGMENT TO DOMINATE MARKET DURING FORECAST PERIOD
FIGURE 31 ACRYLIC SEGMENT TO DOMINATE MARKET DURING FORECAST PERIOD
FIGURE 32 CHINA TO RECORD FASTEST GROWTH DURING FORECAST PERIOD
FIGURE 33 ASIA PACIFIC: WATER-BASED RESINS MARKET SNAPSHOT
FIGURE 34 NORTH AMERICA: WATER-BASED RESINS MARKET SNAPSHOT
FIGURE 35 EUROPE: WATER-BASED RESINS MARKET SNAPSHOT
FIGURE 36 MARKET SHARE OF KEY PLAYERS IN WATER-BASED RESINS MARKET, 2023
FIGURE 37 REVENUE ANALYSIS FOR KEY COMPANIES (2019–2023)
FIGURE 38 RANKING OF TOP 5 PLAYERS IN WATER-BASED RESINS MARKET
FIGURE 39 COMPANY VALUATION (USD BILLION)
FIGURE 40 FINANCIAL MATRIX: EV/EBITDA RATIO
FIGURE 41 WATER-BASED RESINS MARKET: BRAND/PRODUCT COMPARISON
FIGURE 42 WATER-BASED RESINS MARKET: COMPANY EVALUATION MATRIX (KEY PLAYERS), 2023
FIGURE 43 WATER-BASED RESINS MARKET: COMPANY OVERALL FOOTPRINT (10 COMPANIES)
FIGURE 44 WATER-BASED RESINS MARKET: COMPANY EVALUATION MATRIX (STARTUPS/SMES), 2023
FIGURE 45 BASF SE: COMPANY SNAPSHOT
FIGURE 46 DOW: COMPANY SNAPSHOT
FIGURE 47 COVESTRO AG: COMPANY SNAPSHOT
FIGURE 48 WESTLAKE CORPORATION: COMPANY SNAPSHOT
FIGURE 49 ARKEMA: COMPANY SNAPSHOT
FIGURE 50 DIC CORPORATION: COMPANY SNAPSHOT
FIGURE 51 ADEKA CORPORATION: COMPANY SNAPSHOT
FIGURE 52 OLIN CORPORATION: COMPANY SNAPSHOT


Growth opportunities and latent adjacency in Water-based Resins Market