TABLE OF CONTENTS
1 INTRODUCTION (Page No. - 37)
1.1 STUDY OBJECTIVES
1.2 MARKET DEFINITION
1.2.1 INCLUSIONS AND EXCLUSIONS OF STUDY
1.3 MARKETS COVERED
1.3.1 MARKET SEGMENTATION
1.3.2 REGIONAL SCOPE
1.3.3 YEARS CONSIDERED
1.4 CURRENCY
1.5 LIMITATIONS
1.6 STAKEHOLDERS
1.7 SUMMARY OF CHANGES
1.8 RECESSION IMPACT
2 RESEARCH METHODOLOGY (Page No. - 42)
2.1 RESEARCH DATA
2.2 RESEARCH APPROACH
FIGURE 1 WOUND CARE MARKET: RESEARCH DESIGN
2.2.1 SECONDARY DATA
2.2.1.1 Key data from secondary sources
2.2.2 PRIMARY DATA
2.2.2.1 Primary sources
2.2.2.2 Key data from primary sources
2.2.2.3 Key industry insights
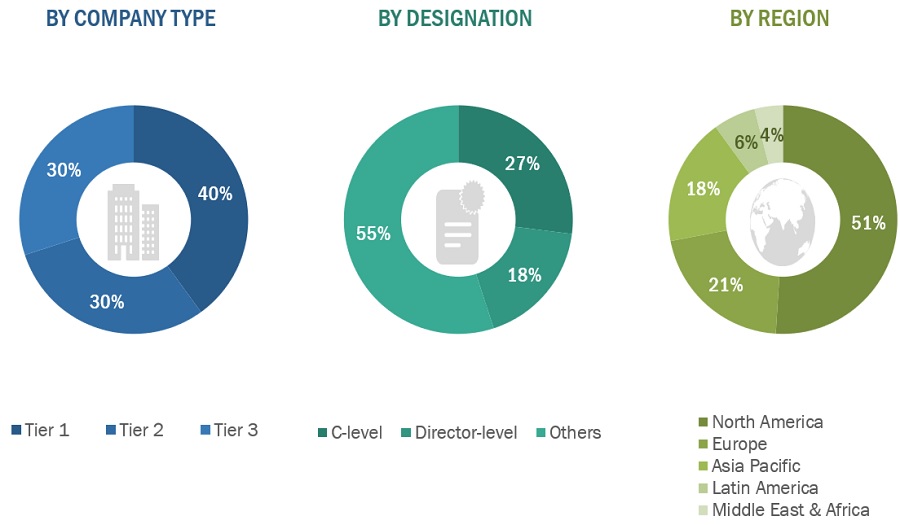
2.2.2.4 Breakdown of primary interviews
FIGURE 2 BREAKDOWN OF PRIMARY INTERVIEWS: SUPPLY-SIDE AND DEMAND-SIDE PARTICIPANTS
FIGURE 3 BREAKDOWN OF PRIMARY INTERVIEWS: BY COMPANY TYPE, DESIGNATION, AND REGION
2.3 MARKET SIZE ESTIMATION
2.3.1 BOTTOM-UP APPROACH
2.3.1.1 Approach 1: Company revenue estimation approach
FIGURE 4 BOTTOM-UP APPROACH: COMPANY REVENUE ESTIMATION APPROACH
2.3.1.2 Approach 2: Presentations of companies and primary interviews
2.3.1.3 Growth forecast
2.3.1.4 CAGR projections
FIGURE 5 CAGR PROJECTIONS: SUPPLY-SIDE ANALYSIS
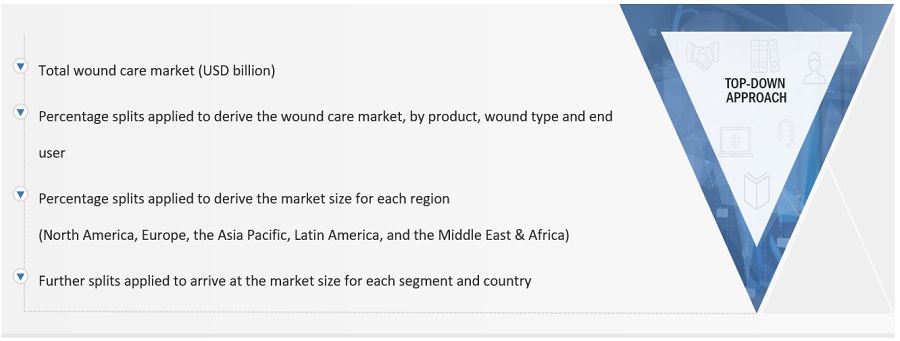
2.3.2 TOP-DOWN APPROACH
FIGURE 6 WOUND CARE MARKET: TOP-DOWN APPROACH
2.4 MARKET BREAKDOWN AND DATA TRIANGULATION
FIGURE 7 DATA TRIANGULATION METHODOLOGY
2.5 MARKET SHARE
2.6 STUDY ASSUMPTIONS
2.7 RISK ASSESSMENT
2.8 METHODOLOGY & SCOPE-RELATED LIMITATIONS
2.9 GROWTH RATE ASSUMPTIONS
2.10 RECESSION IMPACT ON WOUND CARE MARKET
3 EXECUTIVE SUMMARY (Page No. - 55)
FIGURE 8 WOUND CARE MARKET, BY PRODUCT, 2023 VS. 2028 (USD MILLION)
FIGURE 9 WOUND CARE MARKET, BY WOUND TYPE, 2023 VS. 2028 (USD MILLION)
FIGURE 10 WOUND CARE MARKET, BY END USER, 2023 VS. 2028 (USD MILLION)
FIGURE 11 WOUND CARE MARKET, BY REGION, 2023 VS. 2028 (USD MILLION)
4 PREMIUM INSIGHTS (Page No. - 58)
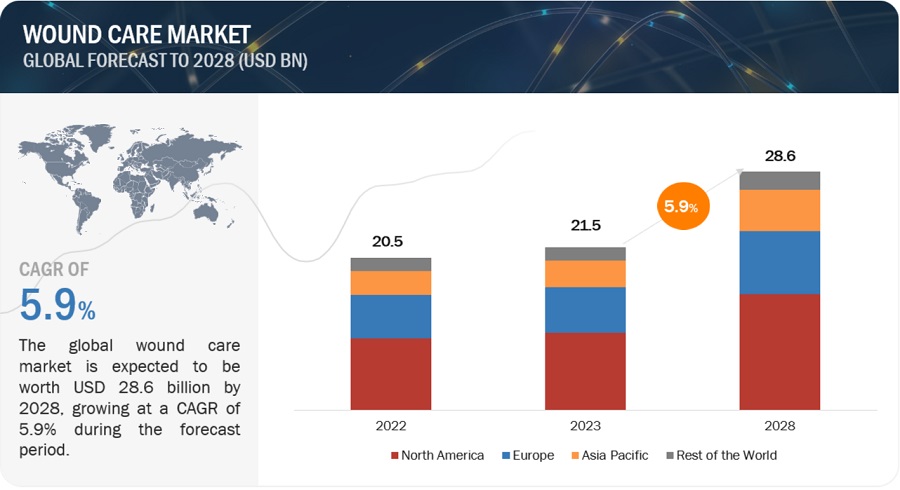
4.1 WOUND CARE MARKET OVERVIEW
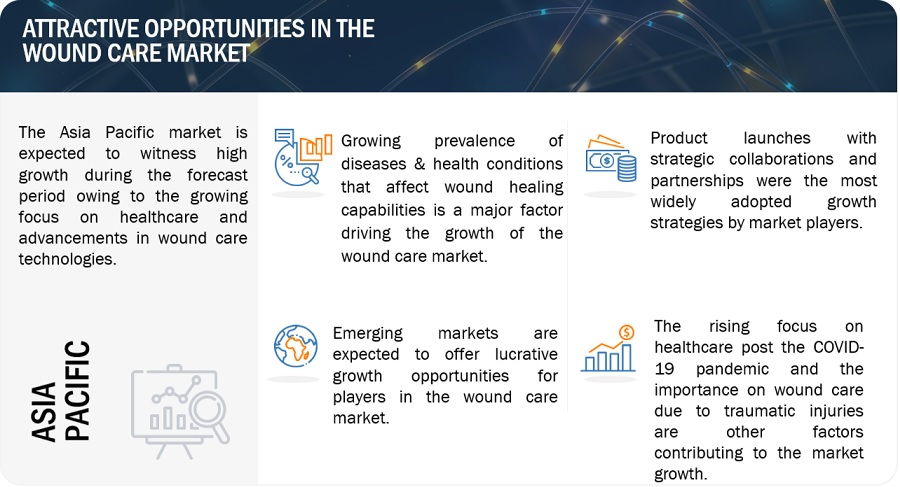
FIGURE 12 GROWING PREVALENCE OF DISEASES & HEALTH CONDITIONS THAT AFFECT WOUND HEALING CAPABILITIES TO DRIVE MARKET
4.2 WOUND CARE MARKET SHARE, BY PRODUCT, 2023 VS. 2028
FIGURE 13 ADVANCED WOUND CARE PRODUCTS SEGMENT TO DOMINATE MARKET IN 2028
4.3 WOUND CARE MARKET SHARE, BY WOUND TYPE, 2023 VS. 2028
FIGURE 14 CHRONIC WOUNDS SEGMENT DOMINATES MARKET DURING FORECAST PERIOD
4.4 WOUND CARE MARKET SHARE, BY END USER, 2023 VS. 2028
FIGURE 15 HOSPITALS & CLINICS WILL CONTINUE TO DOMINATE MARKET IN 2028
4.5 WOUND CARE MARKET: GEOGRAPHIC GROWTH OPPORTUNITIES
FIGURE 16 ASIA PACIFIC TO REGISTER HIGHEST GROWTH DURING FORECAST PERIOD
5 MARKET OVERVIEW (Page No. - 61)
5.1 INTRODUCTION
5.2 MARKET DYNAMICS
FIGURE 17 WOUND CARE MARKET: DRIVERS, RESTRAINTS, OPPORTUNITIES, AND CHALLENGES
5.2.1 DRIVERS
5.2.1.1 Growing prevalence of diseases & health conditions that affect wound healing capabilities
5.2.1.1.1 Growing geriatric population
5.2.1.1.2 Rising prevalence of diabetes
FIGURE 18 PREVALENCE OF DIABETES IN ADULTS (20–79 YEARS), BY REGION, 2021 VS. 2045 (MILLION CASES)
TABLE 1 TOTAL HEALTH EXPENDITURE DUE TO DIABETES (20–79 YEARS), BY COUNTRY, 2021
5.2.1.1.3 Increasing number of surgical procedures worldwide
5.2.1.2 Rising expenditure on chronic wounds
5.2.1.3 Increasing incidence of burn injuries
5.2.1.4 Rising cases of traumatic injuries
TABLE 2 PREVALENCE OF ROAD ACCIDENTS
5.2.1.5 Technological advancements in wound care products
5.2.1.6 Rising use of regenerative medicine for wound management
5.2.2 RESTRAINTS
5.2.2.1 High cost of advanced wound care products
TABLE 3 AVERAGE COST OF TREATMENT FOR DIABETIC FOOT ULCERS
5.2.2.2 Risks associated with use of advanced wound care products
TABLE 4 RISKS ASSOCIATED WITH ADVANCED WOUND CARE PRODUCTS
5.2.3 OPPORTUNITIES
5.2.3.1 Growth potential of emerging countries
TABLE 5 STRATEGIC DEVELOPMENTS IN ASIA PACIFIC REGION
5.2.4 CHALLENGES
5.2.4.1 Growing instances of product recalls by regulatory bodies
5.2.4.2 Dearth of awareness
5.3 PRICING ANALYSIS
TABLE 6 AVERAGE SELLING PRICE OF KEY PRODUCTS IN WOUND CARE MARKET (2022)
TABLE 7 AVERAGE SELLING PRICE TRENDS, BY REGION, 2022
5.4 PATENT ANALYSIS
FIGURE 19 PATENT ANALYSIS OF WOUND CARE MARKET, JANUARY 2013–DECEMBER 2022
5.4.1 LIST OF MAJOR PATENTS
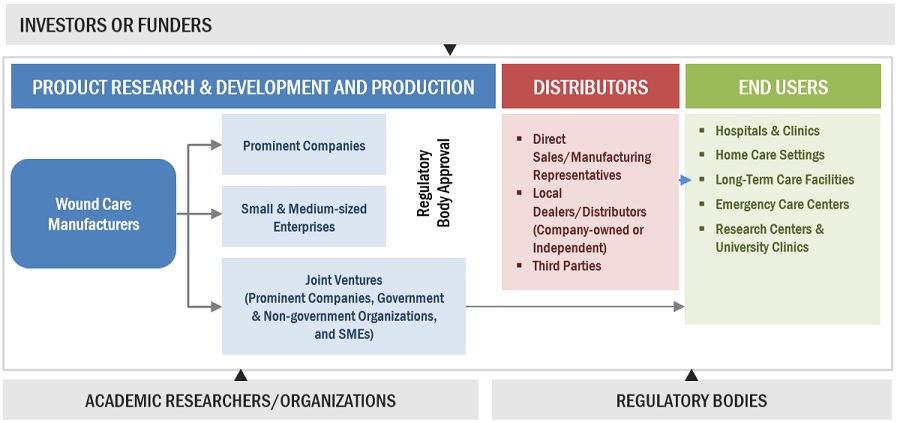
5.5 VALUE CHAIN ANALYSIS
FIGURE 20 VALUE CHAIN ANALYSIS OF WOUND CARE MARKET: MAJOR VALUE ADDED DURING MANUFACTURING AND ASSEMBLY PHASES
5.6 SUPPLY CHAIN ANALYSIS
FIGURE 21 WOUND CARE MARKET: SUPPLY CHAIN ANALYSIS
5.7 ECOSYSTEM ANALYSIS
FIGURE 22 WOUND CARE MARKET: ECOSYSTEM ANALYSIS
5.7.1 WOUND CARE MARKET: ROLE IN ECOSYSTEM
5.8 PORTER’S FIVE FORCES ANALYSIS
TABLE 8 WOUND CARE MARKET: PORTER’S FIVE FORCES ANALYSIS
5.8.1 THREAT OF NEW ENTRANTS
5.8.2 THREAT OF SUBSTITUTES
5.8.3 BARGAINING POWER OF BUYERS
5.8.4 BARGAINING POWER OF SUPPLIERS
5.8.5 INTENSITY OF COMPETITIVE RIVALRY
5.9 REGULATORY LANDSCAPE
TABLE 9 NORTH AMERICA: LIST OF REGULATORY BODIES, GOVERNMENT AGENCIES, AND OTHER ORGANIZATIONS
TABLE 10 ASIA PACIFIC: LIST OF REGULATORY BODIES, GOVERNMENT AGENCIES, AND OTHER ORGANIZATIONS
TABLE 11 LATIN AMERICA: LIST OF REGULATORY BODIES, GOVERNMENT AGENCIES, AND OTHER ORGANIZATIONS
TABLE 12 REST OF THE WORLD: LIST OF REGULATORY BODIES, GOVERNMENT AGENCIES, AND OTHER ORGANIZATIONS
5.9.1 NORTH AMERICA
5.9.1.1 US
5.9.1.2 Canada
5.9.2 EUROPE
5.9.3 ASIA PACIFIC
5.9.3.1 China
5.9.3.2 Japan
5.9.3.3 India
5.9.4 LATIN AMERICA
5.9.4.1 Brazil
5.9.4.2 Mexico
5.9.5 MIDDLE EAST
5.9.6 AFRICA
5.10 PESTEL ANALYSIS
5.11 TRADE ANALYSIS
5.11.1 TRADE ANALYSIS FOR ADHESIVE DRESSINGS
TABLE 13 IMPORT DATA FOR ADHESIVE DRESSINGS, BY COUNTRY, 2018–2022 (USD MILLION)
TABLE 14 EXPORT DATA FOR ADHESIVE DRESSINGS, BY COUNTRY, 2018–2022 (USD MILLION)
5.12 TECHNOLOGY ANALYSIS
5.13 KEY CONFERENCES & EVENTS IN 2023–2024
TABLE 15 WOUND CARE MARKET: DETAILED LIST OF CONFERENCES & EVENTS
5.14 TRENDS/DISRUPTIONS IMPACTING CUSTOMER’S BUSINESS
5.14.1 REVENUE SOURCES SHIFTING TOWARD TECHNOLOGY-BASED SOLUTIONS DUE TO COVID-19 PANDEMIC
5.14.2 REVENUE SHIFT IN WOUND CARE MARKET
5.15 KEY STAKEHOLDERS & BUYING CRITERIA
5.15.1 KEY STAKEHOLDERS IN BUYING PROCESS
FIGURE 23 INFLUENCE OF STAKEHOLDERS ON BUYING PROCESS OF WOUND CARE PRODUCTS
TABLE 16 INFLUENCE OF STAKEHOLDERS ON BUYING PROCESS OF WOUND CARE PRODUCTS (%)
5.15.2 BUYING CRITERIA
FIGURE 24 KEY BUYING CRITERIA FOR WOUND CARE PRODUCTS
TABLE 17 KEY BUYING CRITERIA FOR WOUND CARE PRODUCTS
5.16 CASE STUDY ANALYSIS
5.16.1 CASE STUDY: SURGICAL WOUND TURNS AROUND IN 3 WEEKS
6 WOUND CARE MARKET, BY PRODUCT (Page No. - 91)
6.1 INTRODUCTION
TABLE 18 WOUND CARE MARKET, BY PRODUCT, 2021–2028 (USD MILLION)
6.1.1 PRIMARY NOTES
6.1.1.1 Key industry insights
6.2 ADVANCED WOUND CARE PRODUCTS
TABLE 19 ADVANCED WOUND CARE PRODUCTS MARKET, BY TYPE, 2021–2028 (USD MILLION)
TABLE 20 ADVANCED WOUND CARE PRODUCTS MARKET, BY COUNTRY, 2021–2028 (USD MILLION)
6.2.1 ADVANCED WOUND DRESSINGS, BY TYPE
TABLE 21 ADVANCED WOUND DRESSINGS MARKET, BY TYPE, 2021–2028 (USD MILLION)
TABLE 22 ADVANCED WOUND DRESSINGS MARKET, BY COUNTRY, 2021–2028 (USD MILLION)
6.2.1.1 Foam dressings
TABLE 23 KEY PRODUCTS IN FOAM DRESSINGS MARKET
TABLE 24 FOAM DRESSINGS MARKET, BY TYPE, 2021–2028 (USD MILLION)
TABLE 25 FOAM DRESSINGS MARKET, BY COUNTRY, 2021–2028 (USD MILLION)
6.2.1.1.1 Silicone dressings
6.2.1.1.1.1 Help expedite wound closure and reduce risk of maceration
TABLE 26 SILICONE DRESSINGS MARKET, BY COUNTRY, 2021–2028 (USD MILLION)
6.2.1.1.2 Non-silicone dressings
6.2.1.1.2.1 Effective in scar removal and wound healing
TABLE 27 NON-SILICONE DRESSINGS MARKET, BY COUNTRY, 2021–2028 (USD MILLION)
6.2.1.2 Hydrocolloid dressings
6.2.1.2.1 Promotes moist environment required for optimal healing
TABLE 28 KEY PRODUCTS IN HYDROCOLLOID DRESSINGS MARKET
TABLE 29 HYDROCOLLOID DRESSINGS MARKET, BY COUNTRY, 2021–2028 (USD MILLION)
6.2.1.3 Film dressings
6.2.1.3.1 Non-absorbable nature ensures strong adoption
TABLE 30 FILM DRESSINGS MARKET, BY COUNTRY, 2021–2028 (USD MILLION)
6.2.1.4 Alginate dressings
6.2.1.4.1 Well-suited for diabetic & foot ulcers
TABLE 31 ALGINATE DRESSINGS MARKET, BY COUNTRY, 2021–2028 (USD MILLION)
6.2.1.5 Hydrogel dressings
6.2.1.5.1 Available in several forms for effective use
TABLE 32 HYDROGEL DRESSINGS MARKET, BY COUNTRY, 2021–2028 (USD MILLION)
6.2.1.6 Collagen dressings
6.2.1.6.1 Help release cytokines and growth factors that expedite wound healing
TABLE 33 COLLAGEN DRESSINGS MARKET, BY COUNTRY, 2021–2028 (USD MILLION)
6.2.1.7 Hydrofiber dressings
6.2.1.7.1 Combine properties of hydrocolloids and collagen
TABLE 34 HYDROFIBER DRESSINGS MARKET, BY COUNTRY, 2021–2028 (USD MILLION)
6.2.1.8 Wound contact layers
6.2.1.8.1 Protect wound beds from bacterial and fungal growth
TABLE 35 WOUND CONTACT LAYERS MARKET, BY COUNTRY, 2021–2028 (USD MILLION)
6.2.1.9 Superabsorbent dressings
6.2.1.9.1 Designed for highly exuding wounds
TABLE 36 SUPERABSORBENT DRESSINGS MARKET, BY COUNTRY, 2021–2028 (USD MILLION)
6.2.1.10 Other advanced wound dressings
TABLE 37 OTHER ADVANCED WOUND DRESSINGS MARKET, BY COUNTRY, 2021–2028 (USD MILLION)
6.2.2 ADVANCED WOUND DRESSINGS, BY PROPERTY
TABLE 38 ADVANCED WOUND DRESSINGS MARKET, BY PROPERTY, 2021–2028 (USD MILLION)
6.2.2.1 Non-antimicrobial dressings
6.2.2.1.1 More cost-effective than antimicrobial alternatives
TABLE 39 NON-ANTIMICROBIAL DRESSINGS MARKET, BY COUNTRY, 2021–2028 (USD MILLION)
6.2.2.2 Antimicrobial dressings
6.2.2.2.1 Provide comprehensive coverage against potential pathogens
TABLE 40 ANTIMICROBIAL DRESSINGS MARKET, BY COUNTRY, 2021–2028 (USD MILLION)
6.2.3 WOUND THERAPY DEVICES
TABLE 41 WOUND THERAPY DEVICES MARKET, BY TYPE, 2021–2028 (USD MILLION)
TABLE 42 WOUND THERAPY DEVICES MARKET, BY COUNTRY, 2021–2028 (USD MILLION)
6.2.3.1 Portable & conventional negative pressure wound therapy devices
6.2.3.1.1 Growing adoption of single-use NPWT devices in home care settings to drive market
TABLE 43 PORTABLE & CONVENTIONAL NPWT DEVICES MARKET, BY COUNTRY, 2021–2028 (USD MILLION)
6.2.3.2 Debridement devices & accessories
6.2.3.2.1 Development of novel technologies to support market growth
TABLE 44 DEBRIDEMENT DEVICES & ACCESSORIES MARKET, BY COUNTRY, 2021–2028 (USD MILLION)
6.2.3.3 Wound assessment & monitoring devices
6.2.3.3.1 Potential cost-reducing capabilities to boost adoption
TABLE 45 WOUND ASSESSMENT & MONITORING DEVICES MARKET, BY COUNTRY, 2021–2028 (USD MILLION)
6.2.3.4 Other devices & accessories
TABLE 46 OTHER DEVICES & ACCESSORIES MARKET, BY COUNTRY, 2021–2028 (USD MILLION)
6.2.4 BIOLOGICAL SKIN SUBSTITUTES
TABLE 47 KEY PRODUCTS IN BIOLOGICAL SKIN SUBSTITUTES MARKET
TABLE 48 BIOLOGICAL SKIN SUBSTITUTES MARKET, BY TYPE, 2021–2028 (USD MILLION)
TABLE 49 BIOLOGICAL SKIN SUBSTITUTES MARKET, BY COUNTRY, 2021–2028 (USD MILLION)
6.2.4.1 Human donor tissue-derived products
6.2.4.1.1 High efficacy to support market demand
TABLE 50 KEY PRODUCTS IN HUMAN DONOR TISSUE-DERIVED PRODUCTS MARKET
TABLE 51 HUMAN DONOR TISSUE-DERIVED PRODUCTS MARKET, BY COUNTRY, 2021–2028 (USD MILLION)
6.2.4.2 Acellular animal-derived products
6.2.4.2.1 Increasing incidence of diabetic foot ulcers and burn injuries to drive market
TABLE 52 KEY PRODUCTS IN ACELLULAR ANIMAL-DERIVED PRODUCTS MARKET
TABLE 53 ACELLULAR ANIMAL-DERIVED PRODUCTS MARKET, BY COUNTRY, 2021–2028 (USD MILLION)
6.2.4.3 Biosynthetic products
6.2.4.3.1 Increased incidence of infected wounds to support market growth
TABLE 54 BIOSYNTHETIC PRODUCTS MARKET, BY COUNTRY, 2021–2028 (USD MILLION)
6.2.5 TOPICAL AGENTS
6.2.5.1 Cost-effectiveness and ease-of-use in home care settings to drive growth
TABLE 55 TOPICAL AGENTS MARKET, BY COUNTRY, 2021–2028 (USD MILLION)
6.3 SURGICAL WOUND CARE PRODUCTS
TABLE 56 SURGICAL WOUND CARE PRODUCTS MARKET, BY TYPE, 2021–2028 (USD MILLION)
TABLE 57 SURGICAL WOUND CARE PRODUCTS MARKET, BY COUNTRY, 2021–2028 (USD MILLION)
6.3.1 SUTURES
6.3.1.1 High tensile strength to drive adoption
TABLE 58 SUTURES MARKET, BY COUNTRY, 2021–2028 (USD MILLION)
6.3.2 TISSUE ADHESIVES, SEALANTS, AND GLUES
TABLE 59 TISSUE ADHESIVES, SEALANTS, AND GLUES MARKET, BY TYPE, 2021–2028 (USD MILLION)
TABLE 60 TISSUE ADHESIVES, SEALANTS, AND GLUES MARKET, BY COUNTRY, 2021–2028 (USD MILLION)
6.3.2.1 Fibrin-based sealants
6.3.2.1.1 Provide better results than sutures
TABLE 61 FIBRIN-BASED SEALANTS MARKET, BY COUNTRY, 2021–2028 (USD MILLION)
6.3.2.2 Synthetic adhesives
6.3.2.2.1 Additional sealing properties than traditional staples
TABLE 62 SYNTHETIC ADHESIVES MARKET, BY COUNTRY, 2021–2028 (USD MILLION)
6.3.2.3 Collagen-based sealants
6.3.2.3.1 Used in surgical procedures as adjuncts to hemostatic agents
TABLE 63 COLLAGEN-BASED SEALANTS MARKET, BY COUNTRY, 2021–2028 (USD MILLION)
6.3.3 STAPLERS
6.3.3.1 Faster and more accurate than suturing
TABLE 64 STAPLERS MARKET, BY COUNTRY, 2021–2028 (USD MILLION)
6.4 TRADITIONAL WOUND CARE PRODUCTS
TABLE 65 TRADITIONAL WOUND CARE PRODUCTS MARKET, BY TYPE, 2021–2028 (USD MILLION)
TABLE 66 TRADITIONAL WOUND CARE PRODUCTS MARKET, BY COUNTRY, 2021–2028 (USD MILLION)
6.4.1 MEDICAL TAPES
6.4.1.1 Used for primary wound treatment to cover and secure wounds
TABLE 67 MEDICAL TAPES MARKET, BY COUNTRY, 2021–2028 (USD MILLION)
6.4.2 DRESSINGS
6.4.2.1 Presence of large patient population for pressure ulcers to drive market
TABLE 68 DRESSINGS MARKET, BY COUNTRY, 2021–2028 (USD MILLION)
6.4.3 CLEANSING AGENTS
6.4.3.1 High risk of HAIs from open wounds to drive market
TABLE 69 TYPES OF CLEANSING AGENTS
TABLE 70 CLEANSING AGENTS MARKET, BY COUNTRY, 2021–2028 (USD MILLION)
7 WOUND CARE MARKET, BY WOUND TYPE (Page No. - 144)
7.1 INTRODUCTION
TABLE 71 WOUND CARE MARKET, BY WOUND TYPE, 2021–2028 (USD MILLION)
7.2 ACUTE WOUNDS
TABLE 72 WOUND CARE MARKET FOR ACUTE WOUNDS, BY TYPE, 2021–2028 (USD MILLION)
TABLE 73 WOUND CARE MARKET FOR ACUTE WOUNDS, BY COUNTRY, 2021–2028 (USD MILLION)
7.2.1 SURGICAL & TRAUMATIC WOUNDS
7.2.1.1 Rising volume of surgical procedures to drive market
TABLE 74 WOUND CARE MARKET FOR SURGICAL & TRAUMATIC WOUNDS, BY COUNTRY, 2021–2028 (USD MILLION)
7.2.2 BURNS
7.2.2.1 High incidence of burn injuries to drive market
TABLE 75 WOUND CARE MARKET FOR BURNS, BY COUNTRY, 2021–2028 (USD MILLION)
7.3 CHRONIC WOUNDS
TABLE 76 WOUND CARE MARKET FOR CHRONIC WOUNDS, BY TYPE, 2021–2028 (USD MILLION)
TABLE 77 WOUND CARE MARKET FOR CHRONIC WOUNDS, BY COUNTRY, 2021–2028 (USD MILLION)
7.3.1 DIABETIC FOOT ULCERS
7.3.1.1 Increasing prevalence of diabetes to support market growth
TABLE 78 TOTAL DIABETES-RELATED HEALTHCARE EXPENDITURE (20–79 AGE GROUP), 2021
TABLE 79 WOUND CARE MARKET FOR DIABETIC FOOT ULCERS, BY COUNTRY, 2021–2028 (USD MILLION)
7.3.2 PRESSURE ULCERS
7.3.2.1 Growing geriatric population to aid market growth
TABLE 80 WOUND CARE MARKET FOR PRESSURE ULCERS, BY COUNTRY, 2021–2028 (USD MILLION)
7.3.3 VENOUS LEG ULCERS
7.3.3.1 Rising prevalence of obesity to drive market
TABLE 81 WOUND CARE MARKET FOR VENOUS LEG ULCERS, BY COUNTRY, 2021–2028 (USD MILLION)
7.3.4 OTHER CHRONIC WOUNDS
TABLE 82 COMMERCIALLY AVAILABLE WOUND CARE BIOLOGIC PRODUCTS FOR OTHER CHRONIC WOUNDS
TABLE 83 WOUND CARE MARKET FOR OTHER CHRONIC WOUNDS, BY COUNTRY, 2021–2028 (USD MILLION)
8 WOUND CARE MARKET, BY END USER (Page No. - 159)
8.1 INTRODUCTION
TABLE 84 WOUND CARE MARKET, BY END USER, 2021–2028 (USD MILLION)
8.2 HOSPITALS & CLINICS
TABLE 85 TOTAL NUMBER OF HOSPITALS, BY COUNTRY, 2021
TABLE 86 WOUND CARE MARKET FOR HOSPITALS & CLINICS, BY TYPE, 2021–2028 (USD MILLION)
TABLE 87 WOUND CARE MARKET FOR HOSPITALS & CLINICS, BY COUNTRY, 2021–2028 (USD MILLION)
8.2.1 INPATIENT SETTINGS
8.2.1.1 Increasing hospital admissions due to HAIs to drive market
TABLE 88 WOUND CARE MARKET FOR INPATIENT SETTINGS, BY COUNTRY, 2021–2028 (USD MILLION)
8.2.2 OUTPATIENT SETTINGS
8.2.2.1 Rising cost of inpatient facilities to increase demand for outpatient care settings
TABLE 89 WOUND CARE MARKET FOR OUTPATIENT SETTINGS, BY COUNTRY, 2021–2028 (USD MILLION)
8.3 HOME CARE SETTINGS
8.3.1 LOW COST AND CONVENIENCE TO SUPPORT MARKET GROWTH
TABLE 90 WOUND CARE MARKET FOR HOME CARE SETTINGS, BY COUNTRY, 2021–2028 (USD MILLION)
8.4 LONG-TERM CARE FACILITIES
8.4.1 GROWING GERIATRIC POPULATION TO INCREASE DEMAND FOR BETTER LONG-TERM CARE
TABLE 91 WOUND CARE MARKET FOR LONG-TERM CARE FACILITIES, BY COUNTRY, 2021–2028 (USD MILLION)
8.5 OTHER END USERS
TABLE 92 WOUND CARE MARKET FOR OTHER END USERS, BY COUNTRY, 2021–2028 (USD MILLION)
9 WOUND CARE MARKET, BY REGION (Page No. - 169)
9.1 INTRODUCTIONS
TABLE 93 WOUND CARE MARKET, BY REGION, 2021–2028 (USD MILLION)
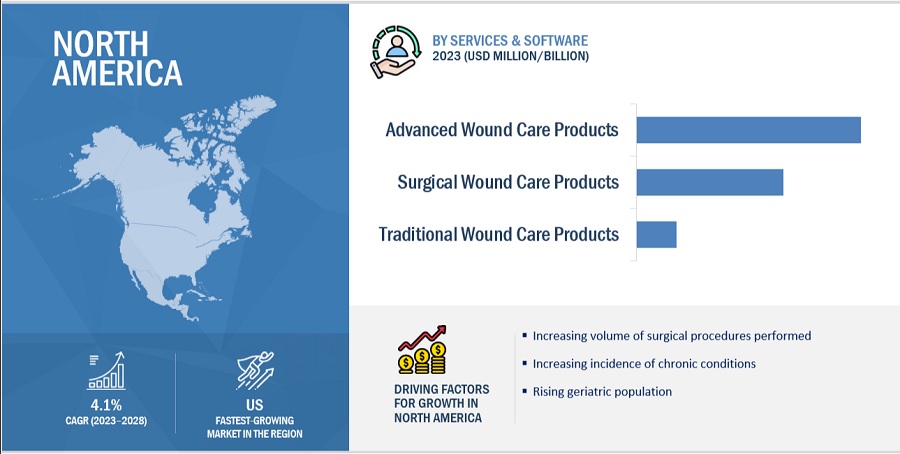
9.2 NORTH AMERICA
FIGURE 25 NORTH AMERICA: WOUND CARE MARKET SNAPSHOT
TABLE 94 NORTH AMERICA: WOUND CARE MARKET, BY COUNTRY, 2021–2028 (USD MILLION)
TABLE 95 NORTH AMERICA: WOUND CARE MARKET, BY PRODUCT, 2021–2028 (USD MILLION)
TABLE 96 NORTH AMERICA: ADVANCED WOUND CARE PRODUCTS MARKET, BY TYPE, 2021–2028 (USD MILLION)
TABLE 97 NORTH AMERICA: ADVANCED WOUND DRESSINGS MARKET, BY TYPE, 2021–2028 (USD MILLION)
TABLE 98 NORTH AMERICA: FOAM DRESSINGS MARKET, BY TYPE, 2021–2028 (USD MILLION)
TABLE 99 NORTH AMERICA: ADVANCED WOUND DRESSINGS MARKET, BY PROPERTY, 2021–2028 (USD MILLION)
TABLE 100 NORTH AMERICA: WOUND THERAPY DEVICES MARKET, BY TYPE, 2021–2028 (USD MILLION)
TABLE 101 NORTH AMERICA: BIOLOGICAL SKIN SUBSTITUTES MARKET, BY TYPE, 2021–2028 (USD MILLION)
TABLE 102 NORTH AMERICA: SURGICAL WOUND CARE PRODUCTS MARKET, BY TYPE, 2021–2028 (USD MILLION)
TABLE 103 NORTH AMERICA: TISSUE ADHESIVES, SEALANTS, AND GLUES MARKET, BY TYPE, 2021–2028 (USD MILLION)
TABLE 104 NORTH AMERICA: TRADITIONAL WOUND CARE PRODUCTS MARKET, BY TYPE, 2021–2028 (USD MILLION)
TABLE 105 NORTH AMERICA: WOUND CARE MARKET, BY WOUND TYPE, 2021–2028 (USD MILLION)
TABLE 106 NORTH AMERICA: WOUND CARE MARKET, BY END USER, 2021–2028 (USD MILLION)
9.2.1 RECESSION IMPACT ON NORTH AMERICAN WOUND CARE MARKET
9.2.2 US
9.2.2.1 Rising incidence of chronic diseases and diabetes to drive market
TABLE 107 US: WOUND CARE MARKET, BY PRODUCT, 2021–2028 (USD MILLION)
TABLE 108 US: WOUND CARE MARKET, BY END USER, 2021–2028 (USD MILLION)
9.2.3 CANADA
9.2.3.1 High prevalence of HAIs to support market growth
TABLE 109 CANADA: INCIDENCE OF DIABETES, 2022 VS. 2032
TABLE 110 CANADA: WOUND CARE MARKET, BY PRODUCT, 2021–2028 (USD MILLION)
TABLE 111 CANADA: WOUND CARE MARKET, BY END USER, 2021–2028 (USD MILLION)
9.3 EUROPE
TABLE 112 EUROPE: HEALTHCARE EXPENDITURE, BY COUNTRY (% OF GDP), 2022
TABLE 113 EUROPE: PREVALENCE OF DIABETES, 2021 VS. 2045
TABLE 114 EUROPE: WOUND CARE MARKET, BY COUNTRY, 2021–2028 (USD MILLION)
TABLE 115 EUROPE: WOUND CARE MARKET, BY PRODUCT, 2021–2028 (USD MILLION)
TABLE 116 EUROPE: ADVANCED WOUND CARE PRODUCTS MARKET, BY TYPE, 2021–2028 (USD MILLION)
TABLE 117 EUROPE: ADVANCED WOUND DRESSINGS MARKET, BY TYPE, 2021–2028 (USD MILLION)
TABLE 118 EUROPE: FOAM DRESSINGS MARKET, BY TYPE, 2021–2028 (USD MILLION)
TABLE 119 EUROPE: ADVANCED WOUND DRESSINGS MARKET, BY PROPERTY, 2021–2028 (USD MILLION)
TABLE 120 EUROPE: WOUND THERAPY DEVICES MARKET, BY TYPE, 2021–2028 (USD MILLION)
TABLE 121 EUROPE: BIOLOGICAL SKIN SUBSTITUTES MARKET, BY TYPE, 2021–2028 (USD MILLION)
TABLE 122 EUROPE: SURGICAL WOUND CARE PRODUCTS MARKET, BY TYPE, 2021–2028 (USD MILLION)
TABLE 123 EUROPE: TISSUE ADHESIVES, SEALANTS, AND GLUES MARKET, BY TYPE, 2021–2028 (USD MILLION)
TABLE 124 EUROPE: TRADITIONAL WOUND CARE PRODUCTS MARKET, BY TYPE, 2021–2028 (USD MILLION)
TABLE 125 EUROPE: WOUND CARE MARKET, BY WOUND TYPE, 2021–2028 (USD MILLION)
TABLE 126 EUROPE: WOUND CARE MARKET, BY END USER, 2021–2028 (USD MILLION)
9.3.1 RECESSION IMPACT ON EUROPEAN WOUND CARE MARKET
9.3.2 GERMANY
9.3.2.1 Large diabetic population to support wound care product development and commercialization
TABLE 127 GERMANY: WOUND CARE MARKET, BY PRODUCT, 2021–2028 (USD MILLION)
TABLE 128 GERMANY: WOUND CARE MARKET, BY END USER, 2021–2028 (USD MILLION)
9.3.3 FRANCE
9.3.3.1 Rising geriatric population to drive market growth
TABLE 129 FRANCE: WOUND CARE MARKET, BY PRODUCT, 2021–2028 (USD MILLION)
TABLE 130 FRANCE: WOUND CARE MARKET, BY END USER, 2021–2028 (USD MILLION)
9.3.4 UK
9.3.4.1 Rising incidence of chronic wounds to propel market growth
TABLE 131 UK: WOUND CARE MARKET, BY PRODUCT, 2021–2028 (USD MILLION)
TABLE 132 UK: WOUND CARE MARKET, BY END USER, 2021–2028 (USD MILLION)
9.3.5 ITALY
9.3.5.1 Improving quality and accessibility to medical care to support market growth
TABLE 133 ITALY: WOUND CARE MARKET, BY PRODUCT, 2021–2028 (USD MILLION)
TABLE 134 ITALY: WOUND CARE MARKET, BY END USER, 2021–2028 (USD MILLION)
9.3.6 SPAIN
9.3.6.1 Increasing number of road traffic accidents to propel market
TABLE 135 SPAIN: WOUND CARE MARKET, BY PRODUCT, 2021–2028 (USD MILLION)
TABLE 136 SPAIN: WOUND CARE MARKET, BY END USER, 2021–2028 (USD MILLION)
9.3.7 RUSSIA
9.3.7.1 Government focus on increasing diabetes awareness to favor market growth
TABLE 137 RUSSIA: WOUND CARE MARKET, BY PRODUCT, 2021–2028 (USD MILLION)
TABLE 138 RUSSIA: WOUND CARE MARKET, BY END USER, 2021–2028 (USD MILLION)
9.3.8 REST OF EUROPE
TABLE 139 REST OF EUROPE: WOUND CARE MARKET, BY PRODUCT, 2021–2028 (USD MILLION)
TABLE 140 REST OF EUROPE: ADVANCED WOUND CARE PRODUCTS MARKET, BY TYPE, 2021–2028 (USD MILLION)
TABLE 141 REST OF EUROPE: ADVANCED WOUND DRESSINGS MARKET, BY TYPE, 2021–2028 (USD MILLION)
TABLE 142 REST OF EUROPE: FOAM DRESSINGS MARKET, BY TYPE, 2021–2028 (USD MILLION)
TABLE 143 REST OF EUROPE: ADVANCED WOUND DRESSINGS MARKET, BY PROPERTY, 2021–2028 (USD MILLION)
TABLE 144 REST OF EUROPE: WOUND THERAPY DEVICES MARKET, BY TYPE, 2021–2028 (USD MILLION)
TABLE 145 REST OF EUROPE: BIOLOGICAL SKIN SUBSTITUTES MARKET, BY TYPE, 2021–2028 (USD MILLION)
TABLE 146 REST OF EUROPE: SURGICAL WOUND CARE PRODUCTS MARKET, BY TYPE, 2021–2028 (USD MILLION)
TABLE 147 REST OF EUROPE: TISSUE ADHESIVES, SEALANTS, AND GLUES MARKET, BY TYPE, 2021–2028 (USD MILLION)
TABLE 148 REST OF EUROPE: TRADITIONAL WOUND CARE PRODUCTS MARKET, BY TYPE, 2021–2028 (USD MILLION)
TABLE 149 REST OF EUROPE: WOUND CARE MARKET, BY WOUND TYPE, 2021–2028 (USD MILLION)
TABLE 150 REST OF EUROPE: WOUND CARE MARKET, BY END USER, 2021–2028 (USD MILLION)
9.4 ASIA PACIFIC
FIGURE 26 ASIA PACIFIC: WOUND CARE MARKET SNAPSHOT
TABLE 151 ASIA PACIFIC: WOUND CARE MARKET, BY COUNTRY, 2021–2028 (USD MILLION)
TABLE 152 ASIA PACIFIC: WOUND CARE MARKET, BY PRODUCT, 2021–2028 (USD MILLION)
TABLE 153 ASIA PACIFIC: ADVANCED WOUND CARE PRODUCTS MARKET, BY TYPE, 2021–2028 (USD MILLION)
TABLE 154 ASIA PACIFIC: ADVANCED WOUND DRESSINGS MARKET, BY TYPE, 2021–2028 (USD MILLION)
TABLE 155 ASIA PACIFIC: FOAM DRESSINGS MARKET, BY TYPE, 2021–2028 (USD MILLION)
TABLE 156 ASIA PACIFIC: ADVANCED WOUND DRESSINGS MARKET, BY PROPERTY, 2021–2028 (USD MILLION)
TABLE 157 ASIA PACIFIC: WOUND THERAPY DEVICES MARKET, BY TYPE, 2021–2028 (USD MILLION)
TABLE 158 ASIA PACIFIC: BIOLOGICAL SKIN SUBSTITUTES MARKET, BY TYPE, 2021–2028 (USD MILLION)
TABLE 159 ASIA PACIFIC: SURGICAL WOUND CARE PRODUCTS MARKET, BY TYPE, 2021–2028 (USD MILLION)
TABLE 160 ASIA PACIFIC: TISSUE ADHESIVES, SEALANTS, AND GLUES MARKET, BY TYPE, 2021–2028 (USD MILLION)
TABLE 161 ASIA PACIFIC: TRADITIONAL WOUND CARE PRODUCTS MARKET, BY TYPE, 2021–2028 (USD MILLION)
TABLE 162 ASIA PACIFIC: WOUND CARE MARKET, BY WOUND TYPE, 2021–2028 (USD MILLION)
TABLE 163 ASIA PACIFIC: WOUND CARE MARKET, BY END USER, 2021–2028 (USD MILLION)
9.4.1 RECESSION IMPACT ON ASIA PACIFIC WOUND CARE MARKET
9.4.2 CHINA
9.4.2.1 Increasing incidence of diabetic foot ulcers to drive market
TABLE 164 CHINA: WOUND CARE MARKET, BY PRODUCT, 2021–2028 (USD MILLION)
TABLE 165 CHINA: WOUND CARE MARKET, BY END USER, 2021–2028 (USD MILLION)
9.4.3 JAPAN
9.4.3.1 Presence of well-developed healthcare system to favor market growth
TABLE 166 JAPAN: WOUND CARE MARKET, BY PRODUCT, 2021–2028 (USD MILLION)
TABLE 167 JAPAN: WOUND CARE MARKET, BY END USER, 2021–2028 (USD MILLION)
9.4.4 INDIA
9.4.4.1 Growing medical tourism to support market growth
TABLE 168 INDIA: WOUND CARE MARKET, BY PRODUCT, 2021–2028 (USD MILLION)
TABLE 169 INDIA: WOUND CARE MARKET, BY END USER, 2021–2028 (USD MILLION)
9.4.5 AUSTRALIA
9.4.5.1 Increasing initiatives to spread awareness of effective wound care to propel market
TABLE 170 AUSTRALIA: WOUND CARE MARKET, BY PRODUCT, 2021–2028 (USD MILLION)
TABLE 171 AUSTRALIA: WOUND CARE MARKET, BY END USER, 2021–2028 (USD MILLION)
9.4.6 SOUTH KOREA
9.4.6.1 Rising geriatric population to aid market growth
TABLE 172 SOUTH KOREA: WOUND CARE MARKET, BY PRODUCT, 2021–2028 (USD MILLION)
TABLE 173 SOUTH KOREA: WOUND CARE MARKET, BY END USER, 2021–2028 (USD MILLION)
9.4.7 SINGAPORE
9.4.7.1 Growing prevalence of diabetes to support market growth
TABLE 174 SINGAPORE: WOUND CARE MARKET, BY PRODUCT, 2021–2028 (USD MILLION)
TABLE 175 SINGAPORE: WOUND CARE MARKET, BY END USER, 2021–2028 (USD MILLION)
9.4.8 REST OF ASIA PACIFIC
TABLE 176 REST OF ASIA PACIFIC: WOUND CARE MARKET, BY PRODUCT, 2021–2028 (USD MILLION)
TABLE 177 REST OF ASIA PACIFIC: ADVANCED WOUND CARE PRODUCTS MARKET, BY TYPE, 2021–2028 (USD MILLION)
TABLE 178 REST OF ASIA PACIFIC: ADVANCED WOUND DRESSINGS MARKET, BY TYPE, 2021–2028 (USD MILLION)
TABLE 179 REST OF ASIA PACIFIC: FOAM DRESSINGS MARKET, BY TYPE, 2021–2028 (USD MILLION)
TABLE 180 REST OF ASIA PACIFIC: ADVANCED WOUND DRESSINGS MARKET, BY PROPERTY, 2021–2028 (USD MILLION)
TABLE 181 REST OF ASIA PACIFIC: WOUND THERAPY DEVICES MARKET, BY TYPE, 2021–2028 (USD MILLION)
TABLE 182 REST OF ASIA PACIFIC: BIOLOGICAL SKIN SUBSTITUTES MARKET, BY TYPE, 2021–2028 (USD MILLION)
TABLE 183 REST OF ASIA PACIFIC: SURGICAL WOUND CARE PRODUCTS MARKET, BY TYPE, 2021–2028 (USD MILLION)
TABLE 184 REST OF ASIA PACIFIC: TISSUE ADHESIVES, SEALANTS, AND GLUES MARKET, BY TYPE, 2021–2028 (USD MILLION)
TABLE 185 REST OF ASIA PACIFIC: TRADITIONAL WOUND CARE PRODUCTS MARKET, BY TYPE, 2021–2028 (USD MILLION)
TABLE 186 REST OF ASIA PACIFIC: WOUND CARE MARKET, BY WOUND TYPE, 2021–2028 (USD MILLION)
TABLE 187 REST OF ASIA PACIFIC: WOUND CARE MARKET, BY END USER, 2021–2028 (USD MILLION)
9.5 LATIN AMERICA
TABLE 188 LATIN AMERICA: WOUND CARE MARKET, BY COUNTRY, 2021–2028 (USD MILLION)
TABLE 189 LATIN AMERICA: WOUND CARE MARKET, BY PRODUCT, 2021–2028 (USD MILLION)
TABLE 190 LATIN AMERICA: ADVANCED WOUND CARE PRODUCTS MARKET, BY TYPE, 2021–2028 (USD MILLION)
TABLE 191 LATIN AMERICA: ADVANCED WOUND DRESSINGS MARKET, BY TYPE, 2021–2028 (USD MILLION)
TABLE 192 LATIN AMERICA: FOAM DRESSINGS MARKET, BY TYPE, 2021–2028 (USD MILLION)
TABLE 193 LATIN AMERICA: ADVANCED WOUND DRESSINGS MARKET, BY PROPERTY, 2021–2028 (USD MILLION)
TABLE 194 LATIN AMERICA: WOUND THERAPY DEVICES MARKET, BY TYPE, 2021–2028 (USD MILLION)
TABLE 195 LATIN AMERICA: BIOLOGICAL SKIN SUBSTITUTES MARKET, BY TYPE, 2021–2028 (USD MILLION)
TABLE 196 LATIN AMERICA: SURGICAL WOUND CARE PRODUCTS MARKET, BY TYPE, 2021–2028 (USD MILLION)
TABLE 197 LATIN AMERICA: TISSUE ADHESIVES, SEALANTS, AND GLUES MARKET, BY TYPE, 2021–2028 (USD MILLION)
TABLE 198 LATIN AMERICA: TRADITIONAL WOUND CARE PRODUCTS MARKET, BY TYPE, 2021–2028 (USD MILLION)
TABLE 199 LATIN AMERICA: WOUND CARE MARKET, BY WOUND TYPE, 2021–2028 (USD MILLION)
TABLE 200 LATIN AMERICA: WOUND CARE MARKET, BY END USER, 2021–2028 (USD MILLION)
9.5.1 RECESSION IMPACT ON LATIN AMERICAN WOUND CARE MARKET
9.5.2 BRAZIL
9.5.2.1 Largest healthcare market in Latin America
TABLE 201 BRAZIL: WOUND CARE MARKET, BY PRODUCT, 2021–2028 (USD MILLION)
TABLE 202 BRAZIL: WOUND CARE MARKET, BY END USER, 2021–2028 (USD MILLION)
9.5.3 MEXICO
9.5.3.1 Increasing burden of diabetes to propel market
TABLE 203 MEXICO: WOUND CARE MARKET, BY PRODUCT, 2021–2028 (USD MILLION)
TABLE 204 MEXICO: WOUND CARE MARKET, BY END USER, 2021–2028 (USD MILLION)
9.5.4 REST OF LATIN AMERICA
TABLE 205 REST OF LATIN AMERICA: WOUND CARE MARKET, BY PRODUCT, 2021–2028 (USD MILLION)
TABLE 206 REST OF LATIN AMERICA: ADVANCED WOUND CARE PRODUCTS MARKET, BY TYPE, 2021–2028 (USD MILLION)
TABLE 207 REST OF LATIN AMERICA: ADVANCED WOUND DRESSINGS MARKET, BY TYPE, 2021–2028 (USD MILLION)
TABLE 208 REST OF LATIN AMERICA: FOAM DRESSINGS MARKET, BY TYPE, 2021–2028 (USD MILLION)
TABLE 209 REST OF LATIN AMERICA: ADVANCED WOUND DRESSINGS MARKET, BY PROPERTY, 2021–2028 (USD MILLION)
TABLE 210 REST OF LATIN AMERICA: WOUND THERAPY DEVICES MARKET, BY TYPE, 2021–2028 (USD MILLION)
TABLE 211 REST OF LATIN AMERICA: BIOLOGICAL SKIN SUBSTITUTES MARKET, BY TYPE, 2021–2028 (USD MILLION)
TABLE 212 REST OF LATIN AMERICA: SURGICAL WOUND CARE PRODUCTS MARKET, BY TYPE, 2021–2028 (USD MILLION)
TABLE 213 REST OF LATIN AMERICA: TISSUE ADHESIVES, SEALANTS, AND GLUES MARKET, BY TYPE, 2021–2028 (USD MILLION)
TABLE 214 REST OF LATIN AMERICA: TRADITIONAL WOUND CARE PRODUCTS MARKET, BY TYPE, 2021–2028 (USD MILLION)
TABLE 215 REST OF LATIN AMERICA: WOUND CARE MARKET, BY WOUND TYPE, 2021–2028 (USD MILLION)
TABLE 216 REST OF LATIN AMERICA: WOUND CARE MARKET, BY END USER, 2021–2028 (USD MILLION)
9.6 MIDDLE EAST & AFRICA
9.6.1 RISING PREVALENCE OF DIABETES TO SUPPORT MARKET GROWTH
TABLE 217 MIDDLE EAST & AFRICA: WOUND CARE MARKET, BY PRODUCT, 2021–2028 (USD MILLION)
TABLE 218 MIDDLE EAST & AFRICA: ADVANCED WOUND CARE PRODUCTS MARKET, BY TYPE, 2021–2028 (USD MILLION)
TABLE 219 MIDDLE EAST & AFRICA: ADVANCED WOUND DRESSINGS MARKET, BY TYPE, 2021–2028 (USD MILLION)
TABLE 220 MIDDLE EAST & AFRICA: FOAM DRESSINGS MARKET, BY TYPE, 2021–2028 (USD MILLION)
TABLE 221 MIDDLE EAST & AFRICA: ADVANCED WOUND DRESSINGS MARKET, BY PROPERTY, 2021–2028 (USD MILLION)
TABLE 222 MIDDLE EAST & AFRICA: WOUND THERAPY DEVICES MARKET, BY TYPE, 2021–2028 (USD MILLION)
TABLE 223 MIDDLE EAST & AFRICA: BIOLOGICAL SKIN SUBSTITUTES MARKET, BY TYPE, 2021–2028 (USD MILLION)
TABLE 224 MIDDLE EAST & AFRICA: SURGICAL WOUND CARE PRODUCTS MARKET, BY TYPE, 2021–2028 (USD MILLION)
TABLE 225 MIDDLE EAST & AFRICA: TISSUE ADHESIVES, SEALANTS, AND GLUES MARKET, BY TYPE, 2021–2028 (USD MILLION)
TABLE 226 MIDDLE EAST & AFRICA: TRADITIONAL WOUND CARE PRODUCTS MARKET, BY TYPE, 2021–2028 (USD MILLION)
TABLE 227 MIDDLE EAST & AFRICA: WOUND CARE MARKET, BY WOUND TYPE, 2021–2028 (USD MILLION)
TABLE 228 MIDDLE EAST & AFRICA: WOUND CARE MARKET, BY END USER, 2021–2028 (USD MILLION)
9.6.2 RECESSION IMPACT ON MIDDLE EAST & AFRICAN WOUND CARE MARKET
10 COMPETITIVE LANDSCAPE (Page No. - 237)
10.1 OVERVIEW
10.2 STRATEGIES ADOPTED BY KEY PLAYERS
10.2.1 OVERVIEW OF STRATEGIES DEPLOYED BY PLAYERS IN WOUND CARE MARKET
TABLE 229 OVERVIEW OF STRATEGIES ADOPTED BY KEY WOUND CARE COMPANIES
10.3 REVENUE ANALYSIS OF TOP MARKET PLAYERS
FIGURE 27 REVENUE ANALYSIS OF TOP PLAYERS IN WOUND CARE MARKET, 2018–2022 (USD MILLION)
10.4 MARKET SHARE ANALYSIS
10.4.1 WOUND CARE MARKET
FIGURE 28 WOUND CARE MARKET SHARE ANALYSIS, BY KEY PLAYER, 2022
TABLE 230 WOUND CARE MARKET: DEGREE OF COMPETITION
10.4.2 ADVANCED WOUND CARE MARKET
FIGURE 29 ADVANCED WOUND CARE MARKET SHARE ANALYSIS, BY KEY PLAYER, 2022
10.4.3 NEGATIVE PRESSURE WOUND THERAPY (NPWT) MARKET
FIGURE 30 NEGATIVE PRESSURE WOUND THERAPY MARKET SHARE ANALYSIS, BY KEY PLAYER, 2022
10.4.4 ADVANCED WOUND DRESSINGS MARKET
FIGURE 31 ADVANCED WOUND DRESSINGS MARKET SHARE ANALYSIS, BY KEY PLAYER, 2022
10.4.5 SURGICAL SUTURES MARKET
FIGURE 32 SURGICAL SUTURES MARKET SHARE ANALYSIS, BY KEY PLAYER, 2022
10.4.6 DEBRIDEMENT DEVICES MARKET
FIGURE 33 DEBRIDEMENT DEVICES MARKET SHARE ANALYSIS, BY KEY PLAYER, 2022
10.4.7 TRADITIONAL AND SURGICAL WOUND CARE PRODUCTS MARKET
TABLE 231 TRADITIONAL AND SURGICAL WOUND CARE PRODUCTS MARKET RANKING ANALYSIS, BY KEY PLAYER, 2022
10.5 COMPANY EVALUATION MATRIX
10.5.1 LIST OF EVALUATED VENDORS
10.5.2 STARS
10.5.3 EMERGING LEADERS
10.5.4 PERVASIVE PLAYERS
10.5.5 PARTICIPANTS
FIGURE 34 WOUND CARE MARKET: COMPANY EVALUATION MATRIX FOR KEY PLAYERS, 2022
10.5.6 COMPANY FOOTPRINT
FIGURE 35 PRODUCT AND REGIONAL FOOTPRINT ANALYSIS OF TOP PLAYERS IN WOUND CARE MARKET
TABLE 232 PRODUCT FOOTPRINT ANALYSIS OF TOP PLAYERS IN WOUND CARE MARKET
TABLE 233 REGIONAL FOOTPRINT ANALYSIS OF TOP PLAYERS IN WOUND CARE MARKET
10.6 STARTUP/SME EVALUATION MATRIX
10.6.1 PROGRESSIVE COMPANIES
10.6.2 RESPONSIVE COMPANIES
10.6.3 DYNAMIC COMPANIES
10.6.4 STARTING BLOCKS
FIGURE 36 WOUND CARE MARKET: COMPANY EVALUATION MATRIX FOR STARTUPS/SMES, 2022
10.6.5 COMPETITIVE BENCHMARKING
TABLE 234 WOUND CARE MARKET: COMPETITIVE BENCHMARKING OF KEY PLAYERS
TABLE 235 WOUND CARE MARKET: DETAILED LIST OF KEY STARTUPS/SMES
10.7 COMPETITIVE SCENARIO
10.7.1 PRODUCT LAUNCHES
TABLE 236 KEY PRODUCT LAUNCHES
10.7.2 DEALS
TABLE 237 KEY DEALS
11 COMPANY PROFILES (Page No. - 253)
11.1 KEY PLAYERS
(Business Overview, Products Offered, Recent Developments, and MnM View (Key strengths/Right to Win, Strategic Choices Made, and Weaknesses and Competitive Threats))*
11.1.1 3M COMPANY
TABLE 238 3M COMPANY: COMPANY OVERVIEW
FIGURE 37 3M COMPANY: COMPANY SNAPSHOT (2022)
11.1.2 CARDINAL HEALTH
TABLE 239 CARDINAL HEALTH: COMPANY OVERVIEW
FIGURE 38 CARDINAL HEALTH: COMPANY SNAPSHOT (2022)
11.1.3 MEDTRONIC PLC
TABLE 240 MEDTRONIC PLC: COMPANY OVERVIEW
FIGURE 39 MEDTRONIC PLC: COMPANY SNAPSHOT (2022)
11.1.4 SMITH & NEPHEW PLC
TABLE 241 SMITH & NEPHEW PLC: COMPANY OVERVIEW
FIGURE 40 SMITH & NEPHEW PLC: COMPANY SNAPSHOT (2022)
11.1.5 MÖLNLYCKE HEALTH CARE AB
TABLE 242 MÖLNLYCKE HEALTH CARE AB: COMPANY OVERVIEW
FIGURE 41 MÖLNLYCKE HEALTH CARE AB: COMPANY SNAPSHOT (2022)
11.1.6 B. BRAUN MELSUNGEN AG
TABLE 243 B. BRAUN MELSUNGEN AG: COMPANY OVERVIEW
FIGURE 42 B. BRAUN MELSUNGEN AG: COMPANY SNAPSHOT (2022)
11.1.7 BAXTER INTERNATIONAL, INC.
TABLE 244 BAXTER INTERNATIONAL, INC.: COMPANY OVERVIEW
FIGURE 43 BAXTER INTERNATIONAL, INC.: COMPANY SNAPSHOT (2022)
11.1.8 CONVATEC GROUP PLC
TABLE 245 CONVATEC GROUP PLC: COMPANY OVERVIEW
FIGURE 44 CONVATEC GROUP: COMPANY SNAPSHOT (2022)
11.1.9 PAUL HARTMANN AG
TABLE 246 PAUL HARTMANN AG: COMPANY OVERVIEW
FIGURE 45 PAUL HARTMANN AG: COMPANY SNAPSHOT (2022)
11.1.10 COLOPLAST A/S
TABLE 247 COLOPLAST A/S: COMPANY OVERVIEW
FIGURE 46 COLOPLAST A/S: COMPANY SNAPSHOT (2022)
11.1.11 ORGANOGENESIS INC.
TABLE 248 ORGANOGENESIS INC.: COMPANY OVERVIEW
FIGURE 47 ORGANOGENESIS INC.: COMPANY SNAPSHOT (2022)
11.1.12 MIMEDX GROUP, INC.
TABLE 249 MIMEDX GROUP, INC.: COMPANY OVERVIEW
FIGURE 48 MIMEDX GROUP, INC.: COMPANY SNAPSHOT (2022)
11.1.13 INTEGRA LIFESCIENCES CORPORATION
TABLE 250 INTEGRA LIFESCIENCES CORPORATION: COMPANY OVERVIEW
FIGURE 49 INTEGRA LIFESCIENCES CORPORATION: COMPANY SNAPSHOT (2022)
11.1.14 BIOVENTUS LLC
TABLE 251 BIOVENTUS LLC: COMPANY OVERVIEW
FIGURE 50 BIOVENTUS LLC: COMPANY SNAPSHOT (2022)
11.1.15 ZIMMER BIOMET HOLDINGS, INC.
TABLE 252 ZIMMER BIOMET HOLDINGS, INC.: COMPANY OVERVIEW
FIGURE 51 ZIMMER BIOMET HOLDINGS, INC.: COMPANY SNAPSHOT (2022)
11.2 OTHER PLAYERS
11.2.1 ETHICON, INC.
TABLE 253 ETHICON, INC.: COMPANY OVERVIEW
11.2.2 DEROYAL INDUSTRIES, INC.
TABLE 254 DEROYAL INDUSTRIES, INC.: COMPANY OVERVIEW
11.2.3 KERECIS
TABLE 255 KERECIS: COMPANY OVERVIEW
11.2.4 ACELL INC.
TABLE 256 ACELL INC.: COMPANY OVERVIEW
11.2.5 LOHMANN & RAUSCHER GMBH & CO. KG
TABLE 257 LOHMANN & RAUSCHER GMBH & CO. KG: COMPANY OVERVIEW
11.2.6 MEDELA AG
TABLE 258 MEDELA AG: COMPANY OVERVIEW
11.2.7 TALLEY GROUP LTD.
TABLE 259 TALLEY GROUP LTD.: COMPANY OVERVIEW
11.2.8 WELCARE INDUSTRIES S.P.A
TABLE 260 WELCARE INDUSTRIES S.P.A: COMPANY OVERVIEW
11.2.9 WUHAN VSD MEDICAL SCIENCE & TECHNOLOGY CO., LTD.
TABLE 261 WUHAN VSD MEDICAL SCIENCE & TECHNOLOGY CO., LTD.: COMPANY OVERVIEW
11.2.10 PENSAR MEDICAL, LLC
TABLE 262 PENSAR MEDICAL, LLC: COMPANY OVERVIEW
11.2.11 HAROMED BV
TABLE 263 HAROMED BV: COMPANY OVERVIEW
11.2.12 DERMARITE INDUSTRIES, LLC
TABLE 264 DERMARITE INDUSTRIES, LLC: COMPANY OVERVIEW
11.2.13 MEDLINE INDUSTRIES, INC.
TABLE 265 MEDLINE INDUSTRIES, INC.: COMPANY OVERVIEW
11.2.14 ADVANCIS MEDICAL LLC
TABLE 266 ADVANCIS MEDICAL LLC: COMPANY OVERVIEW
11.2.15 MIL LABORATORIES PVT. LTD.
TABLE 267 MIL LABORATORIES PVT. LTD.: COMPANY OVERVIEW
*Details on Business Overview, Products Offered, Recent Developments, and MnM View (Key strengths/Right to Win, Strategic Choices Made, and Weaknesses and Competitive Threats) might not be captured in case of unlisted companies.
12 APPENDIX (Page No. - 332)
12.1 DISCUSSION GUIDE
12.2 KNOWLEDGESTORE: MARKETSANDMARKETS’ SUBSCRIPTION PORTAL
12.3 CUSTOMIZATION OPTIONS
12.4 RELATED REPORTS
12.5 AUTHOR DETAILS


 Generating Response ...


Growth opportunities and latent adjacency in Wound Care Market
We want in-depth details of Wound Care Market Size, Growth, Forecast Research Report [2029 - 2030]
Which is the fastest growing market of Wound Care Market?
Can you enlighten us with your market intelligence to grow and sustain in Wound Care Market?