
3D Printing Metals Market

3D Printing Metals Market by Metal Type (Titanium, Aluminum, Steel, Nickel & Cobalt, Other Metal Types), Form (Filaments, Powder), Technology (Powder Bed Fusion, Directed Energy Deposition, Binder Jetting, Metal Extrusion, Other Technologies), End-use Industry (Aerospace & Defense, Automotive, Medical & Dental, Other End-Use Industries), and Region - Global Forecast to 2030


3D PRINTING METALS MARKET SIZE & ANALYSIS
Source: Secondary Research, Interviews with Experts, MarketsandMarkets Analysis | Updated on : March 17, 2026
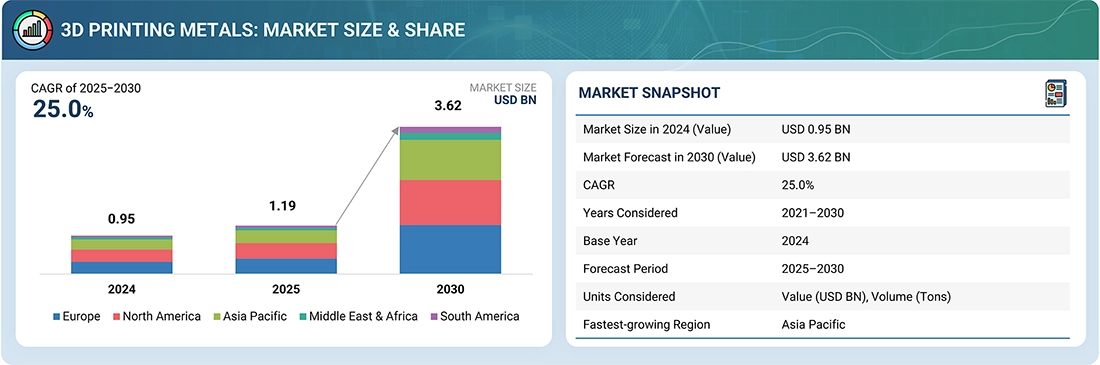
The 3D printing metals market is projected to reach USD 3.62 billion by 2030 from USD 1.19 billion in 2025, at a CAGR of 25.0% from 2025 to 2030. Advancements in technology and the growing number of manufacturers in key end-use industries are significantly driving the 3D printing metals market. Developments in additive manufacturing processes, such as powder bed fusion (PBF), directed energy deposition (DED), and binder jetting, are enhancing manufacturing speed, accuracy, material efficiency, and part durability. As a result, metal 3D printing is increasingly seen as a viable solution for full-scale production rather than just for prototyping.
KEY TAKEAWAYS
-
BY METAL TYPEThe 3D printing metals market comprises various metal types, including titanium, nickel & cobalt, stainless steel, aluminum, and other metal types. The titanium metal type accounted for the largest share due to its high strength property and ability to withstand extreme conditions in various applications.
-
BY FORMThe 3D printing metals market is classified into two different forms: powder and filament. The powder form led the market as metal powders have an exceptional ability to bind molecules and can form high-density products with complex geometries, which are used to manufacture engine parts and components.
-
BY TECHNOLOGYMajor technologies used for manufacturing 3D-printed metal objects include powder bed fusion, directed energy deposition, binder jetting, and metal extrusion, among others. The powder bed fusion technology is projected to exhibit the highest growth rate due to rising demand from the automotive, aerospace, and defense industries to create lightweight parts.
-
BY END-USE INDUSTRYThe 3D printing metals market is segmented into aerospace & defense, automotive, medical & dental, and other end-use industries. The aerospace and defense industry is the fastest-growing sector, as it requires lightweight and complex 3D-printed metal components to reduce the overall weight of aircraft.
-
BY REGIONThe 3D printing metals market covers Europe, North America, Asia Pacific, South America, the Middle East, and Africa. Europe is the largest market for 3D printing metals, driven by its strong industrial base, which includes major aerospace and automotive players such as Airbus and Rolls-Royce. These companies are leading the adoption of 3D printing, alongside significant government and EU investments in R&D, which foster innovation and advanced manufacturing.
-
COMPETITVE LANDSCAPEMajor market players have adopted both organic and inorganic strategies, including partnerships and investments. For instance, General Electric Company (US), Hoganas AB (Sweden), and Sandvik AB (Sweden) have entered into several agreements and partnerships to meet the growing demand for 3D printing metals in innovative applications.
The market for 3D printing metals is growing rapidly as end-use sectors, such as aerospace & defense, automotive, and healthcare, are increasingly adopting metal 3D printing to address needs for lightweight components, intricate geometries, shortened development times, and reduced material waste. The growing adoption of these solutions by manufacturers is driving competition and innovation, resulting in the development of more affordable systems, increased production scalability, and greater industry acceptance. The growing adoption of recycled metals and eco-friendly process innovations has further spurred market growth.
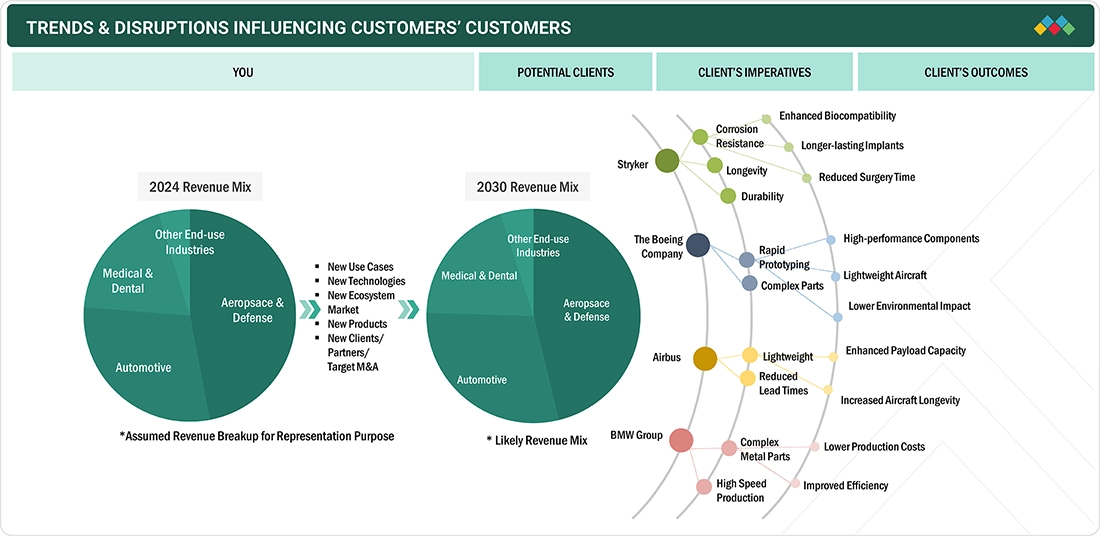
TRENDS & DISRUPTIONS IMPACTING CUSTOMERS' CUSTOMERS
Changes in customer trends or disruptions affect consumers’ businesses. These shifts influence the revenues of end users. As a result, the revenue changes for end users are likely to impact the revenues of 3D printing metal suppliers, which, in turn, affect the revenues of 3D printing metal manufacturers.
Source: Secondary Research, Interviews with Experts, MarketsandMarkets Analysis
MARKET DYNAMICS
Level
-
Increasing demand from aerospace & defense and automotive industries

-
Mass customization of products with complex design and structure

Level
-
Limitation of printer size

-
High metal cost

Level
-
Potential to enhance manufacturing and supply chain management

-
Emerging applications of 3D printing metals

Level
-
Specific material requirements

-
Longer build times

Source: Secondary Research, Interviews with Experts, MarketsandMarkets Analysis
Driver: Increasing demand from aerospace & defense industries
The growing demand from the aerospace & defense sector is significantly driving the market for 3D printing metals, largely due to the industry’s high-performance specifications and innovative manufacturing practices. Metal 3D printing offers benefits in creating ultra-lightweight, high-strength, and highly intricate parts that are needed to enhance fuel efficiency, payload capacity, and aerodynamic capability in aircraft and spacecraft. Parts such as turbine blades, engine mounts, brackets, and heat exchangers are being manufactured using additive processes like powder bed fusion and directed energy deposition, which offer greater design freedom and material efficiency.
Restraint: High metal cost
High prices of metals serve as a major restraining factor for the expansion of the 3D printing metals market. With respect to conventional raw materials, metal powders used in additive manufacturing, such as titanium, nickel, and cobalt alloys, are more costly due to the stringent specifications for particle size, form, and purity. Such powders undergo rigorous processing and quality testing, which drives up their manufacturing cost. For example, 3D printing powder titanium is several times more expensive than bulk titanium used in traditional production. The premium cost of materials restricts the economic viability of metal 3D printing, especially in price-conscious markets or for mass production, where conventional manufacturing processes remain cheaper.
Opportunity: Emerging applications of 3D printing metals
As the technology reaches maturity, markets outside of aerospace & defense, such as medical, energy, marine, and tooling, are increasingly looking into and embracing metal additive manufacturing for its capacity to generate intricate, high-performance components with shorter lead times and reduced material consumption. In the medical field, 3D printing allows for the manufacturing of patient-specific implants, prosthetics, and surgical tools made from biocompatible metals such as titanium. In energy, it enables the production of long-lasting, corrosion-resistant components for turbines, heat exchangers, and drilling rigs. New uses in consumer electronics and high-end accessories, including customized metal cases, jewelry, and timepieces, are also fueling demand for high-precision, aesthetically pleasing metal components.
Challenge: Specific material requirements
Material requirements are very specific in the 3D printing of the metals industry, as not all alloys and metals can be easily suited for additive manufacturing. For a metal to be successfully 3D printed, it must comply with stringent requirements for powder quality, including particle size, shape, flowability, and purity. The manufacturing of such high-quality metal powders is challenging and expensive, typically achieved through the use of specialized atomization processes. This renders appropriate feedstock scarce and costly, limiting the availability of materials and increasing the general cost of production.
3D Printing Metals Market: COMMERCIAL USE CASES ACROSS INDUSTRIES
| COMPANY | USE CASE DESCRIPTION | BENEFITS |
|---|---|---|
 |
Produces patient-specific surgical guides and orthopedic implants via metal additive manufacturing | Complex geometries for anatomical fit, reduced lead time for custom parts, lightweight implants with optimized strength, lower waste |
 |
Manufactures lightweight fan blades and structural brackets for jet engines using 3D-printed high-performance alloys | Weight reduction improves fuel efficiency, integrated assembly reduces part count, enhanced high-temperature performance, shorter supply chain |
 |
Fabricates rapid-prototype tooling inserts and end-use metal components for engine and chassis assemblies | Dramatic tooling lead-time reduction (weeks to days), on-demand spare parts, design flexibility for iterative testing, cost savings on small batches |
Logos and trademarks shown above are the property of their respective owners. Their use here is for informational and illustrative purposes only.
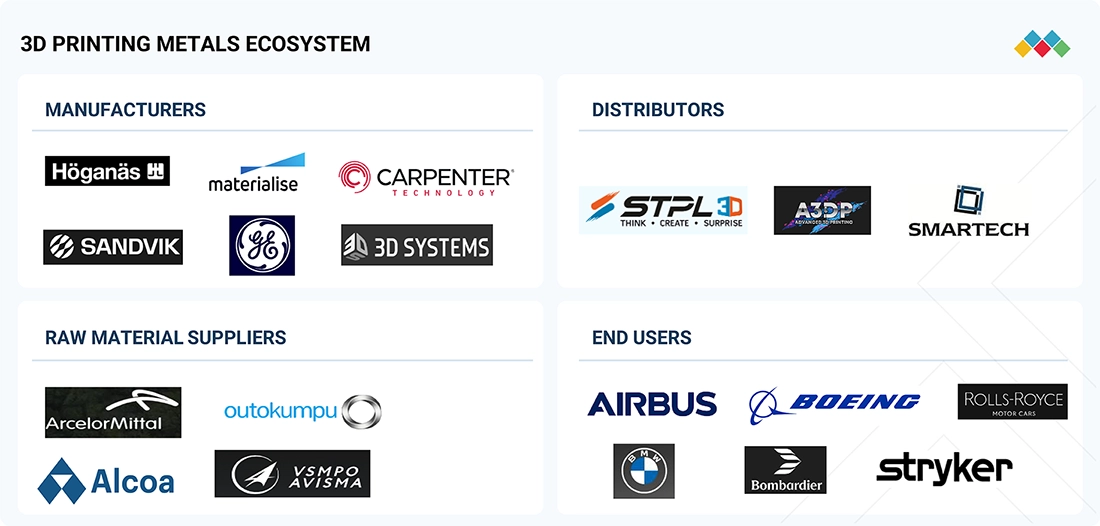
MARKET ECOSYSTEM
The 3D printing metals ecosystem analysis involves identifying and analyzing interconnected relationships among various stakeholders, including raw material suppliers, manufacturers, distributors, and end users. The raw material suppliers provide high-quality metal powders or filaments to 3D printing metal manufacturers. The distributors and suppliers establish contact between the manufacturing companies and end users to streamline the supply chain, increasing operational efficiency and profitability.
Logos and trademarks shown above are the property of their respective owners. Their use here is for informational and illustrative purposes only.
MARKET SEGMENTS
Source: Secondary Research, Interviews with Experts, MarketsandMarkets Analysis
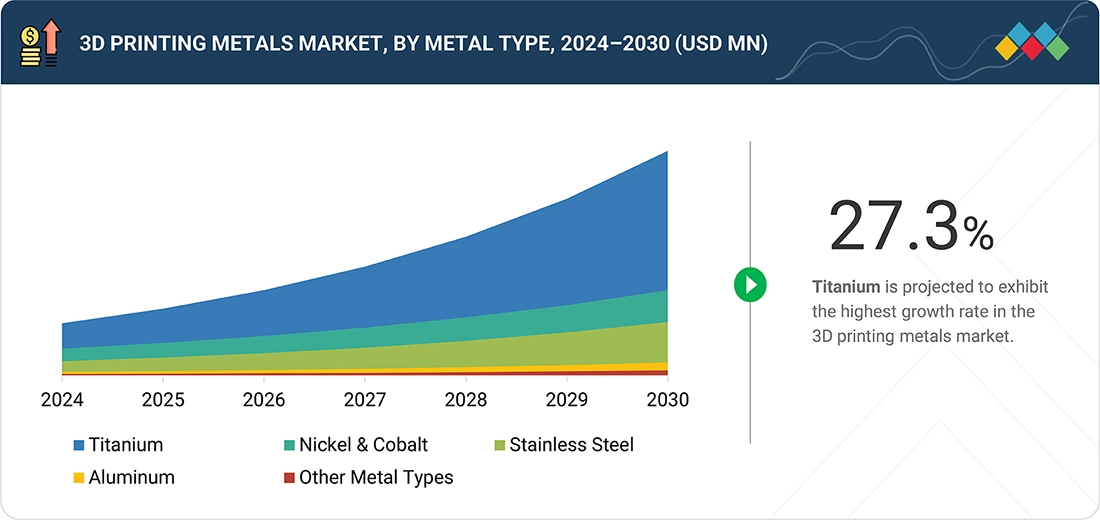
3D Printing Metals Market, By Metal Type
In 2024, titanium metal held the highest share in the 3D printing metals market by metal type. Its excellent high-strength-to-weight ratio, corrosion resistance, and great biocompatibility closely match the requirements of major end-use industries such as aerospace, medical, and automotive. Titanium is particularly known for its excellent high-strength-to-weight ratio, corrosion resistance, and superior biocompatibility, which make it perfectly suited for the production of light and strong components such as high-strength aircraft components, engine parts, orthopedic implants, and dental implants
3D Printing Metals Market, By Form
The powder form accounted for the largest market share, driven by demand for lightweight, complex, and high-strength parts in the aerospace, automotive, healthcare, and defense industries. Powder-based additive manufacturing provides the precision and quality needed for advanced applications, making powder the preferred material for industrial-scale production and prototyping. Growth is further supported by advancements in metal powders, printing technologies, and recycling capabilities, enhancing sustainability and cost efficiency.
3D Printing Metals Market, By Technology
Powder bed fusion (PBF) held the largest share in the 3D printing metals market due to its precision, efficient material use, and widespread adoption in high-performance industries. PBF encompasses techniques like selective laser melting (SLM) and electron beam melting (EBM), which utilize a high-energy heat source to selectively melt thin layers of metal powder. This process enables the creation of complex geometries with excellent mechanical properties and tight dimensional accuracy, making it highly valuable in sectors such as aerospace, medical, automotive, and defense.
3D Printing Metals Market, By End-use Industry
In 2024, the aerospace and defense sector held the largest share of the 3D printing metals market because it was among the first to adopt metal additive manufacturing and reap the benefits it offers for high-performance, mission-critical parts. Both industries require lightweight, strong, and geometrically complex parts that can withstand harsh conditions, which metal 3D printing is well-suited to provide. Techniques such as powder bed fusion (PBF) and directed energy deposition (DED) enable the creation of intricate structures like turbine blades, engine components, airframe parts, and heat exchangers with improved mechanical strength and reduced weight.
REGION
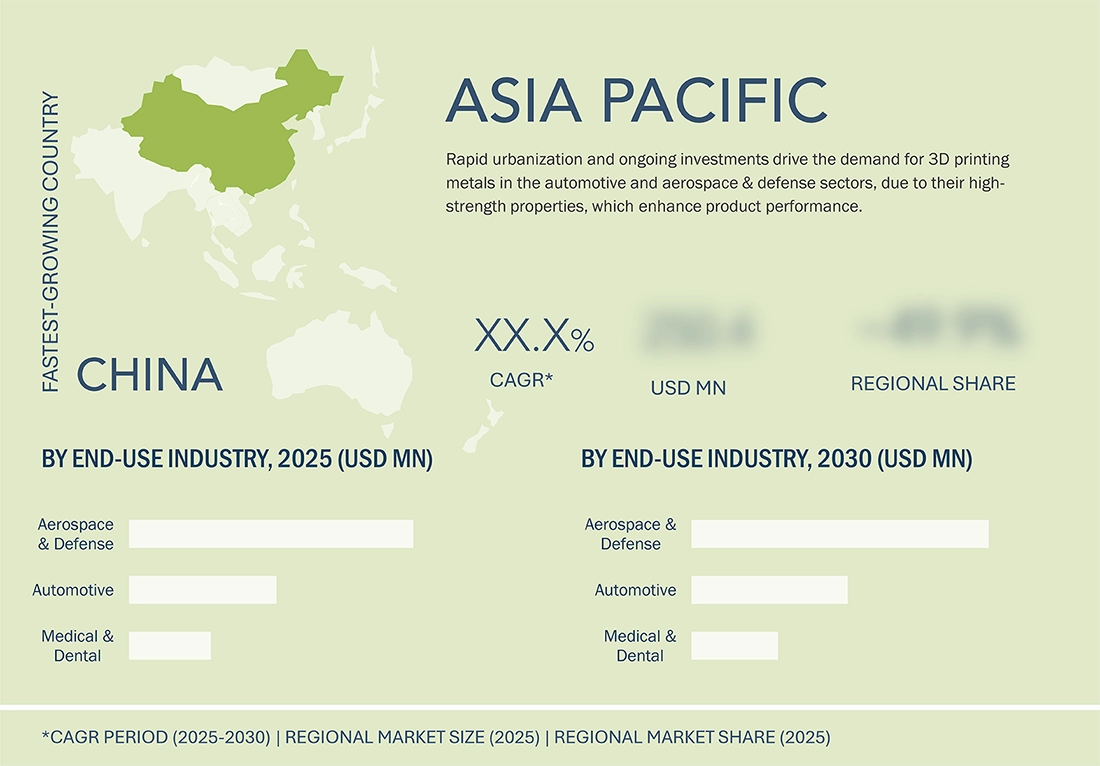
Asia Pacific to be fastest-growing region in global 3D printing metals market during forecast period
The Asia Pacific region is expected to be the fastest-growing market for 3D printing metals, mainly because of rapid industrialization and emerging economies' increasing demand for advanced manufacturing. Supportive government policies and initiatives like China's "Made in China 2025," India's aerospace investments, and South Korea's smart manufacturing efforts are driving technology adoption and infrastructure growth. The region's strong industrial base in automotive, aerospace & defense, and medical & dental sectors, along with rising private investments and industry collaborations, is speeding up growth. The integration of AI and machine learning in 3D printing processes further boosts efficiency and innovation.
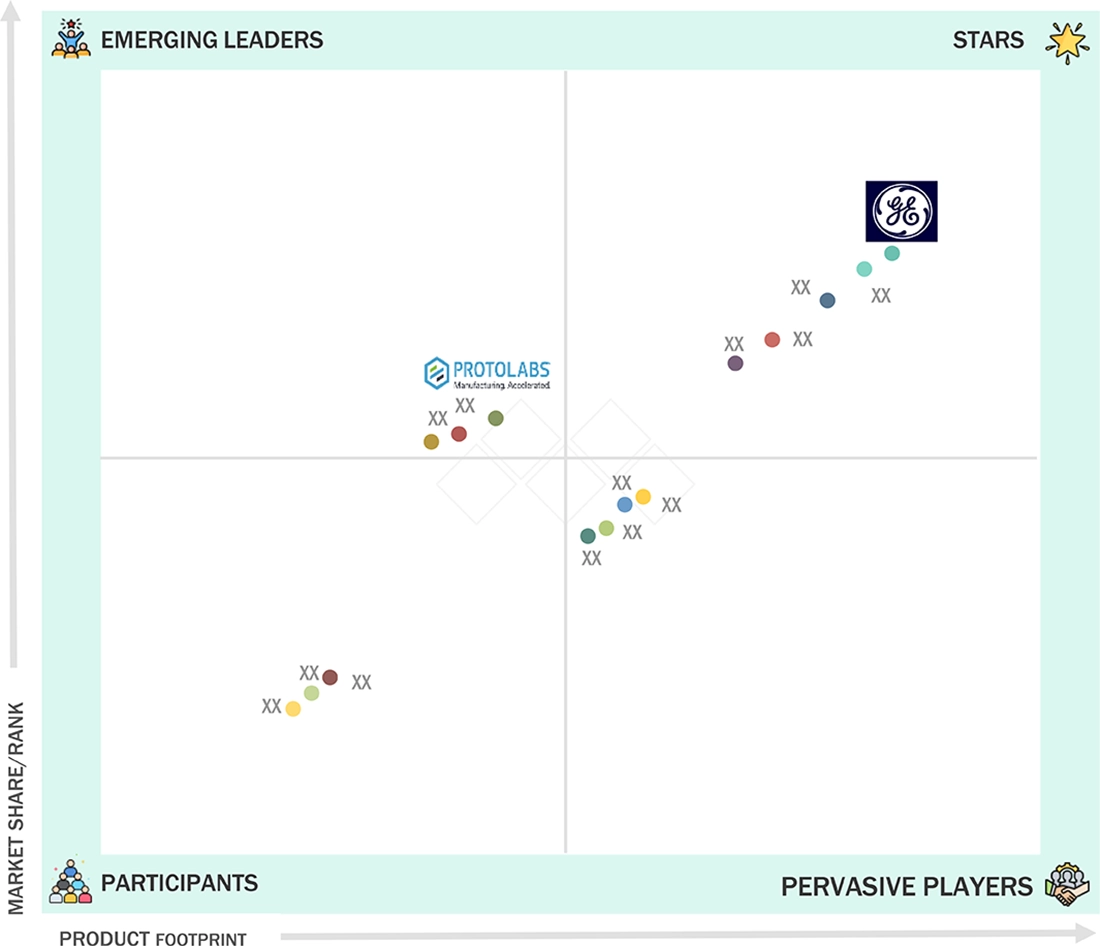
3D Printing Metals Market: COMPANY EVALUATION MATRIX
In the 3D printing metals market matrix, General Electric Company (Star) leads through its additive manufacturing division, GE Additive, which develops advanced metal 3D printers, materials, and software primarily supporting aerospace, automotive, power, and space industries. Proto Labs (Emerging Leader) is gaining visibility as it utilizes large-scale industrial printers like GE’s X Line 2000R to produce bigger, complex aluminum and Inconel parts with high production rates. While General Electric Company dominates through scale and a diverse portfolio, Proto Labs shows significant potential to move toward the leaders’ quadrant as demand for 3D printing metals continues to rise.
Source: Secondary Research, Interviews with Experts, MarketsandMarkets Analysis
KEY MARKET PLAYERS
MARKET SCOPE
| REPORT METRIC | DETAILS |
|---|---|
| Market Size in 2024 (Value) | USD 0.95 Billion |
| Market Forecast in 2030 (Value) | USD 3.62 Billion |
| Growth Rate | CAGR of 25.0% from 2025-2030 |
| Years Considered | 2021-2030 |
| Base Year | 2024 |
| Forecast Period | 2025-2030 |
| Units Considered | Value (USD Thousand/Billion), Volume (Ton) |
| Report Coverage | Revenue forecast, company ranking, competitive landscape, growth factors, and trends. |
| Segments Covered |
|
| Regions Covered | North America, Asia Pacific, Europe, South America, Middle East & Africa |
WHAT IS IN IT FOR YOU: 3D Printing Metals Market REPORT CONTENT GUIDE
DELIVERED CUSTOMIZATIONS
We have successfully delivered the following deep-dive customizations:
| CLIENT REQUEST | CUSTOMIZATION DELIVERED | VALUE ADDS |
|---|---|---|
| APAC-based 3D Printing Metal Manufacturers |
|
|
| Aerospace & Defense OEMs / Tier-1 Suppliers |
|
|
| Raw Material Distributors |
|
|
| Industrial 3D Printing Service Providers |
|
|
RECENT DEVELOPMENTS
- April 2025 : Materialise partnered with One Click Metal to integrate the company’s next-generation Build Processor (NxG BP) into One Click Metal’s metal 3D printing ecosystem. This collaboration aims to streamline and simplify additive manufacturing workflows, empowering users, especially in the mid-market sector, with more efficient, flexible, and scalable 3D printing solutions.
- April 2025 : Titomic entered into a strategic partnership with Metal Powder Works to integrate MPW’s DirectPowder technology into Titomic’s cold spray systems. This collaboration aims to optimize metal powder production for critical applications in aerospace, oil & gas, energy, MRO, and other high-tech industries.
- March 2025 : Renishaw plc collaborated with Metalpine, an Austrian producer of high-quality metal powders, to develop additive manufacturing (AM) solutions for marine applications. The partnership is focused on creating copper-nickel alloy (CuNi) powders for AM to enable a major European naval force to manufacture replacement parts in-house using Renishaw’s RenAM 500Q Flex system.
Table of Contents
 Exclusive indicates content/data unique to MarketsandMarkets and not available with any competitors.
Methodology
The study involves two major activities in estimating the current market size for the 3D printing metals market. Exhaustive secondary research was done to collect information on the market, peer market, and parent market. The next step was to validate these findings, assumptions, and sizing with industry experts across the value chain through primary research. Both top-down and bottom-up approaches were employed to estimate the complete market size. After that, market breakdown and data triangulation were used to estimate the market size of segments and subsegments.
Secondary Research
Secondary sources referred to for this research study include financial statements of companies offering 3D printing metals and information from various trade, business, and professional associations. Secondary research has been used to obtain critical information about the industry’s value chain, the total pool of key players, market classification, and segmentation according to industry trends to the bottom-most level and regional markets. The secondary data was collected and analyzed to arrive at the overall size of the 3D printing metals market, which was validated by primary respondents.
Primary Research
Extensive primary research was conducted after obtaining information regarding the 3D printing metals market scenario through secondary research. Several primary interviews were conducted with market experts from both the demand and supply sides across major countries of North America, Europe, Asia Pacific, the Middle East & Africa, and South America. Primary data was collected through questionnaires, emails, and telephonic interviews. The primary sources from the supply side included various industry experts, such as chief experience officers (CXOs), vice presidents (VPs), business development/marketing directors, product development/innovation teams, related key executives from the 3D printing metals industry, system integrators, component providers, distributors, and key opinion leaders. Primary interviews were conducted to gather insights such as market statistics, data on revenue collected from the products and services, market breakdowns, market size estimations, market forecasting, and data triangulation. Primary research also helped in understanding the various trends related to metal type, form, technology, end-use industry, and region. Stakeholders from the demand side, such as CIOs, CTOs, CSOs, and installation teams of the customers/end users of 3D printing metal services, were interviewed to understand the buyer’s perspective on the suppliers, products, component providers, and their current usage of 3D printing metals and future outlook of their business which will affect the overall market.
Breakup of Primary Research

To know about the assumptions considered for the study, download the pdf brochure
Market Size Estimation
The research methodology used to estimate the size of the 3D printing metals market includes the following details. The market size was determined from the demand side. The market was upsized based on the demand for 3D printing metals in different applications at the regional level. Such procurements provide information on the demand aspects of the 3D printing metals industry for each application. For each application, all possible segments of the 3D printing metals market were integrated and mapped.

Data Triangulation
After arriving at the overall size from the market size estimation process explained above, the total market was split into several segments and subsegments. The data triangulation and market breakdown procedures explained below were implemented, wherever applicable, to complete the overall market engineering process and arrive at the exact statistics for various market segments and subsegments. The data was triangulated by studying various factors and trends from the demand and supply sides. Along with this, the market size was validated using both the top-down and bottom-up approaches.
Market Definition
The printing of a three-dimensional (3D) object from a digital file using metals is known as metal 3D printing technology. A metal 3D printer uses a laser beam to sinter the metal and place it layer-on-layer. These metals are available in powder and filament forms. Major metals utilized in 3D printing include titanium, aluminum, stainless steel, and nickel. These metals are sintered using powder bed fusion, directed energy deposition, binder jetting, and metal extrusion technologies. These technologies are often incorporated in the manufacturing plants that produce 3D-printed metal products to be used in several applications in aerospace & defense, medical & dental, and automotive end-use industries.
Stakeholders
- 3D Printing Metal Manufacturers
- 3D Printing Metal Distributors and Suppliers
- Universities, Governments, and Research Organizations
- Associations and Industrial Bodies
- R&D Institutes
- Environmental Support Agencies
- Investment Banks and Private Equity Firms
- Research and Consulting Firms
Report Objectives
- To define, describe, and forecast the 3D printing metals market size in terms of volume and value
- To provide detailed information regarding the key factors, such as drivers, restraints, opportunities, and challenges influencing market growth
- To analyze and project the global 3D printing metals market by metal type, technology, form, end-use industry, and region
- To forecast the market size concerning five main regions (along with country-level data), namely, North America, Europe, Asia Pacific, the Middle East & Africa, and South America, and analyze the significant region-specific trends
- To strategically analyze micromarkets with respect to individual growth trends, prospects, and contributions of the submarkets to the overall market
- To analyze the market opportunities and the competitive landscape for stakeholders and market leaders
- To assess recent market developments and competitive strategies, such as agreements, contracts, acquisitions, and product developments/product launches, to draw the competitive landscape
- To strategically profile the key market players and comprehensively analyze their core competencies
Key Questions Addressed by the Report
Who are the major companies in the 3D printing metals market? What key strategies have market players adopted to strengthen their market presence?
Major companies include 3D Systems, Inc. (US), Renishaw plc (UK), Stratasys Ltd. (US), General Electric Company (US), Carpenter Technology Corporation (US), Materialise (Belgium), Sandvik AB (Sweden), EOS GmbH (Germany), Nano Dimension (US), Nikon SLM Solutions AG (Germany), Proto Labs (US), Titomic (Australia), Höganäs AB (Sweden), Forward AM Technologies GmbH (Germany), and Pollen AM Inc. (France). Key strategies adopted by these companies include product launches, acquisitions, and expansions.
What are the drivers and opportunities for the 3D printing metals market?
The market is driven by increasing demand from the aerospace & defense industry and technological advancements in manufacturing technology.
Which region is expected to hold the largest market share?
Europe is projected to hold the largest market share due to its strong industrial base and the presence of major aerospace & automotive players.
What is the projected growth rate of the 3D printing metals market over the next five years?
The market is projected to register a CAGR of 25.0% over the next five years in terms of value.
How is the 3D printing metals market aligned for future growth?
The market is well-positioned for future growth due to rising demand from aerospace, defense, and automotive sectors, along with ongoing technological advancements in 3D printing metals manufacturing.
Need a Tailored Report?
Customize this report to your needs
Get 10% FREE Customization
Customize This ReportPersonalize This Research
- Triangulate with your Own Data
- Get Data as per your Format and Definition
- Gain a Deeper Dive on a Specific Application, Geography, Customer or Competitor
- Any level of Personalization
Let Us Help You
- What are the Known and Unknown Adjacencies Impacting the 3D Printing Metals Market
- What will your New Revenue Sources be?
- Who will be your Top Customer; what will make them switch?
- Defend your Market Share or Win Competitors
- Get a Scorecard for Target Partners

Custom Market Research Services
We Will Customise The Research For You, In Case The Report Listed Above Does Not Meet With Your Requirements
Get 10% Free CustomisationTESTIMONIALS

We at Nissan Chemicals Corporation have been clients of MarketsandMarkets for more than a year now. We recently consulted MarketsandMarkets for a study, the team at MarketsandMarkets was extremely professional and organized. The business insights were very detailed and aligned well with our expectations that really helped us formulate the Business Plans and device new strategies for development themes. MarketsandMarkets offers a unique combination of expertise and dedicated engagement model. Their research findings have helped us in designing our Pricing Strategy which will make it easier for us to predict the future sales and profits for the next ten years. We look forward to working with MarketsandMarkets in the future.
VP of Strategy & New Business Development
Leading Specialty Chemical Company
The MarketsandMarkets Engagement Model, composed of both the Knowledge Store and advisory custom research, has greatly helped us in understanding our markets and making strategic decisions. The Knowledge Store is a fast way to allow everyone in our organization to understand more about most any market they are interested in. The ability to then get custom research done and get answers to specific strategic questions and market insight has been spectacular. The Markets and Markets team feel more like colleagues than vendors and their services have helped us change our culture where statements of things like growth opportunities and competitive position are always backed by industry research.

Rich Gibson,
Director, Corporate Strategy
Milliken & Company,
Leading Industrial Manufacturer of specialty chemical, floor covering, performance and protective textile materials, and healthcaremilliken.com
MarketsandMarkets is a trusted resource that helps us to better understand markets that are near-adjacencies-whether its technology, value chain or geography. Their Knowledge Store platform provides a dashboard of markets and their characteristics which is easy to use and saves us time.
Adam Shaw,
Market Development and Strategy Manager
AdvanSix Inc. USA,
An American Leader in Chemicalswww.advansix.com
The Knowledge Store from MarketsandMarkets is a valuable tool which has helped my team acquire greater insight in to the end markets that our business serves. This has enabled us to help our company build stronger strategies throughout our planning process.
TOSHIO KINOSHITA
Senior Chif Consultion Research & Consulting Division
Mitsubishi Chemical Research Corporation,
Leading Manufacturer of Chemical Productswww.mitsubishichem-res.co.jp/en/

We recently engaged with MarketsandMarkets for a study, the team not only clearly understood our business objectives but was also extremely professional in the way they handled the entire project. The study was efficiently conducted in a phase-wise manner, and the engagement model furnished us with high-quality business insights that far exceeded our expectations at each phase. We were especially happy that MarketsandMarkets could provide us with both, an English as well as a Japanese version of the study. A special thanks to the Analyst Team and Client Services Team, whose fluency in Japanese enhanced our comfort level, as we could converse with them in our preferred language.
Independent entrepreneurs
Arrow Precision
We approached MarketsandMarkets for study on Proppants Market, and their work exceeded our expectations. The study conducted was comprehensive and enabled us to view the market through the various dimensions. In addition, the team was extraordinarily responsive throughout the process and resolved our queries on time. I strongly recommend MarketsandMarkets and will certainly consider them for additional market assessments we will need in the future.
Global engineering company, Japan
Deputy Manager,
Strategic Planning OfficeThe high-quality insights shared by the MarketsandMarkets team helped us understand the pharmaceutical plant designers in a specific geography. It also captured the risks that we may likely face in communicating with our potential partners. The study would enable us identify partners, which would impact our future growth.
Growth opportunities and latent adjacency in 3D Printing Metals Market


Prashant
Nov, 2018
3D printing metal market potential in India.
Prashant
Nov, 2018
Data on business potential and target customers for 3D Printing for High alloy and Strength metals such as Nickel, Titanium, and others in India..
Prashant
Jan, 2019
Market estimation and forecast of 3D printing metal for India.
David
Apr, 2019
Interested in power bed system for 3D metal printing market in Israel and global..
praveenkumar
May, 2020
What is the market share of Direct Energy Deposition (DED) 3D printing globally?.
Anshul
Jul, 2019
Market assessment of 3D metal printing..
Yusuf
May, 2019
Specific information on metal inks for Malaysia (specific in APAC), Europe and North America market .
sergei
Apr, 2016
Interested in aerospace and high technology applications of the material.