
3D Printing Filament Market

3D Printing Filament Market by Type (Plastics, Metals, Ceramics, Others), End-use Industry (Aerospace & Defense, Medical & Dental, Automotive, Consumer Goods, Others), and Region - Global Forecast to 2030
Updated on : December 11, 2025


3D PRINTING FILAMENT MARKET
Source: Secondary Research, Interviews with Experts, MarketsandMarkets Analysis
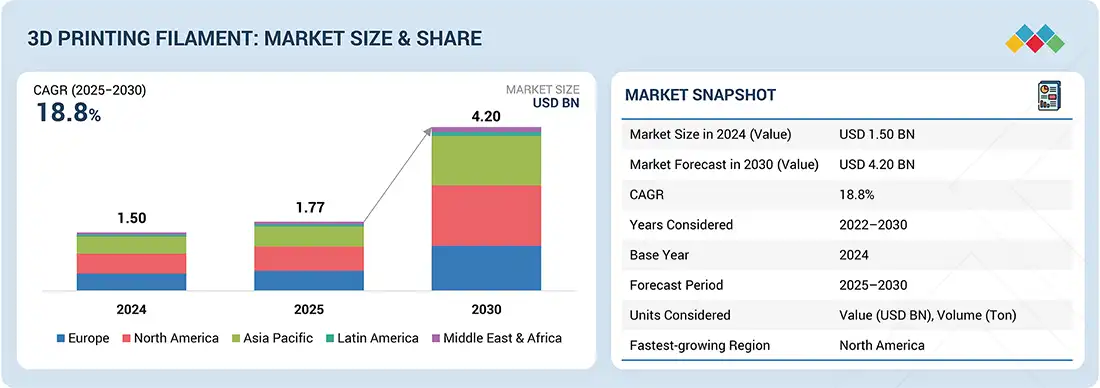
The global 3D printing filament market was valued at USD 1.77 billion in 2025 and is projected to reach USD 4.20 billion by 2030, growing at 18.8% cagr from 2025 to 2030. The market is expected to grow significantly as the industries that use 3D printing are becoming larger by incorporating filaments in a broad number of industries in areas, such as automotive, aerospace, medical, and consumer products. This expansion is being fueled by the benefits that 3D printing offers, which includes flexibility in design, fast prototyping, and cost effective low-volume manufacturing.
KEY TAKEAWAYS
-
BY TYPEThe 3D printing filament market consists of plastics, metals, ceramics, and other types, with plastics like PLA and ABS remaining most widely used for their versatility and convenience. While metal and ceramic filaments serve specialty uses in aerospace, automotive, medical & dental sectors.
-
BY END-USE INDUSTRY3D printing filaments are increasingly adopted in the aerospace & defense, medical & dental, automotive, and consumer goods sectors to enable lightweight, customizable, and high-performance components.
-
BY REGIONNorth America is expected to grow at the fastest CAGR of 20.1%, due to presence of well-established 3D printing filament manufacturers and early adoption of additive manufacturing technologies.
-
COMPETITIVE LANDSCAPEThe market is driven by strategic collaborations, capacity expansions, and technological innovations from leading players such as Stratasys, Arkema, and Evonik Industries AG. These companies are focusing on developing advanced polymer formulations, composite filaments, and bio-based materials, while also expanding application areas in a wide range of industries.
The 3D printing filament market is positioned for significant growth, driven by the rising adoption of additive manufacturing across industries and continuous material innovations. Companies are increasingly utilizing 3D printing filaments for their versatility, design flexibility, and cost-effective prototyping and production capabilities. The combination of strength, lightweight properties, and material diversity makes it valuable in aerospace & defense, automotive, medical & dental, consumer goods, and industrial applications.
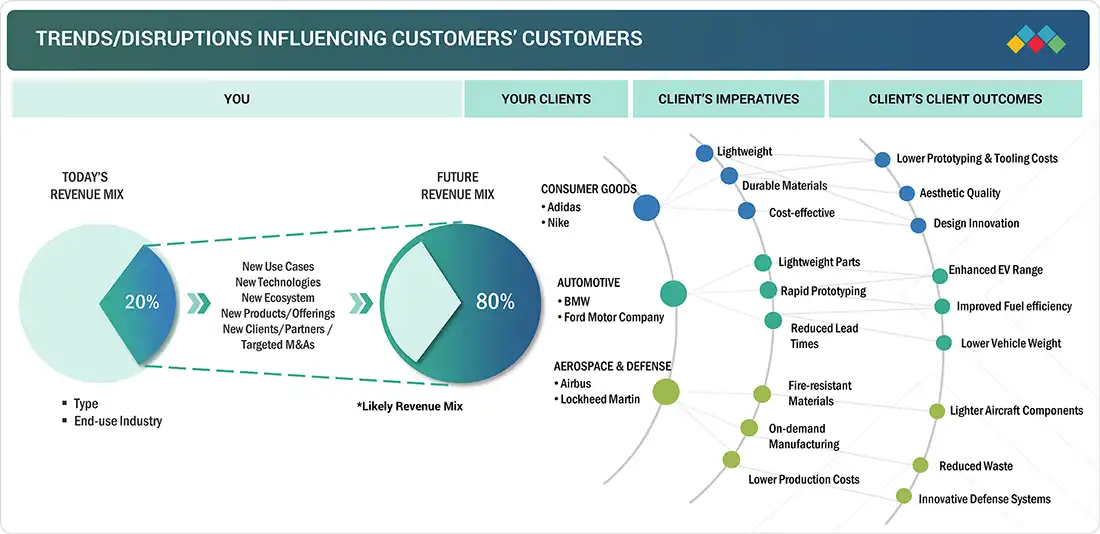
TRENDS & DISRUPTIONS IMPACTING CUSTOMERS' CUSTOMERS
Changes in customer trends or disruptions impact consumers' businesses. These shifts impact the revenues of end users. Consequently, the revenue impact on end users is expected to affect the revenues of 3D printing filament suppliers, which, in turn, impacts the revenues of 3D printing filament manufacturers.
Source: Secondary Research, Interviews with Experts, MarketsandMarkets Analysis
3D PRINTING FILAMENT MARKET DYNAMICS
Level
-
Increasing demand for 3D printing filaments from aerospace & defense industry

-
Government initiatives to surge adoption of 3D printing

Level
-
Environmental concerns regarding disposal of plastic products

-
Lack of standardization and regulatory challenges

Level
-
Surge in demand for biodegradable and recycled filament options

-
Expansion into emerging markets with supportive government initiatives

Level
-
Compatibility issues across 3D printers

-
High cost of advanced filaments

Source: Secondary Research, Interviews with Experts, MarketsandMarkets Analysis
Driver: Development of new materials for FDM technology
The growth of new materials in fused deposition modeling (FDM) is driving the 3D printing filament market, expanding beyond basic PLA and ABS to advanced options like PEEK, ULTEM, carbon fiber composites, metals, and ceramics. These high-performance and biodegradable filaments are enabling functional end-use parts across aerospace, automotive, medical, and consumer goods, while improved compatibility with FDM printers is lowering costs and accelerating industry adoption.
Restraint: Lack of standardization and regulatory challenges
The absence of standardized regulations and certifications, especially in highly regulated industries, such as aerospace & defense, medical & dental, and automotive, poses a major restraint for 3D printing filaments. Variations in raw materials, production methods, and supplier specifications create inconsistent outcomes, while heavy validation requirements from bodies such as the FDA and aviation authorities increase costs and slow adoption. Until uniform certifications and testing protocols are established, the market’s expansion in high-value, safety-critical applications will remain limited.
Opportunity: Expansion into emerging markets with supportive government initiatives
Rising demand for biodegradable filaments like PLA and recycled plastics, such as PETG, are reflecting greater environmental awareness and circular economy goals. Startups and established players are investing in sustainable alternatives that reduce reliance on fossil fuels, supported by government policies and consumer pressure. This creates high potential for bio-based and recycled filaments, particularly in education, prototyping, and consumer products where sustainability is prioritized over extreme performance.
Challenge: Compatibility issues across 3D printers
A major challenge in the 3D printing filament market is the lack of universal compatibility, as different materials require specific temperatures, extrusion conditions, and printer setups. High-performance filaments like PEEK or carbon fiber composites demand specialized equipment, while standard printers can only process low-temperature plastics such as PLA or PETG. Additionally, variations in filament diameters further restrict flexibility, driving up costs and limiting widespread adoption, especially for small businesses
3D Printing Filament Market: COMMERCIAL USE CASES ACROSS INDUSTRIES
| COMPANY | USE CASE DESCRIPTION | BENEFITS |
|---|---|---|
 |
Uses carbon fiber-reinforced filaments and ABS for prototyping, jigs, and lightweight auto parts | Faster prototyping, 90%-time reduction in tool production, and lightweighting for fuel efficiency |
 |
Employs high-performance PEEK and ULTEM filaments for aircraft interior components and tooling | High strength-to-weight ratio, reduced part count, and compliance with aerospace standards |
 |
Uses medical-grade PLA/PETG for surgical guides, dental models, and patient-specific devices | Customized medical solutions, reduced lead times, and lower production costs |
 |
Produces customized footwear midsoles and design prototypes using flexible TPU filaments | Mass customization, improved performance design, and consumer personalization |
Logos and trademarks shown above are the property of their respective owners. Their use here is for informational and illustrative purposes only.
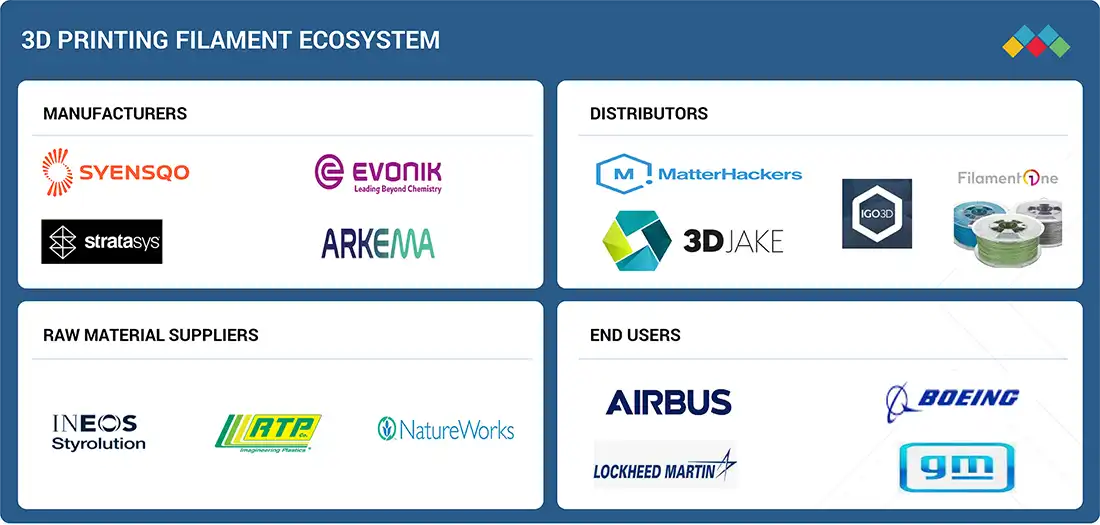
3D PRINTING FILAMENT MARKET ECOSYSTEM
The 3D printing filament ecosystem analysis involves identifying and analyzing interconnected relationships among various stakeholders, including raw material suppliers, manufacturers, distributors, and end users. The raw material suppliers provide plastics, metals, and ceramics to 3D printing filament manufacturers. The distributors and suppliers establish contact between the manufacturing companies and end users to streamline the supply chain, increasing operational efficiency and profitability.
Logos and trademarks shown above are the property of their respective owners. Their use here is for informational and illustrative purposes only.
MARKET SEGMENTS
Source: Secondary Research, Interviews with Experts, MarketsandMarkets Analysis
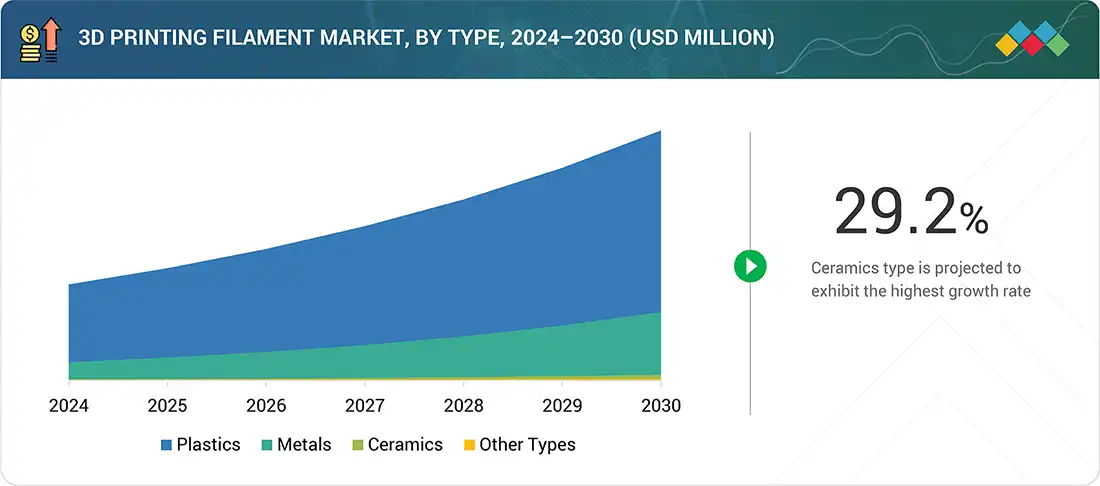
3D Printing Filament Market, by Type
The plastics type accounted for the largest market share in 2024 as they are versatile, cost-effective, and easy to process compared to metals or ceramics. Materials like PLA, ABS, and PA offer a wide range of mechanical properties, colors, and finishes, making them suitable for prototyping, consumer products, and functional parts. PLA is often chosen by educational institutions and hobbyists for its biodegradable qualities and lower printing temperatures, while ABS and PA are frequently used in automotive applications and functional prototypes due to their durability and heat resistance.
3D Printing Filament Market, by End-use Industry
In 2024, the aerospace & defense industry accounted for the largest share due to its demand for lightweight, high-strength, and heat-resistant materials that improve fuel efficiency and performance. 3D printing allows for the production of complex, customized components with reduced material waste and shorter lead times, which is critical for aircraft and defense applications. The industry's focus on innovation and rapid prototyping further drives the adoption of advanced filaments.
REGION
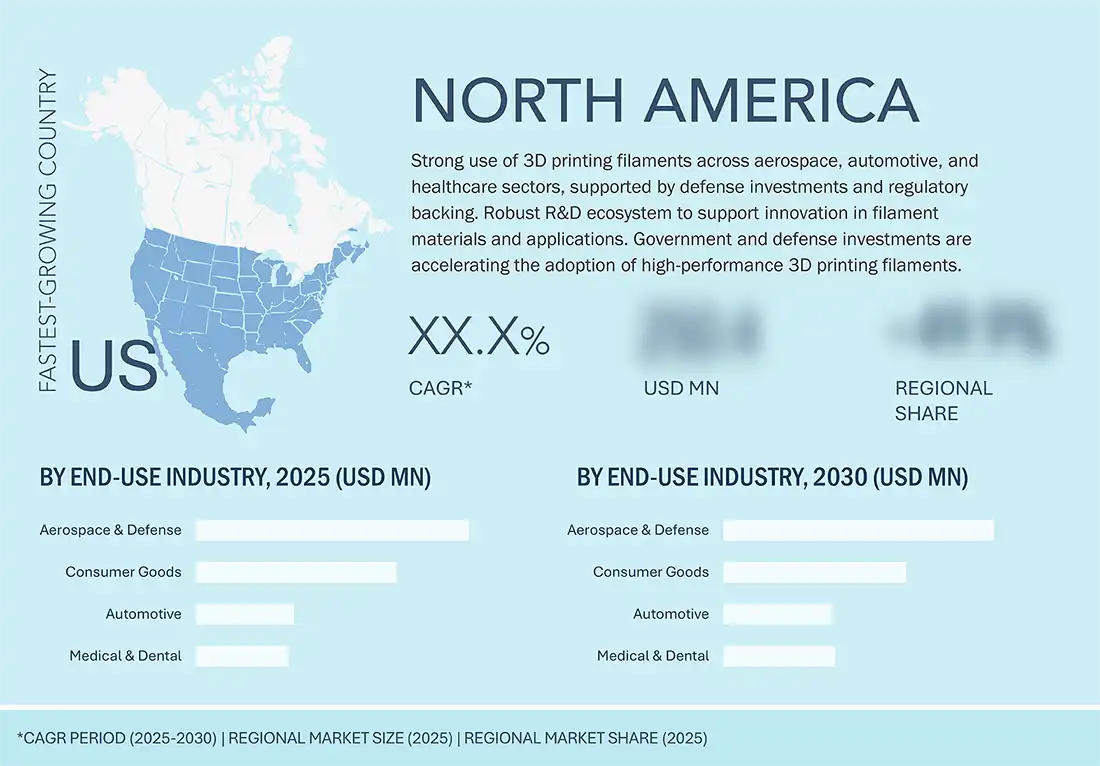
North America to be fastest-growing region in the 3D printing filament market during forecast period
The 3D printing filament market in North America is expected to register the highest CAGR during the forecast period, due to the rapid adoption of 3D printing across industries such as aerospace & defense, automotive, and medical & dental. The presence of advanced manufacturing technologies and strong R&D infrastructure supports innovation in filament materials. Increasing demand for customized and on-demand production is driving growth, alongside rising investments from both government and private sectors.
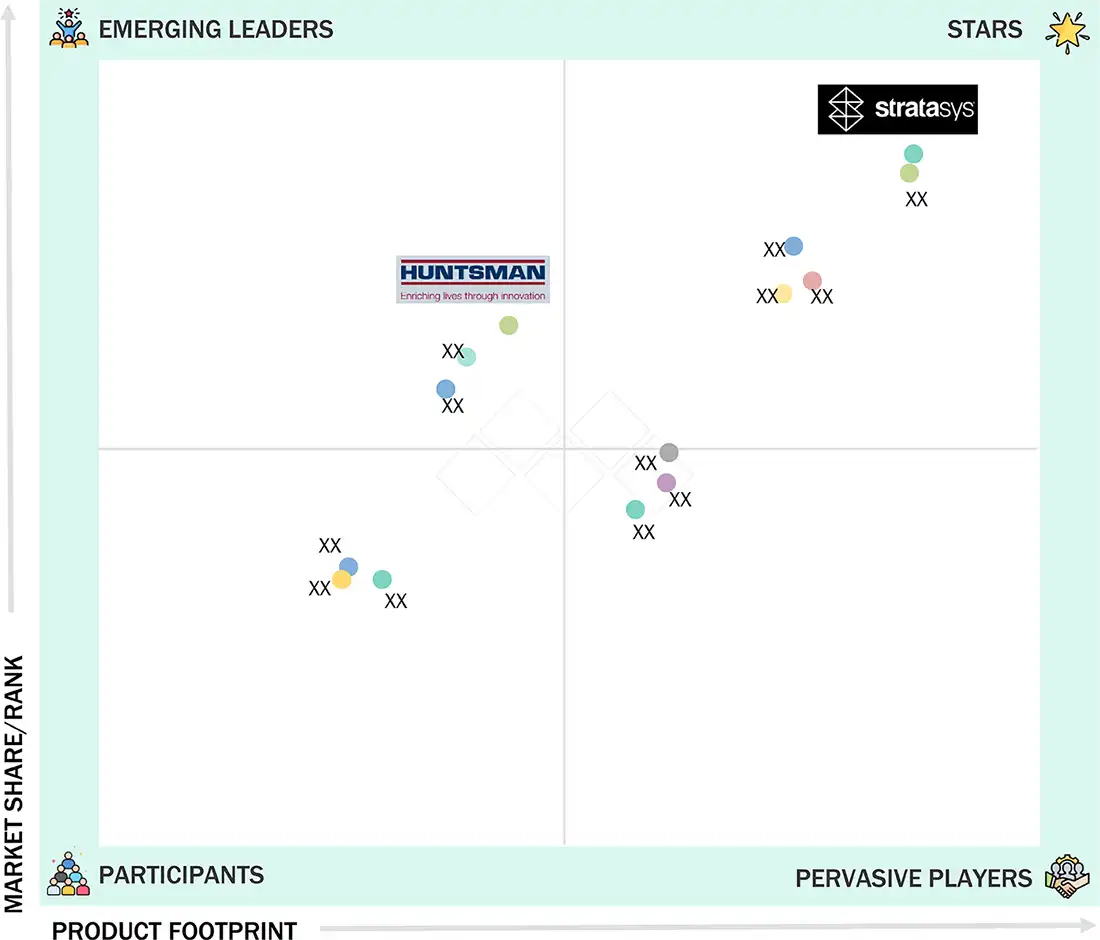
3D Printing Filament Market: COMPANY EVALUATION MATRIX
In the 3D printing filament market matrix, Stratasys (Star), a leading 3D printing and additive manufacturing company known for its innovative solutions in prototyping, production, and industrial applications. Huntsman International LLC (Emerging Leader) is gaining traction for its high-performance polymer materials, including specialty 3D printing filaments used for industrial and engineering applications showing strong growth potential to advance toward the leaders’ quadrant.
Source: Secondary Research, Interviews with Experts, MarketsandMarkets Analysis
KEY MARKET PLAYERS
MARKET SCOPE
| REPORT METRIC | DETAILS |
|---|---|
| Market Size in 2024 (Value) | USD 1.50 Billion |
| Market Forecast in 2030 (Value) | USD 4.20 Billion |
| Growth Rate | CAGR of 18.8% from 2025-2030 |
| Years Considered | 2022-2030 |
| Base Year | 2024 |
| Forecast Period | 2025-2030 |
| Units Considered | Value (USD Billion), Volume (Kiloton) |
| Report Coverage | Revenue forecast, company ranking, competitive landscape, growth factors, and trends |
| Segments Covered |
|
| Regions Covered | North America, Asia Pacific, Europe, Latin America, and Middle East & Africa |
WHAT IS IN IT FOR YOU: 3D Printing Filament Market REPORT CONTENT GUIDE
DELIVERED CUSTOMIZATIONS
We have successfully delivered the following deep-dive customizations:
| CLIENT REQUEST | CUSTOMIZATION DELIVERED | VALUE ADDS |
|---|---|---|
| North America - 3D Printing Filament Manufacturers |
|
|
| Research & Development - 3D Printing Filament |
|
|
| Automotive 3D Printing Filament Customer |
|
|
RECENT DEVELOPMENTS
- May 2025 : Stratasys acquired former the BASF Additive Manufacturing business, Forward AM. Forward AM's business will now function as a standalone company within Stratasys, named Mass Additive Manufacturing GmbH.
- February 2025 : Stratasys Direct’s Tucson, Arizona facility achieved ISO 13485 certification, a quality management standard essential for medical device manufacturing. This certification ensures regulatory compliance, enabling medical device manufacturers to reliably scale the production of complex, patient-specific components.
- October 2024 : FluorX, a high-performance PVDF filament co-developed by Arkema and 3DXTECH, was integrated into Ultimaker’s Cura Marketplace, making it easier for users to access verified material print profiles for optimized FDM printing.
- June 2024 : Arkema granted SEQENS an exclusive license to produce PEKK (under the Kepstan trademark) specifically for long-term medical implantable applications. This builds on a 15-year collaboration, enabling SEQENS to market “IMPEKK” materials potential alternatives to titanium and PEEK via its global distributor and manufacturing network.
- May 2024 : Evonik entered into a non-exclusive distribution agreement, appointing ProductionToGo to distribute its INFINAM photopolymers and PEEK-based filaments across the EU, Switzerland, Norway, and the UK. This expands Evonik’s reach into Europe's high-performance 3D printing materials market via ProductionToGo’s well-established supply chain and customer support.
Table of Contents
 Exclusive indicates content/data unique to MarketsandMarkets and not available with any competitors.
Methodology
The study involves two major activities in estimating the current market size for the 3D printing filament market. Exhaustive secondary research was done to collect information on the market, peer market, and parent market. The next step was to validate these findings, assumptions, and sizing with industry experts across the value chain through primary research. Both top-down and bottom-up approaches were employed to estimate the complete market size. After that, market breakdown and data triangulation were used to estimate the market size of segments and subsegments.
Secondary Research
Secondary sources referred to for this research study include financial statements of companies offering 3D printing filament products and information from various trade, business, and professional associations. Secondary research has been used to obtain critical information about the industry’s value chain, the pool of key players, market classification, and segmentation according to industry trends to the bottom-most level and regional markets. Secondary data was collected and analyzed to arrive at the overall size of the 3D printing filament market, which was validated by primary respondents.
Primary Research
Extensive primary research was conducted after obtaining information regarding the 3D printing filament market scenario through secondary research. Several interviews with experts were conducted with market experts from both the demand and supply sides across the major countries of Asia Pacific, Europe, North America, the Middle East & Africa, and South America. Primary data was collected through questionnaires, emails, and telephonic interviews. The primary sources from the supply side included various industry experts, such as Chief X Officers (CXOs), Vice Presidents (VPs), Directors from business development, marketing, product development/innovation teams, and related key executives from 3D printing filament industry vendors, system integrators, component providers, distributors, and key opinion leaders. Interviews with experts were conducted to gather insights, such as market statistics, data on revenue collected from the products and services, market breakdowns, market size estimations, market forecasting, and data triangulation. Primary research also helped in understanding the various trends related to type, operating temperature, manufacturing process, end-use industries, and region. Stakeholders from the demand side, such as CIOs, CTOs, CSOs, and installation teams of the customers/end users who are using 3D printing filament products were interviewed to understand the buyers’ perspectives on the suppliers, products, component providers, their current usage of 3D printing filaments, and outlook of their business which will affect the overall market.
Breakdown of Interviews with Experts

To know about the assumptions considered for the study, download the pdf brochure
Market Size Estimation
The research methodology used to estimate the size of the 3D printing filament market includes the following details: The market sizing was undertaken from the demand side. The market was upsized based on procurements and modernization in 3D printing filament products in different end-use industries at a regional level. Such procurements provide information on the demand aspects of the 3D printing filament industry for each end-use industry. For each end-use industry, all possible segments of the 3D printing filament market were integrated and mapped.

Data Triangulation
After arriving at the overall size from the market size estimation process explained above, the total market was split into several segments and subsegments. The data triangulation and market breakdown procedures explained below were implemented, wherever applicable, to complete the overall market engineering process and arrive at the exact statistics for various market segments and subsegments. The data was triangulated by studying various factors and trends from the demand and supply sides. Along with this, the market size was validated using both the top-down and bottom-up approaches.
Market Definition
3D printing filament serves as the feedstock material utilized in Fused Deposition Modeling (FDM), which is among the most commonly used 3D printing techniques. It is presented in the form of a lengthy, continuous strand that is coiled on a spool and heated to be extruded layer by layer, creating three-dimensional objects. These filaments come in various types of materials, each suited to different industrial and creative applications. The market study includes plastics (such as PLA, ABS, PETG, Nylon, and PEEK), widely employed for prototyping, functional components, and consumer items due to their adaptability and user-friendliness. Metal-filled filaments include (like stainless steel or titanium) Ceramic-based filaments that integrate materials, such as zirconia and alumina, are used in applications requiring high temperature, insulation, or resistance to abrasion. This variety of filament types enables sectors, such as aerospace & defense, automotive, medical & dental, and consumer goods to leverage 3D printing for a broad spectrum of production, prototyping, and design needs.
Stakeholders
- 3D Printing Filament Manufacturers
- 3D Printing Filament Suppliers
- Raw Material Suppliers
- End-use Industries
- Government Bodies
- Universities, Governments, and Research Organizations
- Research and Consulting Firms
- R&D Institutions
- Investment Banks and Private Equity Firms
- Magnet and 3D Printing Filament Associations
Report Objectives
- To define, describe, and forecast the 3D printing filament market size in terms of volume and value
- To provide detailed information regarding key factors, such as drivers, restraints, opportunities, and challenges influencing market growth
- To analyze and project the global 3D printing filament market by type, operating temperature, manufacturing process, end-use industry, and region
- To forecast the market size concerning five main regions (along with country-level data), namely, Asia Pacific, Europe, North America, the Middle East & Africa, and South America, and analyze the significant region-specific trends
- To strategically analyze micromarkets with respect to individual growth trends, prospects, and contributions of the submarkets to the overall market
- To analyze the market opportunities and the competitive landscape for stakeholders and market leaders
- To assess recent market developments and competitive strategies, such as acquisitions, agreements, contracts, and product developments/launches, to draw the competitive landscape
- To strategically profile key market players and comprehensively analyze their core competencies
Key Questions Addressed by the Report
Which are the major companies in the 3D printing filament market?
Key players in the 3D printing filament market include Arkema (France), Stratasys (US), Evonik Industries AG (Germany), Syensqo (Belgium), and Shenzhen Esun Industrial Co., Ltd. (China), among others.
What are the drivers and opportunities for the 3D printing filament market?
The development of new materials for FDM technology is a major driver for the market. Additionally, there are significant opportunities due to the growing demand for biodegradable and recycled filament options.
Which region is expected to hold the largest market share?
North America is expected to hold the largest market share, driven by substantial industry demand in terms of value.
What is the CAGR expected to be recorded for the 3D printing filament market during the forecast period?
The 3D printing filament market is projected to grow at a compound annual growth rate (CAGR) of 18.8% between 2025 and 2030.
How is the 3D printing filament market aligned?
The market is considered stable due to high demand from key end-use industries such as consumer goods, automotive, medical and dental, and aerospace and defense. It has strong growth potential and is dominated by established players like Stratasys, Evonik Industries AG, and Syensqo.
Need a Tailored Report?
Customize this report to your needs
Get 10% FREE Customization
Customize This ReportPersonalize This Research
- Triangulate with your Own Data
- Get Data as per your Format and Definition
- Gain a Deeper Dive on a Specific Application, Geography, Customer or Competitor
- Any level of Personalization
Let Us Help You
- What are the Known and Unknown Adjacencies Impacting the 3D Printing Filament Market
- What will your New Revenue Sources be?
- Who will be your Top Customer; what will make them switch?
- Defend your Market Share or Win Competitors
- Get a Scorecard for Target Partners

Custom Market Research Services
We Will Customise The Research For You, In Case The Report Listed Above Does Not Meet With Your Requirements
Get 10% Free CustomisationTESTIMONIALS

We at Nissan Chemicals Corporation have been clients of MarketsandMarkets for more than a year now. We recently consulted MarketsandMarkets for a study, the team at MarketsandMarkets was extremely professional and organized. The business insights were very detailed and aligned well with our expectations that really helped us formulate the Business Plans and device new strategies for development themes. MarketsandMarkets offers a unique combination of expertise and dedicated engagement model. Their research findings have helped us in designing our Pricing Strategy which will make it easier for us to predict the future sales and profits for the next ten years. We look forward to working with MarketsandMarkets in the future.
VP of Strategy & New Business Development
Leading Specialty Chemical Company
The MarketsandMarkets Engagement Model, composed of both the Knowledge Store and advisory custom research, has greatly helped us in understanding our markets and making strategic decisions. The Knowledge Store is a fast way to allow everyone in our organization to understand more about most any market they are interested in. The ability to then get custom research done and get answers to specific strategic questions and market insight has been spectacular. The Markets and Markets team feel more like colleagues than vendors and their services have helped us change our culture where statements of things like growth opportunities and competitive position are always backed by industry research.

Rich Gibson,
Director, Corporate Strategy
Milliken & Company,
Leading Industrial Manufacturer of specialty chemical, floor covering, performance and protective textile materials, and healthcaremilliken.com
MarketsandMarkets is a trusted resource that helps us to better understand markets that are near-adjacencies-whether its technology, value chain or geography. Their Knowledge Store platform provides a dashboard of markets and their characteristics which is easy to use and saves us time.
Adam Shaw,
Market Development and Strategy Manager
AdvanSix Inc. USA,
An American Leader in Chemicalswww.advansix.com
The Knowledge Store from MarketsandMarkets is a valuable tool which has helped my team acquire greater insight in to the end markets that our business serves. This has enabled us to help our company build stronger strategies throughout our planning process.
TOSHIO KINOSHITA
Senior Chif Consultion Research & Consulting Division
Mitsubishi Chemical Research Corporation,
Leading Manufacturer of Chemical Productswww.mitsubishichem-res.co.jp/en/

We recently engaged with MarketsandMarkets for a study, the team not only clearly understood our business objectives but was also extremely professional in the way they handled the entire project. The study was efficiently conducted in a phase-wise manner, and the engagement model furnished us with high-quality business insights that far exceeded our expectations at each phase. We were especially happy that MarketsandMarkets could provide us with both, an English as well as a Japanese version of the study. A special thanks to the Analyst Team and Client Services Team, whose fluency in Japanese enhanced our comfort level, as we could converse with them in our preferred language.
Independent entrepreneurs
Arrow Precision
We approached MarketsandMarkets for study on Proppants Market, and their work exceeded our expectations. The study conducted was comprehensive and enabled us to view the market through the various dimensions. In addition, the team was extraordinarily responsive throughout the process and resolved our queries on time. I strongly recommend MarketsandMarkets and will certainly consider them for additional market assessments we will need in the future.
Global engineering company, Japan
Deputy Manager,
Strategic Planning OfficeThe high-quality insights shared by the MarketsandMarkets team helped us understand the pharmaceutical plant designers in a specific geography. It also captured the risks that we may likely face in communicating with our potential partners. The study would enable us identify partners, which would impact our future growth.


Growth opportunities and latent adjacency in 3D Printing Filament Market