In that respect, the research has heavily employed both primary and secondary sources in order to comprehensively study the forces influential in the industry. This methodology comprised market segmentation analysis, industry trends, major players, competitive landscape, key market dynamics, and strategies of key companies.
Secondary Research
The secondary research involves D&B Hoovers, Bloomberg Businessweek, Factiva, white papers, annual reports, company filings, investor presentations, and SEC filings for conducting secondary research in developing a database on major industry participants. Key data with regard to leading players, market segmentation, at a various level, industry trends by segments, significant mergers and acquisitions, and the impact of trends and technological perspectives related to the antimicrobial susceptibility testing market.
Primary Research
Primary research in the report included interviewing a cross-section, both from the demand and supply sides, to capture information qualitatively and quantitatively. Supply side: High-level executives' interviews, such as CEOs, VPs, marketing and sales directors, regional sales managers, and technology and innovation directors were contacted from leading companies and organizations in product therapy markets. On the demand side, research was carried out by discussing with professionals like clinicians, procurement managers, purchase managers, department heads, and experts from hospitals, diagnostic centers, pharmaceutical and biotechnological firms, and research and academic institutes. This was necessary to gain a proper view of the market segmentation, significant players in the market, and key trends and dynamics related to the growth of the market.
A breakdown of the primary respondents is provided below:
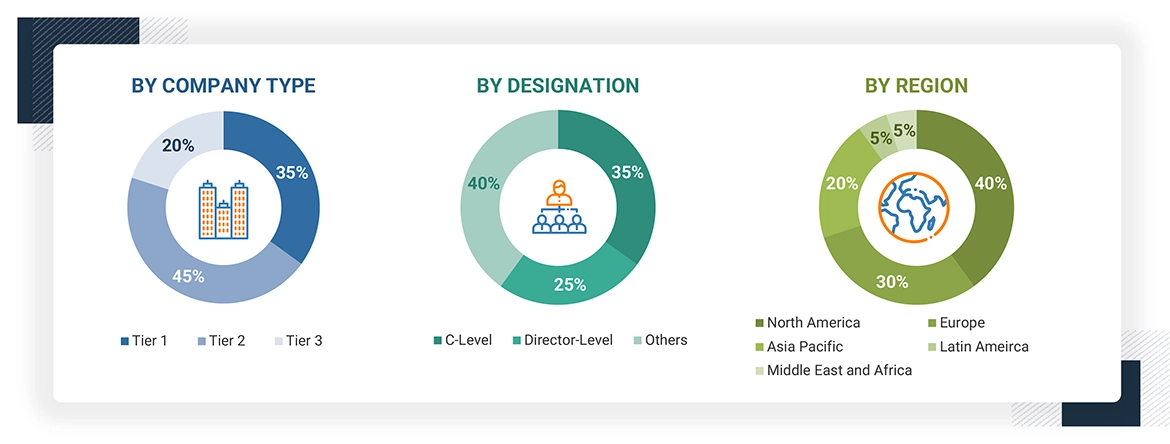
*Others include sales managers, marketing managers, business development managers, product managers, distributors, and suppliers.
Note: Companies are classified into tiers based on their total revenue. As of 2023, Tier 1 = >USD 1 billion, Tier 2 = < USD 500 million, and Tier 3 = < USD 100 million.
To know about the assumptions considered for the study, download the pdf brochure
Market Size Estimation
This research examines the Antimicrobial Susceptibility testing market and revenue share among the market leaders. It made use of a combination of primary and secondary research methods to do so. Primary research involved in-depth interviews with CEOs, directors, and senior marketing executives. Secondary research formed annual and financial reports by major industry players. The market value was determined while following a segment-based strategy, and it used revenue details of leading solution providers for differentiating between sources and services.
Covered segments:
Identify the major companies involved in the world Antimicrobial Susceptibility testing market and document their annual revenues or revenues from their particular product category/business division.
The revenue mapping of these leading competitors, based on 2024 data, captures a good share of the market and is thus extrapolated to estimate the total global value of the Antimicrobial Susceptibility testing market:
Data Triangulation
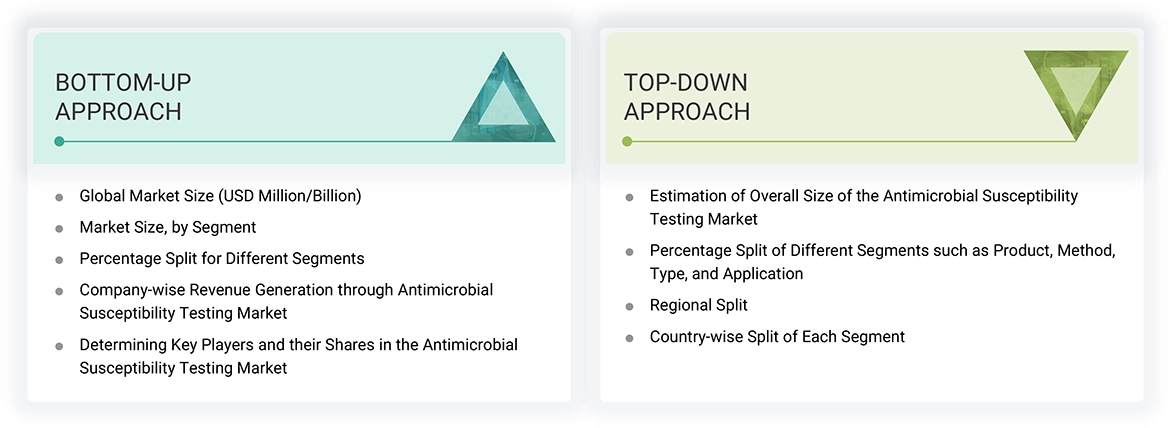
Based on the methodology, categorical and sub-categories segmentation of the global antimicrobial susceptibility testing market was performed. Further, data triangulation and the segmentation process were undertaken to arrive at an accurate data of different segments for the market. Various analyses involved factors and trends of the demand and supply sides. The integration of detailed top-down and bottom-up approaches offered a holistic overview of the antimicrobial susceptibility testing market
Market Definition
The Antimicrobial Susceptibility Testing market involves the diagnosis and determination of effectiveness against pathogens such as bacteria, fungi, and viruses using antimicrobial agents. It consists of several technologies and methodologies employed for the diagnosis of the susceptibility of microorganisms to a variety of antimicrobial agents through automated systems, molecular diagnostics, and traditional culture-based methods. The main aim of AST is to be able to choose appropriate therapy, enhance patient outcomes, and take against the threat of emerging antimicrobial resistance. The market includes products and services used by clinical laboratories, hospitals, research institutions, and other healthcare facilities.
Stakeholders
-
Healthcare institutions (hospitals and clinics)
-
Healthcare institutions (hospitals and diagnostic centers)
-
Research institutions
-
Clinical research organizations
-
Academic medical centers and universities
-
Reference laboratories
-
Accountable Care Organizations (ACOs)
-
Research and consulting firms
-
Contract research organizations (CROs) and contract manufacturing organizations (CMOs)
-
Academic medical centers and universities
-
Market research and consulting firms
-
Group Purchasing Organizations (GPOs)
-
Medical Research Laboratories
-
Academic Medical Centers and Universities
Report Objectives
-
Define, describe, and project the antimicrobial susceptibility testing (AST) market across various dimensions, including product, type, methods, applications, end users, and regional areas.
-
Explore opportunities for stakeholders and provide a detailed analysis of the competitive landscape, highlighting the key players in the market.
-
Offer comprehensive insights into the principal factors influencing market growth.
-
Analyze micro markets by evaluating individual growth trends, potential, and their contributions to the overall market.
-
Monitor and review competitive developments such as new product launches, approvals, agreements, partnerships, expansions, acquisitions, and collaborations in the AST sector.


 HIGHEST CAGR MARKET IN 2023
 CHINA FASTEST GROWING MARKET IN THE REGION


Growth opportunities and latent adjacency in Antimicrobial Susceptibility Testing Market