Augmented and Virtual Reality (AR VR) Market in Aviation by Technology (AR, VR), Function (Training, Operations), Component (Hardware, Software), Application (On-Board, Off-Board), Product, Vertical, and Region - Global Forecast to 2025


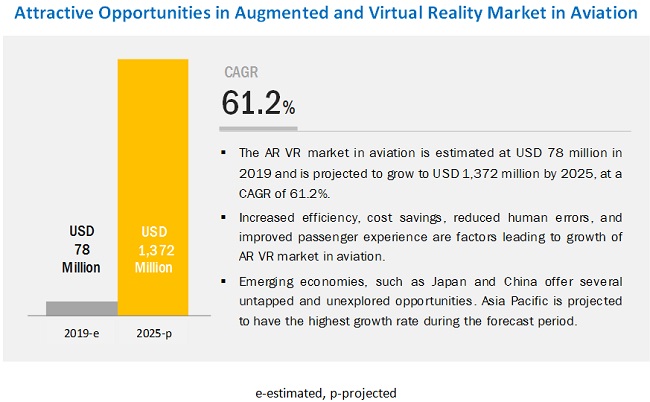
[161 Pages Report] The augmented and virtual reality market in aviation is projected to grow from USD 78 million in 2019 to USD 1,372 million by 2025, at a CAGR of 61.2% during the forecast period. The increased efficiency and cost savings are major factors driving the growth of the augmented and virtual reality industry in aviation. Improved passenger experience and reduced chances of human error also contribute to the market�s growth.
By vertical, the civil aviation segment is expected to be a larger contributor to the augmented and virtual reality market in aviation during the forecast period.
Civil aviation has been witnessing strong growth over the past few years. One of the major factors driving this growth is the increased demand for aircraft. The growing aircraft fleet must go through regular and mandatory maintenance services. This demand is expected to drive the market for AR VR technology to be integrated for MRO and maintenance of civil aviation aircraft. Along with manufacturing and MRO, the pilots, crew, ground staff, and mechanics handling civil aviation operations will need training based on AR VR technology, which is also expected to be one of the reasons for civil aviation to lead the market during the forecast period.
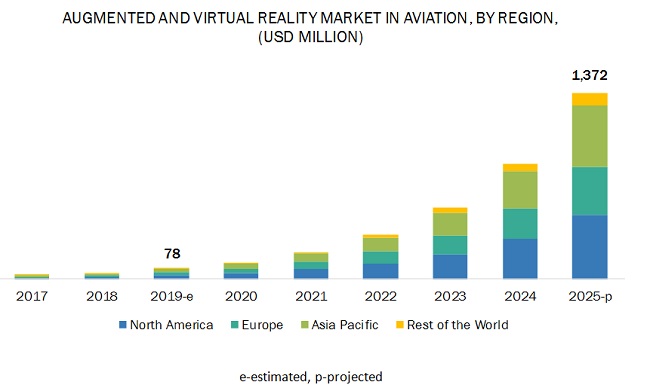
North America is projected to lead the augmented and virtual reality market in aviation during the forecast period.
North America is expected to be the largest market for AR VR market in aviation during the forecast period. The presence of major AR VR players in the US has resulted in major collaborations and partnerships between aviation companies and AR VR players in North America. North America has the highest aircraft fleet and airports globally, thus driving the demand for integration of AR VR technology. Along with this presence of various airlines, major aircraft OEMs � Boeing, Lockheed Martin, and Pratt & Whitney, among others is expected to drive the market in this region.
Key Market Players
Some of the major players in the augmented and virtual reality market in aviation include Microsoft Corporation (US), Google Inc. (US), Eon Reality (US), Aero Glass (US), Upskill (US), Oculus VR (US), Jasoren (US), IMB (US), Fountx (Australia), and Sony (Japan), among others. These players provide AR VR hardware and software to various aviation companies.
Scope of the Report
|
Report Metric |
Details |
|
Market size available for years |
2017�2025 |
|
Base year considered |
2018 |
|
Forecast period |
2019�2025 |
|
Forecast units |
Value (USD) |
|
Segments covered |
Technology, Function, Component, Application, Product, Vertical, and Region |
|
Regions covered |
North America, Europe, Asia Pacific, and Rest of the World |
|
Companies covered |
Microsoft Corporation (US), Google Inc. (US), Eon Reality (US), Aero Glass (US), Upskill (US), Oculus VR (US), Jasoren (US), IMB (US), Fountx (Australia), and Sony (Japan), among others. |
This research report categorizes the augmented and virtual reality market in aviation based on Technology, Function, Component, Application, Product, Vertical, and Region
By Type:
- Augmented Reality
- Virtual Reality
By Function:
- Training
- Pilots
- Crew & Ground Support Staff
- Engineers
- Operations
- Airlines
- MRO
- Airports
- Aircraft
- OEMs
By Component:
- Hardware
- Sensors
- Processors & Controllers
- Display
- Cameras
- Others
- Software
- Augmented Reality
- Virtual Reality
By Application:
- On-board
- In-flight Entertainment (IFE)
- Flight Deck Systems
- Off-board
By Region:
- North America
- Europe
- Asia Pacific
- Rest of the World
Key Questions Addressed by the Report
- What will be the revenue pockets for the AR VR technology in aviation in the next five years?
- Who are the leading players of AR VR in the global aviation market?
- What are the growth prospects for the augmented and virtual reality market in aviation?
- What are the major challenges faced by players in the augmented and virtual reality market in aviation?
- What are the latest technological trends in the market?
To speak to our analyst for a discussion on the above findings, click Speak to Analyst
 Exclusive indicates content/data unique to MarketsandMarkets and not available with any competitors.
Table of Contents
1 Introduction (Page No. - 19)
1.1 Objectives of the Study
1.2 Market Definition
1.3 Market Scope
1.3.1 Regional Scope
1.3.2 Years Considered
1.4 Currency & Pricing
1.5 Market Stakeholders
2 Research Methodology (Page No. - 23)
2.1 Research Data
2.1.1 Secondary Data
2.1.1.1 Secondary Sources
2.1.2 Primary Data
2.1.2.1 Key Data From Primary Sources
2.1.2.2 Breakdown of Primaries
2.1.3 Market Definition & Scope
2.1.4 Segment Definitions
2.1.4.1 AR VR Market in Aviation, By Application
2.1.4.2 AR VR Market in Aviation, By Product
2.1.4.3 AR VR Market in Aviation, By Vertical
2.1.4.4 AR VR Market in Aviation, By Technology
2.1.4.5 AR VR Market in Aviation, By Function
2.1.4.6 AR VR Market in Aviation, By Component
2.2 Research Approach and Methodology
2.2.1 Bottom-Up Approach
2.2.1.1 AR VR Market in Aviation
2.2.1.2 AR VR Market in Aviation By Training Function
2.2.1.3 AR VR Market in Aviation By Operations Function
2.2.1.4 Total AR VR Market in Aviation, By Country, Application, Vertical, and Product
2.2.2 Top-Down Approach
2.2.2.1 AR VR Market in Aviation, By Technology
2.3 Data Triangulation & Validation
2.3.1 Triangulation Through Secondary
2.3.2 Triangulation Through Primaries
2.4 Research Limitations
2.5 Research Assumptions
2.6 Risks
3 Executive Summary (Page No. - 35)
4 Premium Insights (Page No. - 38)
4.1 AR VR Market in Aviation, 2019�2025
4.2 AR VR Market in Aviation, By Function
4.3 AR VR Market in Aviation, By Technology
4.4 AR VR Market in Aviation, By Country
5 Market Overview (Page No. - 40)
5.1 Introduction
5.2 Market Dynamics
5.2.1 Drivers
5.2.1.1 Increased Demand for Higher Efficiency and Cost Saving in Aviation
5.2.1.2 Reduced Chances of Human Error
5.2.1.3 Improved Passenger Experience
5.2.2 Restraints
5.2.2.1 Privacy Concerns Regarding Personal Data
5.2.2.2 Associated Health Risks
5.2.3 Opportunities
5.2.3.1 Integration of Artificial Intelligence (AI) and Machine Learning (ML) With AR VR
5.2.4 Challenges
5.2.4.1 Technology Limitations
5.2.4.2 Cyber Security Issues
6 Industry Trends (Page No. - 45)
6.1 Introduction
6.2 Digital Reality
6.2.1 Augmented Reality (AR) Technology Trends
6.2.1.1 360-Degree View for Pilots
6.2.1.2 3D Aircraft Inspection and Maintenance
6.2.1.3 Enhanced Aviation Manufacturing
6.2.2 Virtual Reality (VR) Technology Trends
6.2.2.1 Immersive Training
6.2.2.2 Passenger Experience
6.2.3 Mixed Reality (MR) Technology Trends
6.2.3.1 Mr Approach Towards MRO
6.2.3.2 Mr in Aviation Training and Manufacturing
6.2.4 Futuristic Trend: Wearable Cockpits
6.3 Innovation & Patent Registrations
7 Augmented Reality and Virtual Reality Market in Aviation, By Technology (Page No. - 53)
7.1 Introduction
7.2 Augmented Reality
7.2.1 Marker-Based
7.2.1.1 Low Memory and Processing Capacity Requirements
7.2.1.2 Passive Markers
7.2.1.3 Active Markers
7.2.2 Non-Marker-Based
7.2.2.1 Real-Time and More Interactive Augmentation
7.2.2.2 Model-Based Tracking
7.2.2.3 Image-Based Tracking
7.3 Virtual Reality
7.3.1 Immersive
7.3.1.1 Enhanced User Experience
7.3.1.2 Semi-Immersive
7.3.1.3 Fully Immersive
7.3.2 Non-Immersive
7.3.2.1 Low-Cost Solutions and Technical Ease
8 Augmented Reality and Virtual Reality Market in Aviation, By Function (Page No. - 59)
8.1 Introduction
8.2 Training
8.2.1 Pilots
8.2.1.1 Immersive Simulator Training Essential for Pilots
8.2.2 Crew & Ground Support Staff
8.2.2.1 Well-Trained Crew & Ground Staff Ensures Smooth Functioning of Airlines
8.2.3 Engineers
8.2.3.1 Reduced Human Error Drives the Demand for AR VR Training for Engineers
8.3 Operations
8.3.1 Airlines
8.3.1.1 Need to Reduce Airline Operating Costs Drives the Demand for AR VR
8.3.2 MRO
8.3.2.1 Quick MRO Turnaround Time Drives the Use of AR VR Technology
8.3.3 Airports
8.3.3.1 Increased Need for Connected and Smart Airports Drives the Demand for AR VR Technology
8.3.4 Aircraft
8.3.4.1 Demand for VR-Based In-Flight Entertainment Drives Its Market
8.3.5 Oems
8.3.5.1 Optimizing Aviation Manufacturing and Design Made Possible With AR VR
9 Augmented Reality and Virtual Reality Market in Aviation, By Product (Page No. - 67)
9.1 Introduction
9.2 Head-Mounted Displays
9.2.1 Easy Real-Time Access to Information and Increased Field of View for Pilots
9.3 Head-Up Displays
9.3.1 Assists Pilots With Navigational Information During Take-Off and Landing
9.4 Handheld Devices
9.4.1 Improved Efficiency of Cabin Crew Training Drives the Market
9.5 Gesture-Tracking Devices
9.5.1 Used as A Medium to Interact and Navigate in the Virtual World
10 Augmented Reality and Virtual Reality Market in Aviation, By Component (Page No. - 72)
10.1 Introduction
10.2 Hardware
10.2.1 Sensors
10.2.1.1 Accurate Input of Physical Environment Helps Track A User�s Position
10.2.2 Processors & Controllers
10.2.2.1 Need for Better Computing Power Drives the Market
10.2.3 Displays
10.2.3.1 Demand for Next-Generation Miniature Displays Drives the Market
10.2.4 Cameras
10.2.4.1 Use of 3D Cameras Aids Growth of the AR VR Market
10.2.5 Others
10.3 Software
10.3.1 Augmented Reality
10.3.1.1 Widely Used in Crew Training Programs
10.3.2 Virtual Reality
10.3.2.1 Increasing Use of Simulators in Training Programs Drives the Market
11 Augmented Reality and Virtual Reality Market in Aviation, By Application (Page No. - 78)
11.1 Introduction
11.2 On-Board
11.2.1 In-Flight Entertainment
11.2.1.1 Need to Upgrade Passenger Experience is Accelerating the Use of VR Devices in Aviation
11.2.2 Flight Deck Systems
11.2.2.1 Trend of Automated Pilot Assistance to Drive the Demand for AR VR in Cockpits
11.3 Off-Board
11.3.1 Increasing Efficiency and Cost Savings are Possible Using AR VR Technology
12 Augmented Reality and Virtual Reality Market in Aviation, By Vertical (Page No. - 83)
12.1 Introduction
12.2 Civil
12.3 Military
13 Regional Analysis (Page No. - 86)
13.1 Introduction
13.2 North America
13.2.1 US
13.2.1.1 Presence of Key AR VR Players is Driving Demand in the US
13.2.2 Canada
13.2.2.1 High Projected Demand is Expected to Drive the Market
13.3 Europe
13.3.1 France
13.3.1.1 Partnerships Between Aircraft Oems and AR VR Players Driving the Market
13.3.2 UK
13.3.2.1 High Passenger Traffic Driving the Need for Operational Efficiency Via AR VR Technology at Airports
13.3.3 Germany
13.3.3.1 Partnerships Between Airlines and AR VR Players Driving the Market
13.3.4 Rest of Europe
13.3.4.1 Military Fighter Procurement and Presence of Major Airports Driving the Demand for AR VR Technology
13.4 Asia Pacific
13.4.1 China
13.4.1.1 Large Aircraft Fleet and Military Spending Driving the Demand
13.4.2 India
13.4.2.1 New Airport Projects Driving the Demand for Off-Board AR VR Technology
13.4.3 Japan
13.4.3.1 Strong Capabilities in Electronics Driving the Market
13.4.4 Singapore
13.4.4.1 AR VR in MRO Training and Operations Driving the Market
13.4.5 Rest of Asia Pacific
13.4.5.1 AR VR Demand is Driven By Passenger Traffic Due to Increased Tourism
13.5 Rest of the World
13.5.1 Latin America
13.5.1.1 Presence of Aircraft Oems Driving the Market
13.5.2 Middle East
13.5.2.1 Airlines & MRO Training and Operations Driving the Demand
13.5.3 Africa
13.5.3.1 Growth in Passenger Traffic Driving the Market
14 Competitive Landscape (Page No. - 117)
14.1 Introduction
14.2 Competitive Analysis
14.2.1 AR VR Market in Aviation Competitive Leadership Mapping (Overall Market)
14.2.1.1 Visionary Leaders
14.2.1.2 Innovators
14.2.1.3 Dynamic Differentiators
14.2.1.4 Emerging Companies
14.3 Competitive Scenario
14.3.1 Contracts
14.3.2 New Product Launches
14.3.3 Collaborations and Partnerships
14.3.4 Other Strategies
15 Company Profiles (Page No. - 126)
(Business Overview, Products Offered, Recent Developments, SWOT Analysis, MnM View)*
15.1 Microsoft Corporation
15.2 Google Inc.
15.3 Eon Reality
15.4 Aero Glass
15.5 Upskill
15.6 Sita
15.7 HTC
15.8 Bohemia Interactive Simulations
15.9 Oculus VR
15.10 Skylights Aero
15.11 Magic Leap Inc.
15.12 PTC Inc
15.13 Fountx
15.14 Future Visual
15.15 Jasoren
15.16 Atheer Inc.
15.17 Elbit Systems Ltd.
15.18 HoneyWell International Inc.
15.19 Sony
15.20 IBM Corporation
*Details on Business Overview, Products Offered, Recent Developments, SWOT Analysis, MnM View Might Not Be Captured in Case of Unlisted Companies.
16 Appendix (Page No. - 155)
16.1 Discussion Guide
16.2 Knowledge Store: Marketsandmarkets� Subscription Portal
16.3 Available Customizations
16.4 Related Reports
List of Tables (118 Tables)
Table 1 USD Exchange Rates
Table 2 Innovation & Patent Registrations (January 2017� September 2019)
Table 3 AR VR in Aviation Market Size, By Technology, 2017�2025 (USD Million)
Table 4 Augmented Reality in Aviation Market Size, By Region, 2017�2025 (USD Million)
Table 5 Virtual Reality in Aviation Market Size, By Region, 2017�2025 (USD Million)
Table 6 AR VR in Aviation Market Size, By Function, 2017�2025 (USD Million)
Table 7 AR VR in Aviation Training Market Size, By End User, 2017�2025 (USD Million)
Table 8 Use Case: Pilots
Table 9 Use Case: Crew & Ground Support Staff
Table 10 Use Case: Engineers
Table 11 AR VR in Aviation Operations Market Size, By End User, 2017�2025 (USD Million)
Table 12 Use Case: Airlines
Table 13 Use Case: MRO
Table 14 Use Case: Airports
Table 15 Use Case: Aircraft
Table 16 Use Case: Oems
Table 17 AR VR in Aviation Market Size , By Product, 2017�2025 (USD Million)
Table 18 Head-Mounted Displays Market Size, By Region, 2017�2025 (USD Million)
Table 19 Head-Up Displays Market Size, By Region, 2017�2025 (USD Million)
Table 20 Handheld Devices Market Size, By Region, 2017�2025 (USD Million)
Table 21 Gesture-Tracking Devices Market Size, By Region, 2017�2025 (USD Million)
Table 22 Augmented and Virtual Reality in Aviation Market Size, By Component, 2017�2025 (USD Million)
Table 23 Market Size, By Hardware, 2017�2025 (USD Million)
Table 24 AR VR Hardware in Aviation Market Size, By Region, 2017�2025 (USD Million)
Table 25 Market Size, By Software, 2017�2025 (USD Million)
Table 26 AR VR Software in Aviation Market Size, By Region, 2017�2025 (USD Million)
Table 27 Market Size, By Application, 2017�2025 (USD Million)
Table 28 On-Board AR VR in Aviation Market Size, By Application, 2017�2025 (USD Million)
Table 29 On-Board Market Size, By Region, 2017�2025 (USD Million)
Table 30 In-Flight Entertainment Market Size, By Region, 2017�2025 (USD Million)
Table 31 Flight Deck Systems Market Size, By Region, 2017�2025 (USD Million)
Table 32 Off-Board AR VR in Aviation Market Size, By Region, 2017�2025 (USD Million)
Table 33 Market Size, By Vertical, 2017�2025 (USD Million)
Table 34 Market Size, By Region, 2017�2025 (USD Million)
Table 35 North America: AR VR in Aviation Market Size, By Application, 2017�2025 (USD Million)
Table 36 North America: On-Board AR VR in Aviation Market Size, By Application, 2017�2025 (USD Million)
Table 37 North America: Market Size, By Technology, 2017�2025 (USD Million)
Table 38 North America: Market Size, By Component, 2017�2025 (USD Million)
Table 39 North America: Market Size, By Product, 2017�2025 (USD Million)
Table 40 North America: Market Size, By Country, 2017�2025 (USD Million)
Table 41 US: AR VR in Aviation Market Size, By Application, 2017�2025 (USD Million)
Table 42 US: On-Board Market Size, By Application, 2017�2025 (USD Million)
Table 43 US: Market Size, By Technology, 2017�2025 (USD Million)
Table 44 US: Market Size, By Component, 2017�2025 (USD Million)
Table 45 Canada: Market Size, By Application, 2017�2025 (USD Million)
Table 46 Canada: On-Board AR VR in Aviation Market Size, By Application, 2017�2025 (USD Million)
Table 47 Canada: Market Size, By Technology, 2017�2025 (USD Million)
Table 48 Canada: Market Size, By Component, 2017�2025 (USD Million)
Table 49 Europe: Market Size, By Application, 2017�2025 (USD Million)
Table 50 Europe: On-Board AR VR in Aviation Market Size, By Application, 2017�2025 (USD Million)
Table 51 Europe: Market Size, By Technology, 2017�2025 (USD Million)
Table 52 Europe: Market Size, By Component, 2017�2025 (USD Million)
Table 53 Europe: AR VR in Aviation Market Size, By Product, 2017�2025 (USD Million)
Table 54 Europe: Market Size, By Country, 2017�2025 (USD Million)
Table 55 France: Market Size, By Application, 2017�2025 (USD Million)
Table 56 France: On-Board AR VR in Aviation Market Size, By Application, 2017�2025 (USD Million)
Table 57 France: Market Size, By Technology, 2017�2025 (USD Million)
Table 58 France: Market Size, By Component, 2017�2025 (USD Million)
Table 59 UK: Augmented and Virtual Reality in Aviation Market Size, By Application, 2017�2025 (USD Million)
Table 60 UK: On-Board AR VR in Aviation Market Size, By Application, 2017�2025 (USD Million)
Table 61 UK: Market Size, By Technology, 2017�2025 (USD Million)
Table 62 UK: Market Size, By Component, 2017�2025 (USD Million)
Table 63 Germany: Augmented and Virtual Reality in Aviation Market Size, By Application, 2017�2025 (USD Million)
Table 64 Germany: On-Board AR VR in Aviation Market Size, By Application, 2017�2025 (USD Million)
Table 65 Germany: Market Size, By Technology, 2017�2025 (USD Million)
Table 66 Germany: Market Size, By Component, 2017�2025 (USD Million)
Table 67 Rest of Europe: Augmented and Virtual Reality in Aviation Market Size, By Application, 2017�2025 (USD Million)
Table 68 Rest of Europe: On-Board AR VR in Aviation Market Size, By Application, 2017�2025 (USD Million)
Table 69 Rest of Europe: Market Size, By Technology, 2017�2025 (USD Million)
Table 70 Rest of Europe: Market Size, By Component, 2017�2025 (USD Million)
Table 71 Asia Pacific: Augmented and Virtual Reality in Aviation Market Size, By Application, 2017�2025 (USD Million)
Table 72 Asia Pacific: On-Board AR VR in Aviation Market Size, By Application, 2017�2025 (USD Million)
Table 73 Asia Pacific: Market Size, By Technology, 2017�2025 (USD Million)
Table 74 Asia Pacific: Market Size, By Component, 2017�2025 (USD Million)
Table 75 Asia Pacific: Market Size, By Product, 2017�2025 (USD Million)
Table 76 Asia Pacific: Market Size, By Country, 2017�2025 (USD Million)
Table 77 China: Augmented and Virtual Reality in Aviation Market Size, By Application, 2017�2025 (USD Million)
Table 78 China: On-Board AR VR in Aviation Market Size, By Application, 2017�2025 (USD Million)
Table 79 China: Market Size, By Technology, 2017�2025 (USD Million)
Table 80 China: Market Size, By Component, 2017�2025 (USD Million)
Table 81 India: AR VR in Aviation Market Size, By Application, 2017�2025 (USD Million)
Table 82 India: On-Board Augmented and Virtual Reality in Aviation Market Size, By Application, 2017�2025 (USD Million)
Table 83 India: Market Size, By Technology, 2017�2025 (USD Million)
Table 84 India: Market Size, By Component, 2017�2025 (USD Million)
Table 85 Japan: Market Size, By Application, 2017�2025 (USD Million)
Table 86 Japan: On-Board AR VR in Aviation Market Size, By Application, 2017�2025 (USD Million)
Table 87 Japan: Augmented and Virtual Reality in Aviation Market Size, By Technology, 2017�2025 (USD Million)
Table 88 Japan: Augmented and Virtual Reality in Aviation Market Size, By Component, 2017�2025 (USD Million)
Table 89 Singapore: Market Size, By Application, 2017�2025 (USD Million)
Table 90 Singapore: On-Board AR VR in Aviation Market Size, By Application, 2017�2025 (USD Million)
Table 91 Singapore: Market Size, By Technology, 2017�2025 (USD Million)
Table 92 Singapore: Market Size, By Component, 2017�2025 (USD Million)
Table 93 Rest of Asia Pacific: Market Size, By Application, 2017�2025 (USD Million)
Table 94 Rest of Asia Pacific: On-Board AR VR in Aviation Market Size, By Application, 2017�2025 (USD Million)
Table 95 Rest of Asia Pacific: Market Size, By Technology, 2017�2025 (USD Million)
Table 96 Rest of Asia Pacific: Market Size, By Component, 2017�2025 (USD Million)
Table 97 Rest of the World: AR VR in Aviation Market Size, By Application, 2017�2025 (USD Million)
Table 98 Rest of the World: On-Board AR VR in Aviation Market Size, By Application, 2017�2025 (USD Million)
Table 99 Rest of the World: Market Size, By Technology, 2017�2025 (USD Million)
Table 100 Rest of the World: Market Size, By Component, 2017�2025 (USD Million)
Table 101 Rest of the World: Market Size, By Product, 2017�2025 (USD Million)
Table 102 Rest of the World: Market Size, By Region, 2017�2025 (USD Million)
Table 103 Latin America: AR VR in Aviation Market Size, By Application, 2017�2025 (USD Million)
Table 104 Latin America: On-Board AR VR in Aviation Market Size, By Application, 2017�2025 (USD Million)
Table 105 Latin America: Market Size, By Technology, 2017�2025 (USD Million)
Table 106 Latin America: Market Size, By Component, 2017�2025 (USD Million)
Table 107 Middle East: AR VR in Aviation Market Size, By Application, 2017�2025 (USD Million)
Table 108 Middle East: On-Board AR VR in Aviation Market Size, By Application, 2017�2025 (USD Million)
Table 109 Middle East: Market Size, By Technology, 2017�2025 (USD Million)
Table 110 Middle East: AR VR in Aviation Market Size, By Component, 2017�2025 (USD Million)
Table 111 Africa: Market Size, By Application, 2017�2025 (USD Million)
Table 112 Africa: On-Board AR VR in Aviation Market Size, By Application, 2017�2025 (USD Million)
Table 113 Africa: Market Size, By Technology, 2017�2025 (USD Million)
Table 114 Africa: Market Size, By Component, 2017�2025 (USD Million)
Table 115 Contracts, January 2017�September 2019
Table 116 New Product Launches, January 2017�September 2019
Table 117 Collaborations and Partnerships, January 2017�September 2019
Table 118 Other Strategies, January 2017�September 2019
List of Figures (40 Figures)
Figure 1 Markets Covered
Figure 2 Research Flow
Figure 3 Research Design: AR VR Market in Aviation
Figure 4 Breakdown of Primary Interviews: By Company Type, Designation, and Region
Figure 5 Market Size Estimation Methodology: Bottom-Up Approach
Figure 6 Market Size Estimation Methodology: Top-Down Approach
Figure 7 Data Triangulation
Figure 8 Assumptions for the Research Study
Figure 9 By Function, Operation Segment Projected to Lead AR VR Market in Aviation During Forecast Period
Figure 10 By Technology, Virtual Reality Segment of AR VR Market in Aviation Projected to Dominate During the Forecast Period
Figure 11 By Vertical, Commercial Aviation Segment of AR VR Market in Aviation Projected to Lead During the Forecast Period
Figure 12 North America to Account for Largest Share of AR VR Market in Aviation in 2019
Figure 13 Increased Efficiency and Reduced Human Error Drive Market for AR VR in Aviation
Figure 14 Operation Function to Lead AR VR Market in Aviation During Forecast Period
Figure 15 Augmented Reality Expected to have A Higher CAGR During Forecast Period
Figure 16 Japan AR VR Market in Aviation to Grow at the Highest CAGR During Forecast Period
Figure 17 Market Dynamics: AR VR Market in Aviation
Figure 18 Ecosystem
Figure 19 Augmented and Virtual Reality in Aviation Market Size, By Technology, 2019 & 2025 (USD Million)
Figure 20 Market Size, By Function, 2019 & 2025 (USD Million)
Figure 21 Market Size, By Product, 2019 & 2025 (USD Million)
Figure 22 Market Size, By Component, 2019 & 2025 (USD Million)
Figure 23 Market Size, By Application, 2019 & 2025 (USD Million)
Figure 24 Market Size, By Vertical, 2019 & 2025 (USD Million)
Figure 25 North America Estimated to Be the Largest Market for AR VR in Aviation in 2019
Figure 26 North America: Augmented and Virtual Reality in Aviation Market Snapshot
Figure 27 Europe: Market Snapshot
Figure 28 Asia Pacific: Market Snapshot
Figure 29 Companies Adopted Contracts as A Key Growth Strategy Between January 2017 and September 2019
Figure 30 AR VR Market in Aviation (Global) Competitive Leadership Mapping, 2018
Figure 31 Strength of Product Portfolio
Figure 32 Business Strategy Excellence
Figure 33 Microsoft Corporation: Company Snapshot
Figure 34 Google Inc: Company Snapshot
Figure 35 HTC: Company Snapshot
Figure 36 PTC Inc: Company Snapshot
Figure 37 Elbit Systems: Company Snapshot
Figure 38 Honeywell: Company Snapshot
Figure 39 Sony: Company Snapshot
Figure 40 IBM: Company Snapshot
The study considered major activities to estimate the current market size for AR VR market in aviation. Exhaustive secondary research was undertaken to collect information on the market, the peer market, and the parent market. The next step was to validate these findings, assumptions, and sizing with industry experts across the value chain through primary research. Both top-down and bottom-up approaches were employed to estimate the complete market size. Thereafter, market breakdown and data triangulation were used to estimate the market size of segments and subsegments.
Secondary Research
In the secondary research process, various secondary sources, such as Hoovers, Bloomberg, BusinessWeek, and Aerospace Magazine were referred to identify and collect information for this study. These secondary sources included annual reports, press releases & investor presentations of companies, white papers, certified publications, articles by recognized authors, gold standard & silver standard websites, regulatory bodies, trade directories, and databases.
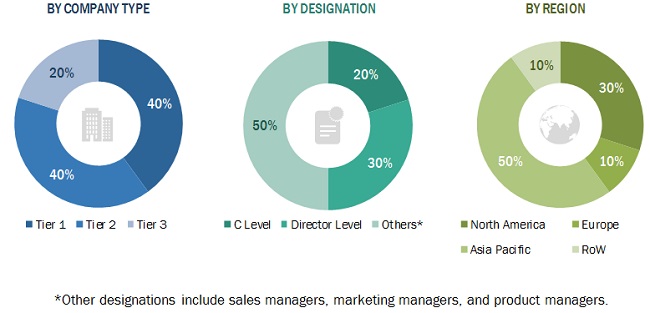
Primary Research
The augmented and virtual reality market in aviation comprises several stakeholders, such as raw material suppliers, end-product manufacturers, and regulatory organizations, in the supply chain. The demand side of this market is characterized by various end-users, such as Airports, OEMs, and aftermarket players. The supply side is characterized by advancements in AR VR technology and the development of hardware and software for AR VR systems. Various primary sources from both the supply and demand sides of the market were interviewed to obtain qualitative and quantitative information. Following is the breakdown of primary respondents.
To know about the assumptions considered for the study, download the pdf brochure
Market Size Estimation
Both the top-down and bottom-up approaches were used to estimate and validate the total size of the augmented and virtual reality market in aviation. These methods were also used extensively to determine the size of various subsegments in the market. The research methodology used to estimate the market size includes the following details.
- Key players in the industry and markets were identified through extensive secondary research.
- The industry�s supply chain and market size, in terms of value, were determined through primary and secondary research processes.
- All percentage shares, splits, and breakdowns were determined using secondary sources and verified through primary sources.
Data Triangulation
After arriving at the overall market size�using the market size estimation processes explained above�the market was split into several segments and subsegments. In order to complete the overall market engineering process and arrive at the exact statistics of each market segment and subsegment, the data triangulation and market breakdown procedures were employed, wherever applicable. The data was triangulated by studying various factors and trends, from both the demand and supply sides, in the augmented and virtual reality market in aviation.
Report Objectives
- To define, describe, segment, and forecast the size of the augmented and virtual reality market in aviation based on type, platform, material, end-use, and region
- To forecast the market size of various segments of the augmented and virtual reality market in aviation with respect to four major regions: North America, Europe, Asia Pacific, and Rest of the World, along with major countries in each region
- To identify and analyze key drivers, restraints, opportunities, and challenges influencing the growth of the augmented and virtual reality market in aviation
- To identify industry trends, market trends, and technology trends currently prevailing in the augmented and virtual reality market in aviation
- To strategically analyze micromarkets with respect to individual growth trends, prospects, and contribution to the overall market
- To analyze the degree of competition in the augmented and virtual reality market in aviation by identifying key market players
- To analyze competitive developments, such as partnerships, contracts, expansion, funding, collaborations, product launch, mergers, and acquisitions of key players in the augmented and virtual reality market in aviation
- To identify detailed financial positions, key products, unique selling points, and key developments of leading companies in the augmented and virtual reality market in aviation
- To strategically profile key market players and comprehensively analyze their market ranking and core competencies
Available Customizations
With the given market data, MarketsandMarkets offers customizations according to a company�s specific needs.
Product Analysis
- Product matrix, which gives a detailed comparison of the product portfolio of each company
Regional Analysis
- Further breakdown of the market segments at country-level
Company Information
- Detailed analysis and profiling of additional market players (up to 5)
Further sub-segmentation
- Further breakdown of the technology segment


Growth opportunities and latent adjacency in Augmented and Virtual Reality (AR VR) Market