Automotive Hypervisor Market by Type, Vehicle Type, End User, Level Of Autonomous Driving, Bus System (Controller Area Network (CAN), Local Interconnect Network (LIN), Ethernet, and FlexRay), Sales Channel and Region - Global Forecast to 2027
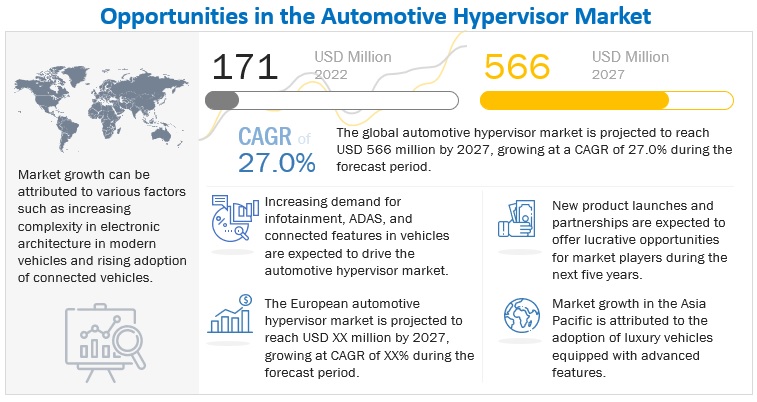
The global automotive hypervisor market in terms of revenue was estimated to be worth $171 million in 2022 and is poised to reach $566 million by 2027, growing at a CAGR of 27.0% from 2022 to 2027. The Asia Pacific market is a vast geographical region comprising countries such as Japan, China, India, South Korea, and Thailand. The European market includes countries such as France, Germany, Spain, Russia, and the UK. Some of the major OEMs in the European region such as Volkswagen, Daimler AG, and Volvo Cars are pioneers in automotive technologies. The North American market includes countries such as the US, Canada, and Mexico.
The rising need for the consolidation of ECUs and reducing hardware content in vehicles without compromising on the advanced features are expected to boost the hypervisor market in Europe and North America. Various countries have now mandated the installation of safety features such as blind spot detection, lane departure warning, automatic emergency braking, and park assist. Increasing stringency of government mandates are expected to increase the demand for ADAS and safety systems, which, in turn, is expected to drive the growth of the hypervisor technology.

To know about the assumptions considered for the study, Request for Free Sample Report
Driver: Increasing adoption of connected cars and advanced automotive technologies
New generation vehicles have evolved from simple transportation mediums to advanced connectivity platforms. The connected car technology has led to advancements in vehicles, which provide assistance to consumers in driving safely, avoiding accidents, lowering CO2 and NOx emissions, benefiting from insurance telematics with lower premiums, and enjoying connected lifestyle services such as on-demand entertainment and infotainment. According to Statista, as of 2021, there are 84 million connected vehicles on the road. Connected vehicles offer opportunities for improving efficiency, reducing road congestion and emissions, enhancing safety, internet connectivity, smarter parking, app to car connectivity and better vehicle maintenance. This also helps in reducing infrastructure costs. The increasing number of connected cars has opened new revenue generating opportunities for stakeholders in the connected car ecosystem.
Restraint: Lower implementation of technology in economy vehicles
Economy class passenger cars are equipped with a lower number of advanced features such as digital cluster, infotainment application, traction control, safety features, and others which are expected to require a lower number of multi domain controllers. Thus, the economy vehicle segment is equipped with low number of ECUs and a low number of hypervisors. This is a major restraint for economy class vehicles in installing a hypervisor for each economy vehicle model. Thus, to maintain the low cost of the economy vehicle, a lower number of infotainment features and safety features are provided. This factor restricts automakers in installing advanced functions in economy passenger cars to limit the overall price of the vehicles to maintain the sales of these variants.
Opportunity: Rise in demand for luxury cars
Rise in demand for luxury cars is one of the factors fueling the automotive hypervisor market. For instance, Mercedes-Benz car sales across the world in 2021 were around 2 million units. Mercedes-Benz sold around 227 thousand units of plug-in hybrid as well as electric passenger cars, of which around 48 thousand units sold were Mercedes-EQ battery electric passenger cars. The sales of SUVs in North America, specifically in the US, rose by 9.5%. In the US, various automakers witnessed a rise in sales of SUVs. For instance, Volkswagen sold around 273 thousand units in 2021, which is a 45% rise compared to 2020. Porsche sold around 42 thousand units and witnessed a rise in the sale of SUVs by 14% as compared to 2020. Renault-Nisan sold around 520,000 units which was a rise of 10% as compared to 2020. Canada also witnessed a rise in SUV sales in 2021, which was 900 thousand units.
Challenge: Risk of cybersecurity in connected vehicles
The automotive industry has undergone a major shift over the past few years with the buzz around electric vehicles, autonomous cars, enhanced safety features and reduced emissions. There has been an increasing penetration of information technology and IoT within the automotive vertical as well. Increased regulations on safety features have added many new systems within the connected cars. Modern-day vehicles can no longer be perceived as just mechanical systems as these are equipped with electronic features such as the infotainment application, safety features, and others. Vehicles are increasingly connected with capabilities to sync with mobile phones and communicate safety information to other vehicles and surrounding infrastructure. Though vehicle connectedness offers advantages in passenger experience and safety, it also offers opportunities for hackers to hijack and place both, passenger and pedestrian life at risk. Many car hacks were successful because hackers were able to exploit vehicular communication. Thus, the increasing number of electronics features are expected to require a high number of MDCs in vehicles, and in turn, a high number of hypervisors. In May 2022, General Motors became the victim of cyber-attack in the automotive world. The hackers accessed the information from the automakers online/mobile application accounts. However, the increasing risk of cybersecurity offers challenges for connected vehicles and the hypervisor market.
Automotive Hypervisor Market Share
The percentage of the whole market owned by specific companies selling hypervisor solutions is referred to as the automotive hypervisor market share. Hypervisors, also known as virtual machine managers, are software programmes that allow numerous operating systems to operate on a single physical server, making better use of hardware resources. The growing acceptance of cloud computing, the necessity for cost-effective server consolidation, and the rise of virtualization in numerous industries are driving the automotive hypervisor market. A few key players dominate the global hypervisor industry, including VMware, Inc., Microsoft Corporation, Citrix Systems, Inc., and Red Hat, Inc. The use of hypervisors is likely to increase in the next years, owing to the increasing acceptance of cloud computing.
Asia Pacific will be a major contributor for Automotive Hypervisor Market
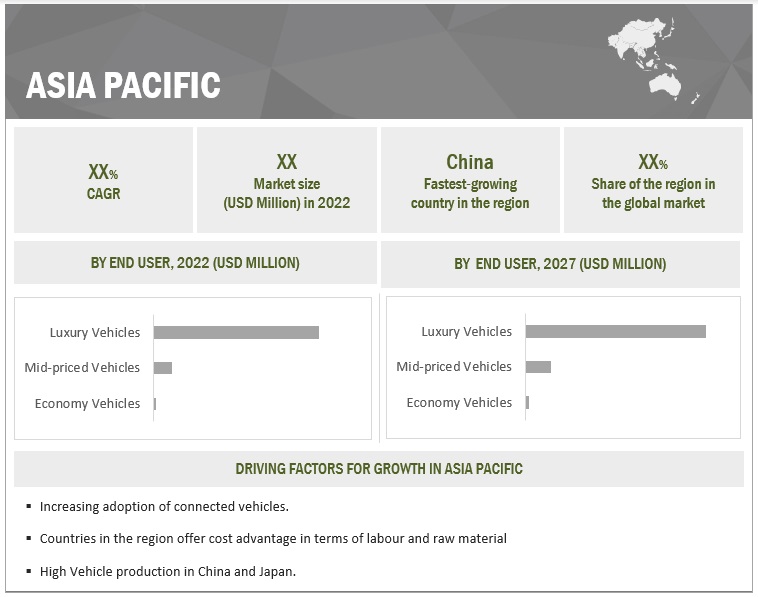
The demand for luxury segment vehicles can be a factor driving growth in this segment. Emerging leaders such as India and Thailand have also contributed to the growth of the hypervisor market. The overall growth in demand for hypervisors is majorly due to the rising adoption of advanced features such as ADAS, safety, in-vehicle infotainment, navigation systems, and telematics in next-generation vehicles. In addition, Asia Pacific has a vast ecosystem in terms of the development of self-driving cars. This includes tech giants, automotive OEMs, electric vehicle OEMs, full-stack developers, and tier 1 suppliers. With multiple partnerships amongst these players as well as with government agencies, Asia Pacific is expected to be a potential market for automotive hypervisor during the forecast period.

To know about the assumptions considered for the study, download the pdf brochure
Key Market Players
The key players considered in the analysis of the Automotive Hypervisor market are as Panasonic (Japan), NXP Semiconductors (Netherlands), Renesas Electronics (Japan), Blackberry (Canada), and Visteon Corporation (US). These companies offer extensive products for the automotive industry and have strong distribution networks, and they invest heavily in R&D to develop new products.
Scope of the Report
|
Report Metrics |
Details |
| Market size available for years | 2022–2027 |
| Base year considered | 2021 |
| Forecast period | 2022-2027 |
| Forecast Market Size | Value |
| Segments covered | By type (type 1 and type 2), by vehicle type (passenger cars, LCVs, and HCVs), by bus system, by end user, by level of autonomous driving, by sales channel |
| Region covered | Asia Pacific, Europe, North America and RoW |
| Companies Covered |
Panasonic (Japan), NXP Semiconductors (Netherlands), Renesas Electronics (Japan), Blackberry (Canada), and Visteon Corporation (US) are top players in the market A total of 23 companies are profiled in the report |
This research report categorizes the Automotive Hypervisor market based on type, vehicle type, bus system, end user, level of autonomous driving, sales channel and region
By type
- Type 1
- Type 2
By vehicle type
- Passenger Cars
- LCVs
- HCVs
By bus system
- CAN
- LIN
- Ethernet
- Flexray
By end user
- Economy Vehicles
- Mid-priced Vehicles
- Luxury Vehicles
By level of autonomous driving
- Semi-autonomous Vehicles
- Autonomous Vehicles
By sales channel
- OEM
- Aftermarket
By Region
- North America
- Asia Pacific
- Europe
- Rest of the World
Recent Developments
- In April 2022, NXP Semiconductors launched S32G, that helps to address real-time and application development challenges of software-defined vehicles using S32G vehicle network processors.
- In April 2022, Renesas Electronics debuted with Automotive ECU Virtualization platform that enables designers to integrate multiple applications into a single ECU (Electronic Control Unit) that are safely and securely separated from each other to avoid interference.
- In January 2022, Visteon Corporation launched SmartCore™ cockpit domain controller designed to enable global automakers to deliver a more connected, personalized and safe driving experience.
Frequently Asked Questions (FAQ):
What are different segment covered in report for Automotive Hypervisor market?
The Automotive Hypervisor market is covered by type, by end user, by vehicle type, by level of autonomous driving, by bus system, by sales channel and by region.
Who are the major players in automotive hypervisor market?
Panasonic (Japan), NXP Semiconductors (Netherlands), Renesas Electronics (Japan), Blackberry (Canada), and Visteon Corporation (US) are recognized as stars in the Automotive Hypervisor market. They have a strong portfolio of automotive hypervisors. These companies have been marking their presence in by offering advanced automotive hypervisors, coupled with their robust business strategies, to achieve constant growth in the automotive hypervisor market. Moreover, these companies have a strong presence across the globe.
What are the new market trends impacting the growth of the Automotive Hypervisor market?
The Automotive Hypervisor market has witnessed rapid evolution with ongoing developments in engineering and technology. Advanced features such as ADAS, safety, in-vehicle infotainment, navigation systems, and telematics in next-generation vehicles are driving the automotive hypervisor market.
Which regions are considered in the Automotive Hypervisor market?
The report covers market sizing for regions such as Asia Pacific, Europe, North America and Rest of the World.
To speak to our analyst for a discussion on the above findings, click Speak to Analyst

The study involved four major activities in estimating the current size of the Automotive Hypervisor market. Exhaustive secondary research was done to collect information on the market, the peer market, and the parent market. The next step was to validate these findings, assumptions, and sizing with the industry experts across value chains through primary research. The top-down and bottom-up approaches were employed to estimate the complete market size. Thereafter, market breakdown and data triangulation processes were used to estimate the market size of segments and subsegments.
Secondary Research
In the secondary research process, various secondary sources such as company annual reports/presentations, press releases, industry association publications [for example, corporate filings such as annual reports, investor presentations, and financial statements; and trade, business] have been used to identify and collect information useful for an extensive commercial study of the Automotive Hypervisor market.
Primary Research
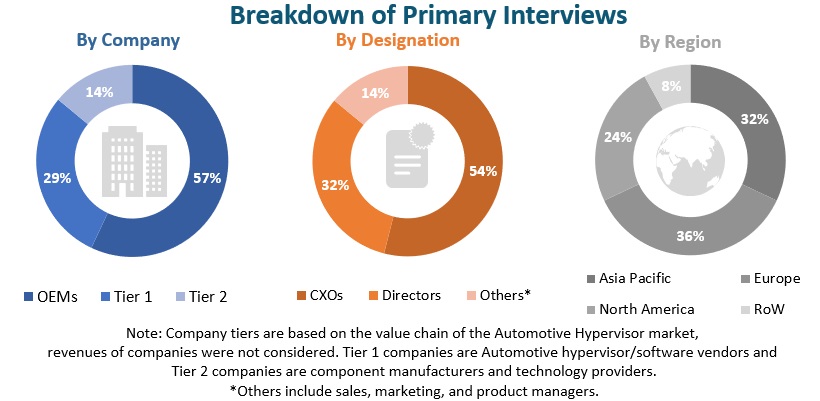
Extensive primary research was conducted after acquiring an understanding of the Automotive Hypervisor market scenario through secondary research. Several primary interviews were conducted with market experts from both the demand (automotive software vendors, country-level government associations, and trade associations) and supply (OEMs and component manufacturers) sides across major regions, namely, Asia Pacific, Europe, North America and RoW, and primary interviews were conducted from the demand and supply sides, respectively. Primary data was collected through questionnaires, emails, and telephonic interviews. In the canvassing of primaries, various departments within organizations, such as sales, operations, and administration, were covered to provide a holistic viewpoint in this report.
After interacting with industry experts, brief sessions with highly experienced independent consultants were conducted to reinforce the findings from primaries. This, along with the in-house subject-matter experts’ opinions, has led to the findings described in the remainder of this report.

To know about the assumptions considered for the study, download the pdf brochure
Market Size Estimation
A detailed market estimation approach was followed to estimate and validate the volume of the Automotive Hypervisor market and other dependent submarkets, as mentioned below:
- Key players in the Automotive Hypervisor market were identified through secondary research, and their market shares were determined through primary and secondary research
- The research methodology included the study of the annual and quarterly financial reports & regulatory filings of major market players, as well as interviews with industry experts for detailed market insights
- All major penetration rates, percentage shares, splits, and breakdowns for the Automotive Hypervisor market were determined using secondary sources and verified through primary sources
- All key macro indicators affecting the revenue growth of the market segments and subsegments were accounted for, viewed in extensive detail, verified through primary research, and analyzed to get the validated and verified quantitative & qualitative data
- The gathered market data was consolidated and added with detailed inputs, analyzed, and presented in this report
Data Triangulation
After arriving at the overall market size—using the market size estimation processes as explained above—the market was split into several segments and sub-segments. To complete the overall market engineering process and arrive at the exact statistics of each market segment and sub-segment, data triangulation, and market breakdown procedures were employed, wherever applicable. The data was triangulated by studying various factors and trends from both the demand and supply sides.
Report Objectives
- To analyze the Automotive Hypervisor market and forecast its size, in terms of value (from 2022 to 2027)
- To provide detailed information regarding major factors influencing the growth of the market (drivers, restraints, opportunities, and challenges)
- To segment and forecast the market size by value, based on region (Asia Pacific, Europe, North America, and Rest of the World)
- To segment and forecast the market size by value, based on type (type 1 and type 2)
- To segment and forecast the market size by value, based on vehicle type (passenger cars, LCVs, and HCVs)
- To segment and forecast the market size by value, based on bus system (Controller Area Network (CAN), Local Interconnect Network (LIN), Ethernet, and FlexRay)
- To segment and forecast the market size by value, based on end user (economy vehicles, mid-priced vehicles, and luxury vehicles)
- To segment and forecast the market size by value, based on level of autonomous driving (semi-autonomous vehicles and autonomous vehicles)
- To segment market based on sales channel (OEM and Aftermarket)
- To strategically profile key players and comprehensively analyze their market shares and core competencies
- To track and analyze competitive developments such as new product developments, deals and other activities carried out by key industry participants.
Available Customizations
With the given market data, MarketsandMarkets offers customizations in line with company-specific needs.
- Automotive Hypervisor market, by vehicle type, by region
- Profiles of additional market players (up to 3)


 Generating Response ...


Growth opportunities and latent adjacency in Automotive Hypervisor Market