Multi Domain Controller Market by Vehicle Type, Application (ADAS & Safety, Body & Comfort, Cockpit and Powertrain), Propulsion Type (BEV, HEV & ICE), Bus Systems, Bit Size (32, 64 & 128-bit), Level of Autonomy & Region - Global Forecast to 2030


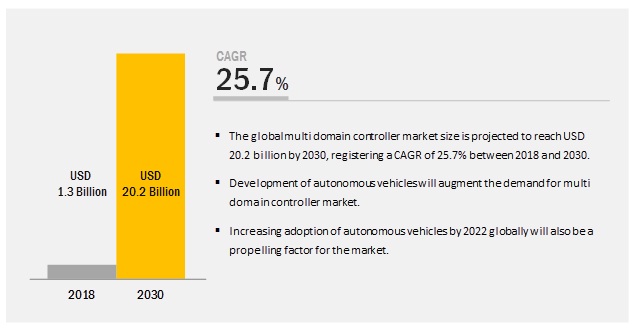
[177 Pages Report] The multi domain controller market is estimated to be USD 1.3 billion in 2018 and is projected to reach USD 20.2 billion by 2030, at a CAGR of 25.7% during the forecast period. The increasing focus on R&D activities and rapid technological changes owing to the changing government norms for vehicle safety are projected to drive the market.
The 128-bit segment is expected to be the fastest growing market, by bit size, during the forecast period.
The 128-bit segment will grow at the highest rate as the industry moves toward the new priority of manufacturing self-driving cars and environment-friendly vehicles. The 128-bit MDCs have the highest bit rate and are hence the most suitable for ADAS and safety functions as they can respond the quickest. These MDCs will start gaining momentum in the near future (within 5-8 years) due to the increasing adoption of autonomous vehicles.
The autonomous vehicle segment is expected to have the highest growth in the market, by level of autonomy, during the forecast period.
Autonomous vehicles (L4-High Automation and L5-Full Automation) are those vehicles that do not require any human intervention for their functioning. The demand for such vehicles is expected to increase in the future as extensive R&D activities, and multiple strategic partnerships in the automotive industry have led to innovative developments that make them more reliable and sustainable. The demand for automotive Multi Domain Controllers (MDCs) is also expected to rise in proportion to the production of fully autonomous vehicles due to their obvious advantages over ECUs such as centralized topologies and high bandwidth, which helps in simultaneously controlling all the functions in the vehicle.
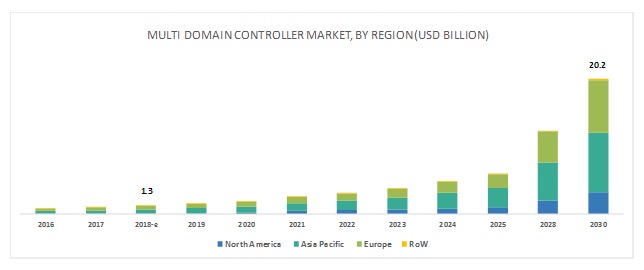
Asia Pacific is expected to account for the largest market size during the forecast period.
Asia Pacific is expected to be the largest region in the market during the forecast period. Asia Pacific comprises emerging economies, such as China and India, along with developed nations, such as Japan, and is the largest market for automobiles. In recent years, the region has emerged as a hub for automobile production. Infrastructural developments and industrialization in the emerging economies have opened new avenues, creating several opportunities for the automotive OEMs. To gain a competitive advantage in the market, OEMs are offering advanced applications such as HMI, keyless entry, and auto-park assist among others, which naturally increases the number of ECUs in vehicles. This, in turn, is expected to drive the growth of the market in the region. Moreover, the different governments in the region are set to introduce stringent environmental regulations, for OEMs from 2020, compelling manufacturers to reduce vehicle weight. All these factors are expected to fuel the growth of the market in the region.
Key Market Players
The key players in the multi domain controller market are Continental AG (Germany), Visteon Corporation (US), Robert Bosch GmbH (Germany), Aptiv (Ireland), Panasonic Corporation (Japan), ZF Friedrichshafen AG (Germany), Faurecia (France), Magna International Inc. (Canada), Lear Corporation (US), Autoliv Inc. (Sweden). Continental is anticipated to be a dominant player in the market. Continental adopted the strategies of new product development, expansion, supply contracts and merger & acquisition to retain its leading position in the market. Strengthening the product portfolio and global presence by building customer relationships, Continental has left a mark not only in the current market but also in emerging markets such as India. This is the strategy that Continental is following to maintain its leadership in the market.
Recent Developments
- In September 2018, Continental developed an environment model that captures vehicle environment using various sensors. The data from sensors such as camera, radar and [laser-based], and LIDAR are combined with additional information such as the profile of the route ahead which is collected, evaluated, and interpreted by an intelligent control unit—Assisted and Automated Driving Control Unit (ADCU).
- In October 2018, Faurecia announced the acquisition of Parrot Faurecia Automotive. The deal followed the announcement of an agreement between Parrot and Faurecia on July 5, 2018, regarding Faurecia's proposal to acquire 100% stake in Parrot Faurecia Automotive. The transaction is based on an enterprise value of USD 114.6 million (EUR 100 million).
- In August 2018, Visteon and ZongMu Technology, a China-based supplier of ADAS, signed a strategic cooperation agreement to develop Level 3-plus autonomous driving solutions. Under the agreement, Visteon and ZongMu will combine their strengths to jointly develop a self-parking solution integrating Visteon’s DriveCore autonomous driving platform and ZongMu’s autonomous parking system.
Key questions addressed in the report
- Where will all these developments take the industry in the mid- to long-term?
- How will the increasing adoption of electric vehicles and changing environmental norms affect the market?
- What are the technical features that are disrupting the market?
- Who are the key players in the market and how intense is the competition?
- How will the advent of autonomous vehicles impact the market?
- What will be the future technological advancements in multi domain controllers?
To speak to our analyst for a discussion on the above findings, click Speak to Analyst
 Exclusive indicates content/data unique to MarketsandMarkets and not available with any competitors.
Table of Contents
1 Introduction (Page No. - 19)
1.1 Objectives of the Study
1.2 Market Definition
1.3 Market Scope
1.3.1 Markets Covered
1.3.2 Years Considered for the Study
1.4 Currency
1.5 Package Size
1.6 Limitations
1.7 Stakeholders
2 Research Methodology (Page No. - 23)
2.1 Research Data
2.2 Secondary Data
2.2.1 Key Secondary Sources
2.2.2 Key Data From Secondary Sources
2.3 Primary Data
2.3.1 Sampling Techniques & Data Collection Methods
2.3.2 Primary Participants
2.4 Data Triangulation
2.5 Assumptions
3 Executive Summary (Page No. - 30)
4 Premium Insights (Page No. - 34)
4.1 Attractive Opportunities in the Market
4.2 Market, By Region
4.3 Market, By Country
4.4 Market, By Vehicle Type
4.5 Market, By Application
4.6 Market, By Level of Autonomy
4.7 Market, By Bus Systems
4.8 Market, By Propulsion Type
4.9 Market, By Bit Size
5 Industry Trends (Page No. - 40)
5.1 Future of Vehicles’ Electronic Architecture
5.2 Technology Overview
5.2.1 Technical Aspects of Multi Domain Controllers
5.2.1.1 Hypervisor
5.2.1.2 Cybersecurity
5.2.1.3 Ethernet
5.2.2 Comparison of Vehicle Bus Systems
5.3 Future Outlook of Multi Domain Controller
5.3.1 Evolution of the Domain Centralization Architecture
5.4 Market - Regulatory Overview
5.5 Factor Analysis
5.5.1 Demand-Side Analysis
5.5.1.1 Reduction in Overall Cost of the Vehicle Triggering the Demand for Multi Domain Controllers
5.5.2 Supply-Side Analysis
5.5.2.1 Growing Demand for Lightweight and Efficient Vehicles Will Drive theMarket
6 Market Overview (Page No. - 47)
6.1 Introduction
6.2 Multi Domain Controller Evolution
6.3 Market Dynamics
6.3.1 Drivers
6.3.1.1 Development of Autonomous Vehicles
6.3.1.2 Increasing Complexity of Electrical-Electronic Architecture in Modern Vehicles
6.3.1.3 Government Regulations Related to Vehicle Safety
6.3.2 Restraints
6.3.2.1 Product and Integration Complexity at Manufacturer’s End
6.3.2.2 Non-Availability of Skilled Labor for High-Speed Communication Links and Automotive Storage
6.3.2.3 High Entry Barriers for Startups
6.3.3 Opportunities
6.3.3.1 Leveraging Automotive Software
6.3.3.1.1 Types of Hypervisor Technologies
6.3.3.2 Multiple Partnerships With Companies Having Expertise in Specific Domains
6.3.4 Challenges
6.3.4.1 Engineering Design Constraints
6.3.4.2 Restructuring of Teams to Provide Consolidated Solutions
6.3.4.3 Lack of Diligence in Power Consumption
6.4 Market: Scenario Analysis
6.4.1 Optimistic Scenario
6.4.2 Most Likely Scenario
6.4.3 Pessimistic Scenario
7 Market, By Application (Page No. - 58)
7.1 Introduction
7.2 Adas & Safety
7.2.1 Chassis
7.2.1.1 Government Mandates on Vehicle Safety is the Primary Driver of the Chassis MDC Market
7.3 Body & Comfort
7.3.1 Increasing Demand for High-End Vehicles is Fueling the Growth of Body & Comfort MDCS
7.4 Cockpit Electronics
7.4.1 Infotainment
7.4.1.1 Advanced Features in the Latest Hmi Systems are Driving Infotainment MDCS Market
7.4.2 Connectivity
7.4.2.1 Increase in Development of Connected and Autonomous Vehicles Will Trigger the Growth of Connectivity Domain Controllers
7.5 Powertrain
7.5.1 Asia Pacific Region Projected to Be the Largest Powertrain MDCS Market
8 Market, By Vehicle Type (Page No. - 66)
8.1 Introduction
8.2 Heavy Commercial Vehicles
8.2.1 Europe is Expected to Grow at the Fastest Rate in This Segment of MDC Market By 2030
8.3 Light Commercial Vehicles
8.3.1 North America is Expected to Have Largest Market Share in This Type of MDC Market By 2030
8.4 Passenger Cars
8.4.1 Due to Constant Increase in Advance Features Like Adas & Safety, Infotainment Etc. the Passenger Car Vehicle Type is Expected to Dominate the Overall MDC Market
9 Market, By Propulsion Type (Page No. - 72)
9.1 Introduction
9.2 BEV
9.2.1 Stricter Emission Regulations Throughout the Globe Will Boost the Sale of MDCS Used in Bevs
9.3 HEV
9.3.1 Due to Countries Like UK and Sweden, Europe has the Largest Growth Rate of MDCS for HEV Segment
9.4 Ice
9.4.1 China, India & the European Union Together Constitute the Largest Share of Ice Based Multi Domain Controllers
10 Market, By Bus Systems (Page No. - 79)
10.1 Introduction
10.2 Can & Can Fd
10.2.1 Low Cost and High Configuration Flexibility Makes Can the Preferred Bus System
10.3 Ethernet
10.3.1 Improved Bandwidth and Faster Rate of Data Transmission Between the Devices Will Propel the Growth of Ethernet Based MDCS
10.4 Flexray
10.4.1 to Support Safety Features in Vehicles Flexray Based MDCS Will Gain Momentum in the Market
10.5 LIN
10.5.1 Low Price of LIN Based Multi Domain Controller Will Drive the Market
11 Market, By Bit Size (Page No. - 86)
11.1 Introduction
11.2 32-Bit
11.2.1 Asia Pacific is Expected to Be the Largest Market for 32-Bit MDCS
11.3 64-Bit
11.3.1 Increase in Adas Features to Drive the 64-Bit MDC Market
11.4 128-Bit
11.4.1 Rapid Growth in Autonomous Vehicle Production Will Drive the 128-Bit MDC Market
12 Market, By Level of Autonomy (Page No. - 92)
12.1 Introduction
12.2 Autonomous Vehicles
12.2.1 Need for Higher Efficiency and Lesser Space Consumption in Self-Driving Vehicles Expected to Boost the MDC Market
12.3 Semi-Autonomous Vehicles
12.3.1 Higher Electrification of Vehicle Components and Increasing Safety & Convenience Applications is Expected to Fuel the Growth of MDCS in Semi-Autonomous Vehicles
13 Market, By Operating System (Page No. - 98)
13.1 Introduction
13.2 QNX
13.2.1 Providing Software Solutions for Connected and Autonomous Cars Which Posses Very Complex E/E Architecture Will Fuel the Growth of QNX in MDC Market
13.3 Automotive Grade Linux (AGL)
13.3.1 Ability to Work in Isolation for Safety & Non-Safety Features of Vehicles Without Affecting Their Performance Would Help AGL to Capitalise the MDC Market
13.4 Android
13.4.1 Brand Image of Google Can Help Automakers to Capitalise the Market
14 Market, By Region (Page No. - 101)
14.1 Introduction
14.2 Asia Pacific
14.2.1 China
14.2.1.1 Largest Producer of Automobiles in the World
14.2.2 India
14.2.2.1 Significant Rise in Vehicle Production in India
14.2.3 Japan
14.2.3.1 Technologically Advanced Vehicles Manufactured With Advanced Automotive Electronics
14.2.4 South Korea
14.2.4.1 Introduction of Autonomous Vehicles in South Korea By 2022 That Require Powerful Processing Devices to Support Various Advanced Features
14.2.5 Thailand
14.2.5.1 Largest Automotive Production Capacity Among the Southeast Asian Countries
14.3 Europe
14.3.1 France
14.3.1.1 Rising Safety Concerns Among Consumers and Government Mandates for Vehicle Safety Systems
14.3.2 Germany
14.3.2.1 Germany Houses the Largest Automotive Industry in Europe
14.3.3 Russia
14.3.3.1 Rise in Sales of Passenger Cars Since 2017
14.3.4 Spain
14.3.4.1 Second Biggest Manufacturer of Auto-Parts in the European Union
14.3.5 UK
14.3.5.1 Heavy Investments By Oems Such as Jaguar Land Rover, Nissan, and Honda is Expected to Be the Primary Growth Factor
14.4 North America
14.4.1 Canada
14.4.1.1 Canadian Auto Industry is One of the Largest “Green Tech” Sectors in the World
14.4.2 Mexico
14.4.2.1 Mexico’s Integration With the North American Market
14.4.3 US
14.4.3.1 US Automotive Industry is Highly Inclined Toward Innovation, Technology, and the Development of High-Performance and Fuel-Efficient Vehicles
14.5 Rest of the World
14.5.1 Brazil
14.5.1.1 Brazil Market for MDCS Will Be Driven By the Strong Manufacturing Base of Leading Oems in the Country
14.5.2 Iran
14.5.2.1 Passenger Cars Segment is Projected to Be the Largest MDC Market in Iran
15 Competitive Landscape (Page No. - 129)
15.1 Overview
15.2 Market Ranking Analysis
15.3 Competitive Situations & Trends
15.3.1 New Product Developments
15.3.2 Expansions
15.3.3 Partnerships/Supply Contracts/Collaborations/Joint Ventures/Agreements/Mergers & Acquisitions
15.4 Competitive Leadership Mapping
15.4.1 Visionary Leaders
15.4.2 Innovators
15.4.3 Dynamic Differentiators
15.4.4 Emerging Companies
16 Company Profiles (Page No. - 138)
(Business Overview, Products Offered, Recent Developments, SWOT Analysis)*
16.1 Continental AG
16.2 Visteon Corporation
16.3 Robert Bosch GmbH
16.4 Aptiv PLC
16.5 Panasonic Corporation
16.6 ZF Friedrichshafen AG
16.7 Faurecia
16.8 Magna International Inc.
16.9 Lear Corporation
16.10 Autoliv Inc.
*Details on Business Overview, Products Offered, Recent Developments, SWOT Analysis, Might Not Be Captured in Case of Unlisted Companies.
16.11 Sasken Technologies Ltd
16.12 Magneti Marelli Spa
16.13 Harman International
16.14 Mitsubishi Electric Corporation
16.15 Hitachi Ltd
16.16 NXP Semiconductors
16.17 Texas Instruments
16.18 Nvidia Corporation
16.19 Infineon Technologies
16.20 Stmicroelectronics Nv
16.21 Denso Corporation
16.22 Toshiba
16.23 Broadcom
16.24 Microchip
16.25 Xilinx
16.26 Melexis
16.27 Elmos Semiconductor
16.28 Vector Informatik
16.29 Intel
16.30 Qualcomm
16.31 Maxim Integrated
16.32 on Semiconductor
16.33 Rohm Semiconductor
16.34 Valeo
16.35 Cisco
16.36 Analog Devices Inc.
17 Appendix (Page No. - 170)
17.1 Insights From Industry Experts
17.2 Discussion Guide
17.3 Knowledge Store: Marketsandmarkets’ Subscription Portal
17.4 Available Customizations
17.4.1 Market,By Application, By BEV and Hev
17.4.2 Market, By Bus Systems, By Volume
17.5 Related Reports
17.6 Author Details
List of Tables (91 Tables)
Table 1 Currency Exchange Rates (Wrt USD)
Table 2 Feature-Wise Comparison of Bus Systems
Table 3 Regulations for Safety Systems
Table 4 Market Size, By Application, 2016–2030 (000’ Units)
Table 5 Market Size, By Application, 2016–2030 (USD Million)
Table 6 Adas & Safety: Market Size, By Region, 2016–2030 (000’ Units)
Table 7 Adas & Safety: Market Size, By Region, 2016–2030 (USD Million)
Table 8 Body & Comfort: Market Size, By Region, 2016–2030 (000’ Units)
Table 9 Body & Comfort: Market Size, By Region, 2016–2030 (USD Million)
Table 10 Cockpit Electronics: Market Size, By Region, 2016–2030 (000’ Units)
Table 11 Cockpit Electronics: Market Size, By Region, 2016–2030 (USD Million)
Table 12 Powertrain: Market Size, By Region, 2016–2030 (000’ Units)
Table 13 Powertrain: Market Size, By Region, 2016–2030 (USD Million)
Table 14 Market, By Vehicle Type, 2016–2030 (000’ Units)
Table 15 Market, By Vehicle Type, 2016–2030 (USD Million)
Table 16 Heavy Commercial Vehicles: Market, By Vehicle Type, 2016–2030 (000’ Units)
Table 17 Heavy Commercial Vehicles: Market, By Vehicle Type, 2016–2030 (USD Million)
Table 18 Light Commercial Vehicles: Market, By Vehicle Type, 2016–2030 (000’ Units)
Table 19 Light Commercial Vehicles: Market, By Vehicle Type, 2016–2030 (USD Million)
Table 20 Passenger Cars: Market, By Vehicle Type, 2016–2030 (000’ Units)
Table 21 Passenger Cars: Market, By Vehicle Type, 2016–2030 (USD Million)
Table 22 Market Size, By Propulsion Type, 2016–2030 (000’ Units)
Table 23 Market Size, By Propulsion Type, 2016–2030 (USD Million)
Table 24 BEV: Market Size, By Region, 2016–2030 (000’ Units)
Table 25 BEV: Market Size, By Region, 2016–2030 (USD Million)
Table 26 HEV: Market Size, By Region, 2016–2030 (000’ Units)
Table 27 HEV: Market Size, By Region, 2016–2030 (USD Million)
Table 28 Ice Vehicles: Market Size, By Region, 2016–2030 (000’ Units)
Table 29 Ice Vehicles: Market Size, By Region, 2016–2030 (USD Million)
Table 30Market Size, By Bus Systems, 2016–2030 (USD Million)
Table 31 Can & Can Fd: Market Size, By Region, 2016–2030 (USD Million)
Table 32 Ethernet: Market Size, By Region, 2016–2030 (USD Million)
Table 33 Flexray: Market Size, By Region, 2016–2030 (USD Million)
Table 34 LIN: Market Size, By Region, 2016–2030 (USD Million)
Table 35 Market Size, By Bit Size, 2016–2030 (000’ Units)
Table 36 Market Size, By Bit Size, 2016–2030 (USD Million)
Table 37 32-Bit: Market Size, By Region, 2016–2030 (000’ Units)
Table 38 32-Bit: Market Size, By Region, 2016–2030 (USD Million)
Table 39 64-Bit: Market Size, By Region, 2016–2030 (000’ Units)
Table 40 64-Bit: Market Size, By Region, 2016–2030 (USD Million)
Table 41 128-Bit: Market Size, By Region, 2016–2030 (000’ Units)
Table 42 128-Bit: Market Size, By Region, 2016–2030 (USD Million)
Table 43 Market Size, By Level of Autonomy, 2016–2030 (000’ Units)
Table 44 Market Size, By Level of Autonomy, 2016–2030 (USD Million)
Table 45 Autonomous Vehicles: Market Size, By Region, 2016–2030 (000’ Units)
Table 46 Autonomous Vehicles: Market Size, By Region, 2016–2030 (USD Million)
Table 47 Semi-Autonomous Vehicles: Market Size, By Region, 2016–2030 (000’ Units)
Table 48 Semi-Autonomous Vehicles: Market Size, By Region, 2016–2030 (USD Million)
Table 49 Market, By Region, 2016–2030 (000’ Units)
Table 50 Market, By Region, 2016–2030 (USD Million)
Table 51 Asia Pacific: Market, By Country, 2016–2030 (000’ Units)
Table 52 Asia Pacific: Market, By Country, 2016–2030 (USD Million)
Table 53 China: Market, By Vehicle Type, 2016–2030 (000’ Units)
Table 54 China: Market, By Vehicle Type, 2016–2030 (USD Million)
Table 55 India: Market, By Vehicle Type, 2016–2030 (000’ Units)
Table 56 India: Market, By Vehicle Type, 2016–2030 (USD Million)
Table 57 Japan: Market, By Vehicle Type, 2016–2030 (000’ Units)
Table 58 Japan: Market, By Vehicle Type, 2016–2030 (USD Million)
Table 59 South Korea: Market, By Vehicle Type, 2016–2030 (000’ Units)
Table 60 South Korea: Market, By Vehicle Type, 2016–2030 (USD Million)
Table 61 Thailand: Market, By Vehicle Type, 2016–2030 (000’ Units)
Table 62 Thailand: Market, By Vehicle Type, 2016–2030 (USD Million)
Table 63 Europe: Market, By Country, 2016–2030 (000’ Units)
Table 64 Europe: Market, By Country, 2016–2030 (USD Million)
Table 65 France: Market, By Vehicle Type, 2016–2030 (000’ Units)
Table 66 France: Market, By Vehicle Type, 2016–2030 (USD Million)
Table 67 Germany: Market , By Vehicle Type, 2016–2030 (000’ Units)
Table 68 Germany: Market, By Vehicle Type, 2016–2030 (USD Million)
Table 69 Russia: Market, By Vehicle Type, 2016–2030 (000’ Units)
Table 70 Russia: Market, By Vehicle Type, 2016–2030 (USD Million)
Table 71 Spain: Market, By Vehicle Type, 2016–2030 (000’ Units)
Table 72 Spain: Market, By Vehicle Type, 2016–2030 (USD Million)
Table 73 UK: Market, By Vehicle Type, 2016–2030 (000’ Units)
Table 74 UK: Market, By Vehicle Type, 2016–2030 (USD Million)
Table 75 North America: Market, By Country, 2016–2030 (000’ Units)
Table 76 North America: Market, By Country, 2016–2030 (USD Million)
Table 77 Canada: Market, By Vehicle Type, 2016–2030 (000’ Units)
Table 78 Canada: Market, By Vehicle Type, 2016–2030 (USD Million)
Table 79 Mexico: Market, By Vehicle Type, 2016–2030 (000’ Units)
Table 80 Mexico: Market, By Vehicle Type, 2016–2030 (USD Million)
Table 81 US: Market, By Vehicle Type, 2016–2030 (000’ Units)
Table 82 US: Market, By End Market, 2016–2030 (USD Million)
Table 83 RoW: Market, By Country, 2016–2030 (000’ Units)
Table 84 RoW: Market, By Country, 2016–2030 (USD Million)
Table 85 Brazil: Market, By Vehicle Type, 2016–2030 (000’ Units)
Table 86 Brazil: Market, By Vehicle Type, 2016–2030 (USD Million)
Table 87 Iran: Market, By Vehicle Type, 2016–2030 (000’ Units)
Table 88 Iran: Market, By Vehicle Type, 2016–2030 (USD Million)
Table 89 New Product Developments, 2015–2018
Table 90 Expansions, 2015–2018
Table 91 Partnerships/Supply Contracts/Collaborations/Joint Ventures/Agreements/Mergers & Acquisitions, 2015–2018
List of Figures (59 Figures)
Figure 1 Market Segmentation
Figure 2 Market Segmentation, By Region
Figure 3 Research Design
Figure 4 Research Methodology Model
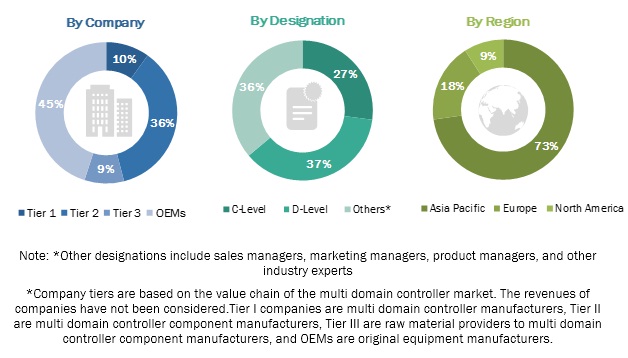
Figure 5 Breakdown of Primary Interviews: By Company Type, Designation, and Region
Figure 6 Market, By Vehicle Type: Bottom-Up Approach
Figure 7 Market, By Application: Top-Down Approach
Figure 8 Market: Market Dynamics
Figure 9 Multi Domain Controllers Used for ADAS & Safety Application to Witness the Highest Growth in the Market, 2018 vs 2030 (USD Million)
Figure 10 64-Bit Multi Domain Controller to Hold the Largest Market Share in the Market By 2030 (USD Million)
Figure 11 Increasing Demand for Safety, Comfort, and Convenience Features in Modern Vehicles Will Drive the MDC Market in the Near Future
Figure 12 Europe Was the Largest Market in 2017 (By Value)
Figure 13 US Market is Expected to Witness the Highest Growth During the Forecast Period (By Value)
Figure 14 Passenger Cars Segment to Be the Largest Market From 2018 to 2030 (By Value)
Figure 15 Adas & Safety Segment is Expected to Grow at the Highest Rate From 2018 to 2030 (By Value)
Figure 16 Autonomous Vehicles Segment Expected to Grow at the Highest Rate Between 2025 and 2030 (By Value)
Figure 17 Ethernet is Projected to Have the Highest Market Share By 2030 (By Value)
Figure 18 BEV Segment is Expected to Grow at the Highest Rate During the Forecast Period (By Value)
Figure 19 64-Bit is Projected to Have the Highest Market Share By 2030 (By Value)
Figure 20 ECU Consolidation in Various Domains of Vehicles
Figure 21 Typical ECU Consolidation System Using A Hypervisor
Figure 22 Evolution of the Domain Centralization Architecture
Figure 23 ECU Consolidation and Resulting Implications
Figure 24 Multi Domain Controller Evolution
Figure 25 Multi Domain Controller: Market Dynamics
Figure 26 Evolution of Autonomous Vehicles
Figure 27 Complexity in Electronic Architecture in Modern Vehicles
Figure 28 Future In-Vehicle Network Architectures
Figure 29 Pictorial Representation of Types of Hypervisor Technologies
Figure 30 Market: Scenario Analysis
Figure 31 Market, By Application, 2018 vs 2030 (USD Million)
Figure 32 Market, By Vehicle Type, 2018/2025 vs 2030 (USD Million)
Figure 33 Market, By Propulsion Type, 2018 vs 2030 (USD Million)
Figure 34 Market, By Bus Systems, 2018 vs 2030 (USD Million)
Figure 35 Market, By Bit Size, 2018/2025 vs 2030 (USD Million)
Figure 36 Market, By Level of Autonomy, 2018/2025 vs 2030 (USD Million)
Figure 37 Market, By Region, 2018 vs 2030 (USD Million)
Figure 38 Asia Pacific: Market Snapshot
Figure 39 Europe: Market Snapshot
Figure 40 North America: Multi Domain Controllers, By Country, 2018/2025 vs 2030 (USD Million)
Figure 41 RoW: Market, By Country, 2018/2025 vs 2030 (USD Million)
Figure 42 Key Developments By Leading Players in the Market for 2015–2018
Figure 43 Continental Led the Market in 2017
Figure 44 Market (Global): Competitive Leadership Mapping, 2018
Figure 45 Company Snapshot: Continental AG
Figure 46 SWOT Analysis: Continental AG
Figure 47 Company Snapshot: Visteon Corporation
Figure 48 SWOT Analysis: Visteon Corporation
Figure 49 Company Snapshot: Robert Bosch GmbH
Figure 50 SWOT Analysis: Robert Bosch GmbH
Figure 51 Company Snapshot: Aptiv PLC
Figure 52 SWOT Analysis: Aptiv PLC
Figure 53 Company Snapshot: Panasonic Corporation
Figure 54 SWOT Analysis: Panasonic Corporation
Figure 55 Company Snapshot: ZF Friedrichshafen AG
Figure 56 Company Snapshot: Faurecia
Figure 57 Company Snapshot: Magna International Inc.
Figure 58 Company Snapshot: Lear Corporation
Figure 59 Company Snapshot: Autoliv Inc.
The study involves 4 main activities to estimate the current size of the multi domain controller market. Exhaustive secondary research was done to collect information on the market such as the use of multi domain controllers in various vehicle types and their benefits. The next step was to validate these findings, assumptions, and market analysis with industry experts across value chains through primary research. A top-down approach was employed to estimate the complete market size of different segments considered in this study.
Secondary Research
Secondary sources referred to for this research study on the multi domain controller market included organizations related to the automobile industry such as OICA; corporate filings such as annual reports, investor presentations, and financial statements; and trade, business, and automotive associations. The secondary data was collected and analyzed to arrive at the overall size of the market, which was further validated through primary research.
Primary Research
Extensive primary research was conducted after acquiring an understanding of the scenario of the multi domain controller market through secondary research. Several primary interviews were conducted with the market experts from both demand- side (OEM side) and supply-side (Tier 1, Tier 2, and Tier 3) across 4 major regions, namely, North America, Europe, Asia Pacific, and the Rest of the World (RoW). Primary data was collected through questionnaires, emails, and telephonic interviews. In our canvassing of primaries, we strived to cover various departments within organizations, which included sales, operations, and administration, to provide a holistic viewpoint of the multi domain controller market in our report.
After interacting with the industry participants, we conducted brief sessions with highly experienced independent consultants to reinforce the findings from our primaries. This, along with the opinions of the in-house subject-matter experts, led us to the findings as described in this report.
To know about the assumptions considered for the study, download the pdf brochure
Market Size Estimation
A top-down approach has been used to estimate and forecast the size of the multi domain controller market. The global market size of the market from supply-side has been derived by considering the revenue generated by all the industry players providing multi domain controllers for automotive, year-on-year (Y-O-Y) growth of the multi domain controller industry. The market size of multi domain controllers from demand-side has been derived by multiplying the global market with the penetration of the automotive industry applications based industry use cases, company developments, and primary insights. The market size and approach was further discussed with primary participants for correction and validation. Based on the primary insights and industry growth, we developed 3 scenarios (Optimistic, Pessimistic, and Most Likely) and the most validated scenario “Most Likely” has been considered to arrive at final market estimates. The global market is further segmented into regions by considering factors such as the regional development and R&D centers, the market size of the automotive industry (production), customer preference, increasing complexity in vehicle architecture, level of autonomy in vehicles, and primary insights. Further, the regional market, by country, has been derived by determining the penetration of multi domain controller in various vehicles (passenger cars, light commercial vehicles, and heavy commercial vehicles) for various countries through model mapping.
Data Triangulation
All percentage shares, splits, and breakdowns have been determined using secondary sources and verified by primary sources. All parameters that are said to affect the markets covered in this research study have been accounted for, viewed in extensive detail, and analyzed to obtain the final quantitative and qualitative data. This data has been consolidated, enhanced with detailed inputs and analysis from MarketsandMarkets, and presented in the report. The data was triangulated by studying various factors and trends from both, the demand and supply sides, in the multi domain controller market.
Report Objectives
- To define, segment, and forecast the multi domain controller market, in terms of volume and value, from 2018 to 2030
- To provide a detailed analysis of various factors such as drivers, restraints, opportunities, and challenges influencing the growth of the market
- To segment and forecast the size of the market based on vehicle type, application, propulsion type, bus system, bit size, level of autonomy, and region
- To forecast the size of the market for 4 regions, namely, Asia Pacific, Europe, North America, and the Rest of the World (RoW)
- To segment and forecast the size of the market, in terms of volume and value, based on vehicle type (Passenger Cars, Light Commercial Vehicles, and Heavy Commercial Vehicles)
- To segment and forecast the size of the market, in terms of volume and value, based on application (Body & Comfort, ADAS & Safety, Powertrain, and Cockpit Electronics)
- To segment and forecast the size of the market, in terms of volume and value, based on propulsion type (ICE Vehicles, Battery Electric Vehicles, and Hybrid Electric Vehicles)
- To segment and forecast the size of the market, in terms of value, based on bus system (CAN & CAN FD, LIN, FlexRay, and Ethernet)
- To segment and forecast the size of the market, in terms of volume and value, based on bit size (32-bit, 64-bit, and 128-bit)
- To segment and forecast the size of the market, in terms of volume and value, based on the level of autonomy (Autonomous Vehicles and Semi-Autonomous Vehicles)
- To analyze opportunities for stakeholders and details of a competitive landscape for market leaders
- To strategically profile key players and comprehensively analyze their respective market share and core competencies
Scope of the Report
|
Report Metric |
Details |
|
Market Size Available for Years |
2016–2030 |
|
Base Year Considered |
2017 |
|
Forecast Period |
2018–2030 |
|
Forecast Units |
Value (USD million) |
|
Segments Covered |
Application, Vehicle Type, Propulsion Type, Bus Systems, Bit Size, Level of Autonomy, and Region |
|
Geographies Covered |
Asia Pacific, Europe, North America, and the RoW |
|
Companies Covered |
Continental AG (Germany), Visteon Corporation (US), Robert Bosch (Germany), Aptiv (Ireland), and Panasonic Corporation (Japan) |
This research report categorizes the multi domain controller market on the basis of vehicle type, propulsion type, bus systems, bit size, level of autonomy, application, and region.
On the basis of Vehicle Type, the multi domain controller market has been segmented as follows:
- Passenger Cars
- Light Commercial Vehicles
- Heavy Commercial Vehicles
On the basis of Bus Systems, the multi domain controller market has been segmented as follows:
- CAN & CAN FD
- Ethernet
- FlexRay
- LIN
On the basis of Propulsion Type, the multi domain controller market has been segmented as follows:
- ICE Vehicles
- Battery Electric Vehicles (BEVs)
- Hybrid Electric Vehicles (HEVs)
On the basis of Bit Size, the multi domain controller market has been segmented as follows:
- 32-Bit
- 64-Bit
- 128-Bit
On the basis of Level of Autonomy, the multi domain controller market has been segmented as follows:
- Autonomous Vehicles
- Semi-Autonomous Vehicles
On the basis of Application, the multi domain controller market has been segmented as follows:
- ADAS & Safety
- Body & Comfort
- Cockpit Electronics
- Powertrain
On the basis of Region, the multi domain controller market has been segmented as follows:
- North America
- Europe
- Asia Pacific
- RoW
Available Customizations
With the given market data, MarketsandMarkets offers customizations in accordance with company-specific needs.
The following customization options are available for the report:
- Multi Domain Controller Market, By Propulsion Type, By Application
- Multi Domain Controller Market, By Bus Systems, By Volume


Growth opportunities and latent adjacency in Multi Domain Controller Market