Automotive Relay Market

Automotive Relay Market by Relay Type, Application, Ampere, Vehicle Type, Electric Vehicle Relay Market by Ampere, Electric Vehicle Relay Market by Relay Type, Electric Vehicle Relay Market by Vehicle Type, Region - Global Forecast to 2027

Report Code: AT 5382 Dec, 2022, by marketsandmarkets.com

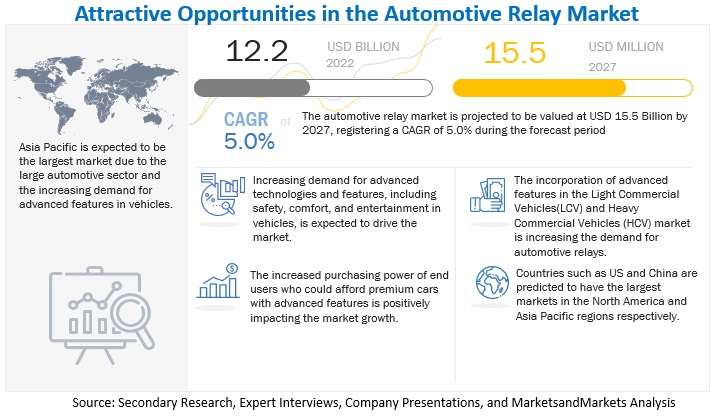
[289 Pages Report] The automotive relay market was valued at USD 12.2 billion in 2022 and is expected to reach USD 15.5 billion by 2027, at a CAGR of 5.0% during the forecast period 2022-2027. The base year for the report is 2021, and the forecast period is from 2022 to 2027. The market would witness growth owing to driving factors such as the increasing need for safer and more comfortable vehicles and increasing sales of electric and hybrid vehicles, raising the demand for high-voltage relays.
Automotive Relay Market

To know about the assumptions considered for the study, Request for Free Sample Report

Market Dynamics

DRIVER: Increasing need for safer and more comfortable vehicles

The demand for increased safety and comfort features in automobiles has greatly increased in recent years. This demand for better safety and comfort features has led automakers to offer advanced technologies and features. This has increased the usage of relays in such electronic systems. For instance, incorporating advanced driving assistance systems (ADAS) has also increased the number of electronic components in vehicles. In addition, electromechanical relays have been replaced with electronic relays that are compact and efficient.

The advancements in cloud mobility, deep learning, and artificial intelligence technologies have greatly contributed to the advanced processors in electronic vehicle systems. These processors are used to develop a 3D spatial model of a car’s environment and detect threat levels using relays to deliver outputs. GPS tracking system transmits signals to electronic devices indicating speed, time, and direction, thereby increasing the number of relays used. According to industry experts, with increasing electrification, the number of relays used per vehicle is around 30 to 40 for an economy ICE passenger vehicle and around 60 to 70 for an electric vehicle.

Furthermore, the increasing safety regulations around the globe demand a greater number of safety features to be mandatory in vehicles. In the United States, the Federal Motor Vehicle Safety Standards (FMVSS) and National Highway Traffic Safety Administration (NHTSA) are the governing bodies for vehicle safety. They have implemented safety regulations that incorporate various electronic systems in vehicles.

In 2019, the European Union adopted the General Safety Regulation (GSR) to reduce fatality and serious injuries during accidents. This included special safety requirements for buses and heavy commercial vehicles and mandated many safety systems apart from lane departure warning systems and emergency brake assistance systems. All these implications further increase the incorporation of relays in electronic safety systems, driving the market.

RESTRAINT: Lack of standardization in relay design

Automobiles have evolved with the advancing electronic systems in terms of safety, performance, comfort, and others. Automakers utilize various types of automotive relays in their applications. For instance, compact relays are miniature versions with high current carrying capacity. Arc-proof DC power relays are designed for electric cars to ensure high-voltage DC switching without producing any arc. With the advent of a greater variety of relays, the standardization of automotive relays remains a cause of concern. Generally, automotive relays can be categorized by terminal arrangements and different functions. This flexibility allows a relay to be designed according to its usability. Though this versatile and modular configuration is helpful for specific requirements, the automotive relay market has many different relays. Each OEMs follow different standards of relay specification, such as switching current, switching voltage, coil voltage/current, coil power, and others. This makes the automotive relay industry non-standard, and difficult for the relay manufacturers to mass produce a standard relay compatible with a greater number of vehicles. For instance, the automotive wiper is one of the essential components of a vehicle. It is a well-standardized market with universal products, where a particular size of wipers are compatible with a greater number of vehicle models from different OEMs.

Furthermore, the relays are also segmented by their types apart from the contact arrangement, load capacity, and others. For instance, there are three major automotive relays: PCB, Plug-in, and Combined. PCB relays are soldered on the PCB board. The plug-in relays generally have different sizes 2.8mm, 4.8mm, 6.3mm, and 9.5mm; the terminal layout is divided into ISO categories (micro-ISO, mini-ISO, power mini ISO) and 280 categories (ultra 280, micro 280, mini 280). Moreover, there are combined relays, PCB relays, and relay modules. Hence, different types of relays are combined, further increasing the choice of automotive relays. Also, the introduction of electric vehicles has increased the deployment of relays. Therefore, it has become difficult for relay manufacturers to develop a standard relay design. This lack of standardization can potentially hamper the growth of the automotive relay market.

OPPORTUNITY: Demand for higher switching capacity relays for electric, hybrid, and autonomous vehicles

The rising trend of electrification of the powertrain (BEV, PHEV, and HEV) in passenger cars and commercial vehicles has increased the demand for high-voltage DC relays for switching purposes. Various applications in electric vehicles (EV), such as battery management systems, HVAC, power steering pumps, and others, require an appropriate design for switching the relay on or off. Owing to the highly inductive nature of the load, a relay with high switching capacity, magnetic blowout, and sufficient spacing is required for various applications of electric vehicles.

In the case of electric vehicles, relays are used for main and pre-charging and DC charging interfaces. Panasonic has patented its EV relays segment and provides relays suitable for stringent conditions of short circuits and adaptive to higher system voltage. These relays have contacts enclosed in hermetically sealed ceramic capsule construction, and the contact chamber is filled with hydrogen gas owing to its better conductivity of heat than air. This helps in the quick and efficient dissipation of heat generated while arching, resulting in better switching performance. Other key manufacturers invest heavily in research and development to develop EV relays for high-switching applications. The sales of electric and hybrid vehicles have increased tremendously, and the electrification of these vehicles is influencing the demand for relays.

Moreover, concerning the rapidly growing electric vehicle market, the electric vehicle is being developed with higher battery and motor capacities to increase its performance and efficiency. For instance, the Tesla Roadster has a performance of 0-60 Mph in 1.9 seconds and is equipped with an enormous 200kWh battery pack. In 2019, the German carmaker Porche developed a new electric SUV with quad motor technology. These four motors were coupled to individual wheel hubs and were aimed to offer the maximum electric off-road capabilities. Such an increase in motors and battery capacities will demand a relay designed to operate with high switching capacities. The growth of the e-bike, electric moped, electric construction equipment markets, and others are also driving the growth of the automotive relays market. These new electric vehicle segments require relays for their operation.

For instance, according to MarketsandMarkets analysis, it is predicted that the e-bike market will grow at a CAGR of 10.2% from 2022 to 2027. Moreover, heavy electric equipment, including electric mining and construction equipment, is designed with high-performance motors and massive battery packs. Such applications would also demand relays with very high switching capacities. It is predicted that the electric construction equipment market will reach a value of USD 24.8 billion by 2027 at a CAGR of 22.0% during the forecast period, according to the MarketsandMarkets analysis. The growth of autonomous vehicles also demands a greater number of high-tech electronic systems. These electronic systems often require high-speed data and signal communications. A highly efficient relay is needed of uninterrupted signal transfers and precise switching of the applications. Therefore, the growth of autonomous vehicles, in turn, contributes to the growth of the automotive relay market.

CHALLENGE: Connected smart junction box and smart fuse box for autonomous cars

Though there are very limited direct alternatives to the automotive relays, Lear Corporation’s smart junction box (SJB) is one of them. This SJB integrates passive junction box features with electronic module functionality. The technology incorporates a microcontroller for switching the power and controlling the vehicle's functions. It utilizes integrating power and control functions into a single module. These SJBs also replace the relays and fuses with solid-state electronic drivers, improving the quality and reducing weight with less packaged size, up to 8%. This was an award-winning innovation by the company aimed to control and power the window door locks, interior and exterior lighting, and audio system. The other advantages of the SJBs were that they eliminated the need to access the fuse box and benefited customers with improved reliability. Automakers were impressed by its compactness and reduced packaged size and found it easier to manufacture.

Furthermore, in an electric vehicle, a relatively greater number of relays and fuses are needed than in an ICE vehicle, as it requires the transfer of charge from the battery to a group of loads. With the increasing use of 48V power for start-stop systems and other mild hybrid systems, it is difficult for the relays to switch between power requirements for heavy vehicles. A high-end vehicle can have up to 100 fuses and four fuse boxes that consume a larger amount of space. This also facilitates the incorporation of a smart junction box, which can eliminate most of the complications of relays. Though this is a relatively expensive option, one of the disadvantages of the SJBs, a few automakers find it as an alternative to switch power over fuses and relays, which can hamper the relay market growth.

Automotive Relay Market: Ecosystem Analysis
Automotive Relay Market Size, and Share

To know about the assumptions considered for the study, download the pdf brochure

Main Relays are expected to dominate the electric & hybrid vehicle relay market during the forecast period

Main relays are used to disconnect the battery ranges of 80–300A and incorporated in the Battery Discharge Unit (BDU) of electric vehicles. The main relay disconnects the electrical supply between battery and traction motor while turning off to ensure adequate vehicle safety. It is installed in both the positive and negative lines of the battery system. These BDUs demand these main relays for proper functioning and safe discharging. With a growing focus on longer-range cars and fast charging technology, the demand of cars installed with high-voltage batteries are expected in the year to come, which requires effective main relays to offer satisfactory performance while operating conditions for electric and hybrid vehicles. These factors would drive the market for main relays in the electric and hybrid vehicle segment

Battery Electric Vehicles (BEV) are expected to dominate the EV relay market over the forecast period

BEVs are predicted to have the largest market share in the electric vehicle relay market by EV type. As per MnM Analysis, global sales of electric & hybrid vehicles are expected to grow from 8,142 thousand units in 2022 to 38,983 thousand units by 2030, of which more than 70% share belongs to BEVs. The BEVs comprise the battery system, traction motor, and other power electronic modules. In addition, several auxiliary components include an AC compressor, headlight, tail lamp, interior lighting, electric power steering, and liquid heater PTC, among others. All these components are installed with electric circuits, and these circuits demand the installation of relays with different power ratings for their proper functioning. Further, rising demand for electric luxury vehicles, advanced features such as grille shutters, active and passive cabin ventilation, active seat ventilation, ADAS technologies, and some other advanced would require additional relays. In contribution towards the reduction of global Co2 emission level, automotive OEMs have planned to launch a medium to premium range of electric vehicles in the next 2-3 years, which will ultimately accelerate the demand for relays installed in these vehicles for advanced safety and comfort applications.
Automotive Relay Market Size, and Share

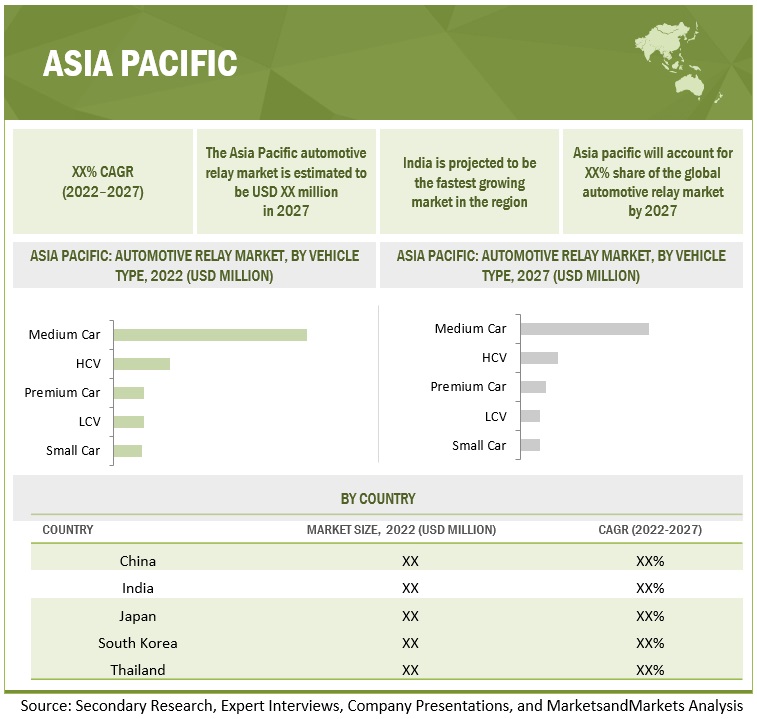
Asia Pacific is projected to dominate the Automotive Relay market by 2027

The Asia Pacific region holds the largest market share in the automotive relay market. China accounts for the largest share owing to shifting consumer preferences, increasing per capita income of the middle-class population, and cost advantages that have led OEMs to increase vehicle production in the region. Thus, strong demand has been noticed in China, India, and Japan, accelerating the market growth. In 2021, the demand for economy and mid-range cars was highest, with more than 90% of the share in total passenger car production. The demand for entry-level and medium-price range cars is growing in countries such as India, China and Thailand due to more product launches with advanced features in this segment at a competitive price bracket. Further, increased demand for luxury cars with superior safety and cabin comfort installed with some high-end technologies such as adaptive cruise control, intelligent park assist, advanced braking, automatic multi-climate air conditioning etc., would spur the demand for automotive relays market in the region

Key Market Players & Start-ups

The automotive relay market is led by globally established players such as TE Connectivity (Switzerland), Omron Corporation (Japan), Panasonic Corporation (Japan), Hongfa Technologies Co. (China), and Fujitsu Component Limited (Japan). These companies adopted expansion strategies and undertook collaborations, partnerships, and mergers & acquisitions to gain traction in the high-growth market.

Get online access to the report on the World's First Market Intelligence Cloud

  • Easy to Download Historical Data & Forecast Numbers
  • Company Analysis Dashboard for high growth potential opportunities
  • Research Analyst Access for customization & queries
  • Competitor Analysis with Interactive dashboard
  • Latest News, Updates & Trend analysis
Request Sample

Scope of the Report

Report Metrics

Details

Base year for estimation 2021
Forecast period 2022 - 2027
Market Growth and Revenue forecast $ 15.5 billion by 2027, at a CAGR of 5.0%
Top Players TE Connectivity (Switzerland), Omron Corporation (Japan), Panasonic Corporation (Japan), Hongfa Technologies Co. (China), Fujitsu Component Limited (Japan).
Fastest Growing Market Asia Pacific
Largest Market Asia Pacific
Segments covered
By Relay Type PCB Relays, Plug In Relays, High Voltage Relays, Protective Relays, Signal Relays, Time Relays
By Application Door Lock, Power Windows, Sunroof, Power Seat, Electronic Power Steering (EPS), Lighting, Fuel Injection, Air Conditioner, Starter, Anti-Lock Braking System (ABS), Traction Control System (TCS), Cooling Fan, Engine Management Module, Adaptive Cruise Control, Intelligent Park Assist
By Ampere 5A-15A, 16A-35A, >35A
By Vehicle Type Economy cars, Mid-range cars, Premium cars, Light Commercial Vehicle, Heavy Duty Vehicles
Electric Vehicle Relay Market, By Ampere 5A-15A, 16A-35A, >35A
Electric Vehicle Relay Market, By Relay Type Main Relay, Precharge Relay, QuickCharge Relay, Normal Charge Relay, High Voltage Accessories Relay
Electric Vehicle Relay Market, By Vehicle Type Battery Electric Vehicle, Fuel Cell Electric Vehicle, Plug In Hybrid Electric Vehicle
By Region Asia Pacific, Europe, North America, And Rest of The World
Additional Customization to be offered Automotive Relay Market, By Application And Vehicle Type

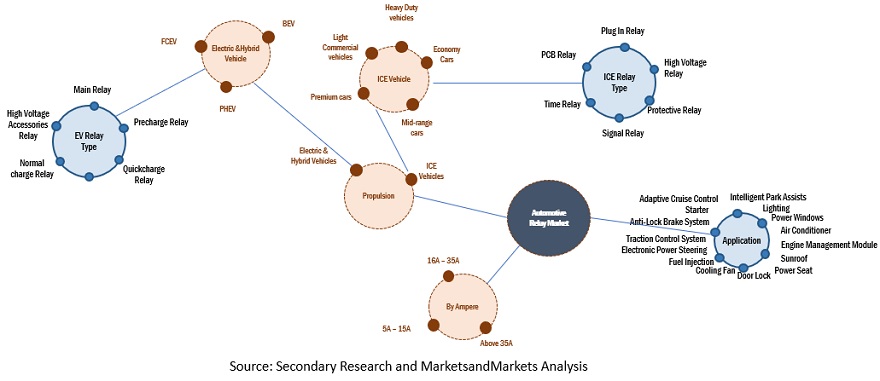
The study categorizes the automotive relay market based on relay type, application, ampere, vehicle type, electric vehicle relay market by relay type, electric vehicle relay market by ampere. electric vehicle relay market by vehicle type, and region at regional and global levels.

By Relay Type
  • PCB Relays
  • Plug In Relays
  • High Voltage Relays
  • Protective Relays
  • Signal Relays
  • Time Relays
By Application
  • Door Lock
  • Power Windows
  • Sunroof
  • Power Seat
  • Electronic Power Steering (EPS)
  • Lighting
  • Fuel Injection
  • Air Conditioner
  • Starter
  • Anti-Lock Braking System (ABS)
  • Traction Control System (TCS)
  • Cooling Fan
  • Engine Management Module
  • Adaptive Cruise Control
  • Intelligent Park Assist)
By Ampere
  • 5A-15A
  • 16A-35A
  • >35A
By Vehicle Type
  • Economy cars,
  • Mid-range cars,
  • Premium cars,
  • Light Commercial Vehicle,
  • Heavy Duty Vehicles
Electric Vehicle Relay Market, By Ampere
  • 5A-15A
  • 16A-35A
  • >35A
Electric Vehicle Relay Market, By Vehicle Type
  • Battery Electric Vehicle
  • Fuel Cell Electric Vehicle
  • Plug In Hybrid Electric Vehicle
Electric Vehicle Relay Market, By Relay Type
  • Main Relay,
  • Precharge Relay,
  • QuickCharge Relay,
  • Normal Charge Relay,
  • High Voltage Accessories Relay
Electric Vehicle Relay Market, By Vehicle Type
  • Battery Electric Vehicle
  • Fuel Cell Electric Vehicle
  • Plug In Hybrid Electric Vehicle
By Region
  • Asia Pacific,
  • Europe,
  • North America, and
  • Rest of The World

Recent Developments

  • In June 2022, Hongfa Technology Co. developed two new automotive relays in response to the market demand for miniature, lightweight, and energy-saving ones—a micro relay HFV26 and a mini relay HFV15A. These products are designed to be incorporated into various applications, including defogging control of the rear window, battery short circuit device control, HVAC, and others.
  • In June 2022, Hongfa Technology Co. has developed its new On-Board Charger (OBC) relays for the rapidly growing energy vehicle market. These relays are claimed to provide more efficiency and safety for onboard chargers. OBC relays are designed with maximum current capacities of 20A and 32A and a temperature range of up to 105° C.
  • In November 2020, Fujitsu Component Limited expanded its product portfolio by introducing the 12-colt DC PCB relay, FBR53-HC. It features a 1 Form U dual contact arrangement for increased reliability. This relay can be incorporated into electric power steering, radiator fans, fuel pumps, seat heaters, headlamps, and motor braking circuits.
  • In January 2020, Fujitsu Component Limited introduced its new PCB relay, FTR-K5. It is the second of the company’s EV and plug-in hybrid vehicle components. This relay 8YH is designed for the e-mobility market and provides a range of 6.6 kW at 250 volt AC, with faster charging time.

Frequently Asked Questions (FAQ):

To speak to our analyst for a discussion on the above findings, click Speak to Analyst

TABLE OF CONTENTS
 
1 INTRODUCTION (Page No. - 42)
    1.1 STUDY OBJECTIVES 
    1.2 MARKET DEFINITION 
           1.2.1 INCLUSIONS & EXCLUSIONS
    1.3 MARKET SCOPE 
           FIGURE 1 AUTOMOTIVE RELAY MARKET SEGMENTATION
           1.3.1 YEARS CONSIDERED
           1.3.2 REGIONAL SCOPE
                    FIGURE 2 MARKET, BY REGION
    1.4 CURRENCY CONSIDERED 
           TABLE 1 CURRENCY EXCHANGE RATES (WRT PER USD)
    1.5 UNITS CONSIDERED 
    1.6 LIMITATIONS 
    1.7 STAKEHOLDERS 
    1.8 SUMMARY OF CHANGES 
 
2 RESEARCH METHODOLOGY (Page No. - 48)
    2.1 RESEARCH DATA 
           FIGURE 3 RESEARCH DESIGN
           FIGURE 4 RESEARCH METHODOLOGY MODEL
           2.1.1 SECONDARY DATA
                    2.1.1.1 List of key secondary sources
                    2.1.1.2 Key data from secondary sources
           2.1.2 PRIMARY DATA
                    FIGURE 5 BREAKDOWN OF PRIMARY INTERVIEWS
                    2.1.2.1 Sampling techniques and data collection methods
    2.2 MARKET ESTIMATION METHODOLOGY 
           FIGURE 6 RESEARCH METHODOLOGY: HYPOTHESIS BUILDING
           2.2.1 BOTTOM-UP APPROACH
                    FIGURE 7 BOTTOM-UP APPROACH: AUTOMOTIVE RELAY MARKET, BY VEHICLE TYPE
           2.2.2 TOP-DOWN APPROACH
                    FIGURE 8 TOP-DOWN APPROACH: MARKET, BY AMPERE AND RELAY TYPE
                    FIGURE 9 MARKET: REGIONAL ANALYSIS AND ESTIMATION FINDINGS
    2.3 MARKET BREAKDOWN AND DATA TRIANGULATION 
           FIGURE 10 DATA TRIANGULATION
    2.4 FACTOR ANALYSIS 
           2.4.1 FACTOR ANALYSIS FOR MARKET SIZING: DEMAND- AND SUPPLY-SIDE
    2.5 ASSUMPTIONS 
    2.6 RESEARCH LIMITATIONS 
 
3 EXECUTIVE SUMMARY (Page No. - 62)
    FIGURE 11 AUTOMOTIVE RELAY MARKET OUTLOOK 
    FIGURE 12 MARKET, BY REGION, 2022 VS. 2027 (USD MILLION) 
 
4 PREMIUM INSIGHTS (Page No. - 65)
    4.1 ATTRACTIVE OPPORTUNITIES FOR PLAYERS IN MARKET 
           FIGURE 13 INCREASED DEMAND FOR ADVANCED FEATURES IN VEHICLES PROPELS MARKET
    4.2 MARKET, BY RELAY TYPE 
           FIGURE 14 PCB RELAYS TO ACCOUNT FOR LARGER MARKET SHARE BY 2027
    4.3 MARKET, BY AMPERE 
           FIGURE 15 >35A RELAYS TO DOMINATE MARKET, BY VALUE
    4.4 MARKET, BY APPLICATION 
           FIGURE 16 COOLING FANS TO ACQUIRE LARGEST MARKET SHARE, BY VALUE
    4.5 MARKET, BY VEHICLE TYPE 
           FIGURE 17 MID-RANGE CARS TO COMMAND MARKET DURING FORECAST PERIOD
    4.6 ELECTRIC VEHICLE RELAY MARKET, BY VEHICLE TYPE 
           FIGURE 18 BEVS ESTIMATED TO ACCOUNT FOR LARGEST SHARE IN 2022
    4.7 ELECTRIC VEHICLE RELAY MARKET, BY RELAY TYPE 
           FIGURE 19 MAIN RELAYS TO HOLD LARGEST MARKET SHARE BY 2027
    4.8 ELECTRIC VEHICLE RELAY MARKET, BY AMPERE 
           FIGURE 20 >35A TO ACQUIRE MAXIMUM MARKET SHARE DURING FORECAST PERIOD
    4.9 MARKET, BY REGION 
           FIGURE 21 ASIA PACIFIC ESTIMATED TO DOMINATE MARKET IN 2022
 
5 MARKET OVERVIEW (Page No. - 71)
    5.1 INTRODUCTION 
    5.2 MARKET DYNAMICS 
           FIGURE 22 AUTOMOTIVE RELAY MARKET DYNAMICS
           5.2.1 DRIVERS
                    5.2.1.1 Need for safer and more comfortable vehicles
                               FIGURE 23 VEHICLE ELECTRIFICATION MARKET, BY PRODUCT, 2017–2021 (MILLION UNITS)
                    5.2.1.2 Increased sales of electric and hybrid vehicles
                               FIGURE 24 ELECTRIC VEHICLE SALES, BY TYPE, 2021 VS. 2030 (THOUSAND UNITS)
           5.2.2 RESTRAINTS
                    5.2.2.1 Lack of standardization in relay designs
           5.2.3 OPPORTUNITIES
                    5.2.3.1 Demand for high switching capacity relays in electric, hybrid, and autonomous vehicles
                    5.2.3.2 Increased use of DC motors in automotive applications
                               FIGURE 25 AUTOMOTIVE DC MOTORS SHARE, BY APPLICATION, 2020
                    5.2.3.3 Relay failure prevention systems
           5.2.4 CHALLENGES
                    5.2.4.1 Factors affecting reliability of relays
                               FIGURE 26 PERFORMANCE AND DESIGN TECHNOLOGICAL FACTORS OF AUTOMOTIVE RELAYS
                    5.2.4.2 Connected smart junction box and smart fuse box for autonomous cars
    5.3 PORTER’S FIVE FORCES ANALYSIS 
           TABLE 2 PORTER’S FIVE FORCES ANALYSIS
           FIGURE 27 PORTER’S FIVE FORCES FOR AUTOMOTIVE RELAY MARKET
           5.3.1 THREAT OF SUBSTITUTES
           5.3.2 THREAT OF NEW ENTRANTS
           5.3.3 BARGAINING POWER OF BUYERS
           5.3.4 BARGAINING POWER OF SUPPLIERS
           5.3.5 INTENSITY OF COMPETITIVE RIVALRY
    5.4 TRENDS AFFECTING AUTOMOTIVE RELAY MANUFACTURERS 
           FIGURE 28 TRENDS AFFECTING AUTOMOTIVE RELAY MANUFACTURERS
    5.5 MARKET SCENARIOS (2018–2027) 
           FIGURE 29 MARKET SCENARIO, 2018–2027 (USD MILLION)
           5.5.1 MARKET: REALISTIC SCENARIO
                    TABLE 3 MARKET (REALISTIC), BY REGION, 2018–2021 (USD MILLION)
                    TABLE 4 MARKET (REALISTIC), BY REGION, 2022–2027 (USD MILLION)
           5.5.2 MARKET: OPTIMISTIC SCENARIO
                    TABLE 5 MARKET (OPTIMISTIC), BY REGION, 2018–2021 (USD MILLION)
                    TABLE 6 MARKET (OPTIMISTIC), BY REGION, 2022–2027 (USD MILLION)
           5.5.3 MARKET: PESSIMISTIC SCENARIO
                    TABLE 7 MARKET (PESSIMISTIC), BY REGION, 2018–2021 (USD MILLION)
                    TABLE 8 MARKET (PESSIMISTIC), BY REGION, 2022–2027 (USD MILLION)
    5.6 AVERAGE SELLING PRICING (ASP) ANALYSIS 
           5.6.1 BY REGION & AMPERE
                    TABLE 9 MARKET: AVERAGE SELLING PRICE, BY REGION & AMPERE, 2021–2022 (USD/UNIT)
           5.6.2 KEY POINTS
    5.7 TECHNOLOGY ANALYSIS 
           5.7.1 OVERVIEW
           5.7.2 GROWTH OF ELECTRIC AND HYBRID VEHICLES
           5.7.3 ADVANCED SAFETY TECHNOLOGIES IN MODERN AUTOMOBILES
           5.7.4 AUTONOMOUS CONSTRUCTION EQUIPMENT
    5.8 CASE STUDY 
           5.8.1 USE CASE 1: EMBITEL INCORPORATES RELAYS IN ITS ELECTRIC MOTORCYCLE DASHBOARD HARDWARE
           5.8.2 USE CASE 2: TOMTOM ADVANCED DRIVER-ASSISTANCE SYSTEMS MAPS
    5.9 MARKET ECOSYSTEM 
           FIGURE 30 MARKET: ECOSYSTEM
           TABLE 10 ROLE OF COMPANIES IN MARKET ECOSYSTEM
    5.10 SUPPLY CHAIN ANALYSIS 
           FIGURE 31 MARKET: SUPPLY CHAIN ANALYSIS
    5.11 PATENT ANALYSIS 
    5.12 REGULATORY FRAMEWORK 
           5.12.1 REGULATORY BODIES, GOVERNMENT AGENCIES, AND OTHER ORGANIZATIONS
                    TABLE 11 NORTH AMERICA: REGULATORY BODIES, GOVERNMENT AGENCIES, AND OTHER ORGANIZATIONS
                    TABLE 12 EUROPE: REGULATORY BODIES, GOVERNMENT AGENCIES, AND OTHER ORGANIZATIONS
                    TABLE 13 ASIA PACIFIC: REGULATORY BODIES, GOVERNMENT AGENCIES, AND OTHER ORGANIZATIONS
           5.12.2 REGULATORY ANALYSIS
                    5.12.2.1 Automotive relay market: Quality standards
                               TABLE 14 REGULATIONS/STANDARDS FOR AUTOMOTIVE RELAYS
    5.13 KEY CONFERENCES AND EVENTS IN 2022–2023 
    5.14 KEY STAKEHOLDERS AND BUYING CRITERIA 
           5.14.1 KEY STAKEHOLDERS IN BUYING PROCESS
                    TABLE 15 INFLUENCE OF STAKEHOLDERS ON BUYING PROCESS (%)
                    FIGURE 32 INFLUENCE OF STAKEHOLDERS ON BUYING PROCESS
           5.14.2 BUYING CRITERIA
                    FIGURE 33 KEY BUYING CRITERIA FOR TOP AUTOMOTIVE RELAY APPLICATIONS
                    TABLE 16 KEY BUYING CRITERIA FOR TOP AUTOMOTIVE RELAY APPLICATIONS
 
6 AUTOMOTIVE RELAY MARKET, BY RELAY TYPE (Page No. - 99)
    6.1 INTRODUCTION 
           6.1.1 RESEARCH METHODOLOGY
           6.1.2 ASSUMPTIONS
           6.1.3 PRIMARY INSIGHTS
                    FIGURE 34 MARKET, BY RELAY TYPE, 2022 VS. 2027
                    TABLE 17 MARKET, BY RELAY TYPE, 2018–2021 (MILLION UNITS)
                    TABLE 18 MARKET, BY RELAY TYPE, 2022–2027 (MILLION UNITS)
                    TABLE 19 MARKET, BY RELAY TYPE, 2018–2021 (USD MILLION)
                    TABLE 20 MARKET, BY RELAY TYPE, 2022–2027 (USD MILLION)
    6.2 PRINTED CIRCUIT BOARD (PCB) RELAYS 
           6.2.1 COMPACT SIZE, HIGHER RATING, AND SMALLER PACKAGE
                    TABLE 21 PCB RELAYS: MARKET, BY REGION, 2018–2021 (MILLION UNITS)
                    TABLE 22 PCB RELAYS: MARKET, BY REGION, 2022–2027 (MILLION UNITS)
                    TABLE 23 PCB RELAYS: MARKET, BY REGION, 2018–2021 (USD MILLION)
                    TABLE 24 PCB RELAYS: MARKET, BY REGION, 2022–2027 (USD MILLION)
    6.3 PLUG-IN RELAYS 
           6.3.1 ABILITY TO WITHSTAND HARSH OPERATING CONDITIONS
                    TABLE 25 PLUG-IN RELAYS: MARKET, BY REGION, 2018–2021 (MILLION UNITS)
                    TABLE 26 PLUG-IN RELAYS: MARKET, BY REGION, 2022–2027 (MILLION UNITS)
                    TABLE 27 PLUG-IN RELAYS: MARKET, BY REGION, 2018–2021 (USD MILLION)
                    TABLE 28 PLUG-IN RELAYS: MARKET, BY REGION, 2022–2027 (USD MILLION)
    6.4 HIGH VOLTAGE RELAYS 
           6.4.1 INCORPORATION IN ELECTRIC VEHICLES
                    TABLE 29 HIGH VOLTAGE RELAYS: MARKET, BY REGION, 2018–2021 (MILLION UNITS)
                    TABLE 30 HIGH VOLTAGE RELAYS: MARKET, BY REGION, 2022–2027 (MILLION UNITS)
                    TABLE 31 HIGH VOLTAGE RELAYS: MARKET, BY REGION, 2018–2021 (USD MILLION)
                    TABLE 32 HIGH VOLTAGE RELAYS: MARKET, BY REGION, 2022–2027 (USD MILLION)
    6.5 PROTECTIVE RELAYS 
           6.5.1 ABILITY TO PROTECT CRITICAL COMPONENTS FROM HIGH VOLTAGE
                    TABLE 33 PROTECTIVE RELAYS: MARKET, BY REGION, 2018–2021 (MILLION UNITS)
                    TABLE 34 PROTECTIVE RELAYS: MARKET, BY REGION, 2022–2027 (MILLION UNITS)
                    TABLE 35 PROTECTIVE RELAYS: MARKET, BY REGION, 2018–2021 (USD MILLION)
                    TABLE 36 PROTECTIVE RELAYS: MARKET, BY REGION, 2022–2027 (USD MILLION)
    6.6 SIGNAL RELAYS 
           6.6.1 ABILITY TO SWITCH LOW-LEVEL CURRENTS EFFECTIVELY
                    TABLE 37 SIGNAL RELAYS: MARKET, BY REGION, 2018–2021 (MILLION UNITS)
                    TABLE 38 SIGNAL RELAYS: MARKET, BY REGION, 2022–2027 (MILLION UNITS)
                    TABLE 39 SIGNAL RELAYS: MARKET, BY REGION, 2018–2021 (USD MILLION)
                    TABLE 40 SIGNAL RELAYS: MARKET, BY REGION, 2022–2027 (USD MILLION)
    6.7 TIME RELAYS 
           6.7.1 TIMED SWITCHING APPLICATIONS
                    TABLE 41 TIME RELAYS: AUTOMOTIVE RELAYS MARKET, BY REGION, 2018–2021 (MILLION UNITS)
                    TABLE 42 TIME RELAYS: AUTOMOTIVE RELAYS MARKET, BY REGION, 2022–2027 (MILLION UNITS)
                    TABLE 43 TIME RELAYS: AUTOMOTIVE RELAYS MARKET, BY REGION, 2018–2021 (USD MILLION)
                    TABLE 44 TIME RELAYS: AUTOMOTIVE RELAYS MARKET, BY REGION, 2022–2027 (USD MILLION)
 
7 AUTOMOTIVE RELAY MARKET, BY APPLICATION (Page No. - 112)
    7.1 INTRODUCTION 
           7.1.1 RESEARCH METHODOLOGY
           7.1.2 ASSUMPTIONS
           7.1.3 PRIMARY INSIGHTS
                    FIGURE 35 MARKET, BY APPLICATION, 2022 VS. 2027
                    TABLE 45 MARKET, BY APPLICATION, 2018–2021 (MILLION UNITS)
                    TABLE 46 MARKET, BY APPLICATION, 2022–2027 (MILLION UNITS)
                    TABLE 47 MARKET, BY APPLICATION, 2018–2021 (USD MILLION)
                    TABLE 48 MARKET, BY APPLICATION, 2022–2027 (USD MILLION)
    7.2 DOOR LOCKS 
           7.2.1 NEED FOR SAFETY FEATURES
                    TABLE 49 DOOR LOCKS: MARKET, BY REGION, 2018–2021 (MILLION UNITS)
                    TABLE 50 DOOR LOCKS: MARKET, BY REGION, 2022–2027 (MILLION UNITS)
                    TABLE 51 DOOR LOCKS: MARKET, BY REGION, 2018–2021 (USD MILLION)
                    TABLE 52 DOOR LOCKS: MARKET, BY REGION, 2022–2027 (USD MILLION)
    7.3 POWER WINDOWS 
           7.3.1 INCORPORATION OF POWER WINDOWS IN ECONOMY AND COMMERCIAL VEHICLES
                    TABLE 53 POWER WINDOWS: MARKET, BY REGION, 2018–2021 (MILLION UNITS)
                    TABLE 54 POWER WINDOWS: MARKET, BY REGION, 2022–2027 (MILLION UNITS)
                    TABLE 55 POWER WINDOWS: MARKET, BY REGION, 2018–2021 (USD MILLION)
                    TABLE 56 POWER WINDOWS: MARKET, BY REGION, 2022–2027 (USD MILLION)
    7.4 SUNROOFS 
           7.4.1 GROWING INSTALLATION OF SUNROOFS
                    TABLE 57 SUNROOFS: MARKET, BY REGION, 2018–2021 (MILLION UNITS)
                    TABLE 58 SUNROOFS: MARKET, BY REGION, 2022–2027 (MILLION UNITS)
                    TABLE 59 SUNROOFS: MARKET, BY REGION, 2018–2021 (USD MILLION)
                    TABLE 60 SUNROOFS: MARKET, BY REGION, 2022–2027 (USD MILLION)
    7.5 POWER SEATS 
           7.5.1 HIGH DEMAND FROM MID-RANGE CARS SEGMENT
                    TABLE 61 POWER SEATS: MARKET, BY REGION, 2018–2021 (MILLION UNITS)
                    TABLE 62 POWER SEATS: MARKET, BY REGION, 2022–2027 (MILLION UNITS)
                    TABLE 63 POWER SEATS: MARKET, BY REGION, 2018–2021 (USD MILLION)
                    TABLE 64 POWER SEATS: MARKET, BY REGION, 2022–2027 (USD MILLION)
    7.6 ELECTRONIC POWER STEERING 
           7.6.1 GROWING INSTALLATION IN PASSENGER AND LIGHT COMMERCIAL VEHICLES
                    TABLE 65 ELECTRONIC POWER STEERING: MARKET, BY REGION, 2018–2021 (MILLION UNITS)
                    TABLE 66 ELECTRONIC POWER STEERING: MARKET, BY REGION, 2022–2027 (MILLION UNITS)
                    TABLE 67 ELECTRONIC POWER STEERING: MARKET, BY REGION, 2018–2021 (USD MILLION)
                    TABLE 68 ELECTRONIC POWER STEERING: MARKET, BY REGION, 2022–2027 (USD MILLION)
    7.7 LIGHTING 
           7.7.1 INCREASED APPLICATIONS OF AUTOMOTIVE LIGHTING
                    TABLE 69 LIGHTING: MARKET, BY REGION, 2018–2021 (MILLION UNITS)
                    TABLE 70 LIGHTING: MARKET, BY REGION, 2022–2027 (MILLION UNITS)
                    TABLE 71 LIGHTING: MARKET, BY REGION, 2018–2021 (USD MILLION)
                    TABLE 72 LIGHTING: MARKET, BY REGION, 2022–2027 (USD MILLION)
    7.8 FUEL INJECTION 
           7.8.1 NEED FOR INCREASED FUEL EFFICIENCY AND PERFORMANCE
                    TABLE 73 FUEL INJECTION: MARKET, BY REGION, 2018–2021 (MILLION UNITS)
                    TABLE 74 FUEL INJECTION: MARKET, BY REGION, 2022–2027 (MILLION UNITS)
                    TABLE 75 FUEL INJECTION: MARKET, BY REGION, 2018–2021 (USD MILLION)
                    TABLE 76 FUEL INJECTION: MARKET, BY REGION, 2022–2027 (USD MILLION)
    7.9 AIR CONDITIONERS 
           7.9.1 RISING DEPLOYMENT OF AUTOMATIC CLIMATE CONTROL
                    TABLE 77 AIR CONDITIONERS: MARKET, BY REGION, 2018–2021 (MILLION UNITS)
                    TABLE 78 AIR CONDITIONERS: MARKET, BY REGION, 2022–2027 (MILLION UNITS)
                    TABLE 79 AIR CONDITIONERS: MARKET, BY REGION, 2018–2021 (USD MILLION)
                    TABLE 80 AIR CONDITIONERS: MARKET, BY REGION, 2022–2027 (USD MILLION)
    7.10 STARTERS 
           7.10.1 INCREASED ADOPTION OF ENGINE PUSH BUTTON SYSTEMS
                    TABLE 81 STARTERS: MARKET, BY REGION, 2018–2021 (MILLION UNITS)
                    TABLE 82 STARTERS: MARKET, BY REGION, 2022–2027 (MILLION UNITS)
                    TABLE 83 STARTERS: MARKET, BY REGION, 2018–2021 (USD MILLION)
                    TABLE 84 STARTERS: MARKET, BY REGION, 2022–2027 (USD MILLION)
    7.11 ANTI-LOCK BRAKING SYSTEMS 
           7.11.1 STRINGENT REGULATIONS WORLDWIDE
                    TABLE 85 ANTI-LOCK BRAKING SYSTEMS: MARKET, BY REGION, 2018–2021 (MILLION UNITS)
                    TABLE 86 ANTI-LOCK BRAKING SYSTEMS: MARKET, BY REGION, 2022–2027 (MILLION UNITS)
                    TABLE 87 ANTI-LOCK BRAKING SYSTEMS: MARKET, BY REGION, 2018–2021 (USD MILLION)
                    TABLE 88 ANTI-LOCK BRAKING SYSTEM: MARKET, BY REGION, 2022–2027 (USD MILLION)
    7.12 TRACTION CONTROL SYSTEMS 
           7.12.1 BETTER TRACTION CONTROL AND LIMITED WHEEL SLIPPAGE
                    TABLE 89 TRACTION CONTROL SYSTEMS: MARKET, BY REGION, 2018–2021 (MILLION UNITS)
                    TABLE 90 TRACTION CONTROL SYSTEM: MARKET, BY REGION, 2022–2027 (MILLION UNITS)
                    TABLE 91 TRACTION CONTROL SYSTEMS: MARKET, BY REGION, 2018–2021 (USD MILLION)
                    TABLE 92 TRACTION CONTROL SYSTEMS: MARKET, BY REGION, 2022–2027 (USD MILLION)
    7.13 COOLING FANS 
           7.13.1 RISING ADOPTION OF AIR CONDITIONING SYSTEMS
                    TABLE 93 COOLING FANS: MARKET, BY REGION, 2018–2021 (MILLION UNITS)
                    TABLE 94 COOLING FANS: MARKET, BY REGION, 2022–2027 (MILLION UNITS)
                    TABLE 95 COOLING FANS: MARKET, BY REGION, 2018–2021 (USD MILLION)
                    TABLE 96 COOLING FANS: MARKET, BY REGION, 2022–2027 (USD MILLION)
    7.14 ENGINE MANAGEMENT MODULE 
           7.14.1 INCREASE IN COMPACT AND POWERFUL ENGINES
                    TABLE 97 ENGINE MANAGEMENT MODULE: MARKET, BY REGION, 2018–2021 (MILLION UNITS)
                    TABLE 98 ENGINE MANAGEMENT MODULE: MARKET, BY REGION, 2022–2027 (MILLION UNITS)
                    TABLE 99 ENGINE MANAGEMENT MODULE: MARKET, BY REGION, 2018–2021 (USD MILLION)
                    TABLE 100 ENGINE MANAGEMENT MODULE: MARKET, BY REGION, 2022–2027 (USD MILLION)
    7.15 ADAPTIVE CRUISE CONTROL 
           7.15.1 RAPIDLY DEVELOPING ROAD INFRASTRUCTURE IN DEVELOPING COUNTRIES
                    TABLE 101 ADAPTIVE CRUISE CONTROL: MARKET, BY REGION, 2018–2021 (MILLION UNITS)
                    TABLE 102 ADAPTIVE CRUISE CONTROL: MARKET, BY REGION, 2022–2027 (MILLION UNITS)
                    TABLE 103 ADAPTIVE CRUISE CONTROL: MARKET, BY REGION, 2018–2021 (USD MILLION)
                    TABLE 104 ADAPTIVE CRUISE CONTROL: MARKET, BY REGION, 2022–2027 (USD MILLION)
    7.16 INTELLIGENT PARK ASSIST 
           7.16.1 INCLUSION OF CONVENIENCE FEATURES IN LUXURY VEHICLES
                    TABLE 105 INTELLIGENT PARK ASSIST: MARKET, BY REGION, 2018–2021 (MILLION UNITS)
                    TABLE 106 INTELLIGENT PARK ASSIST: MARKET, BY REGION, 2022–2027 (MILLION UNITS)
                    TABLE 107 INTELLIGENT PARK ASSIST: MARKET, BY REGION, 2018–2021 (USD MILLION)
                    TABLE 108 INTELLIGENT PARK ASSIST: MARKET, BY REGION, 2022–2027 (USD MILLION)
 
8 AUTOMOTIVE RELAY MARKET, BY AMPERE (Page No. - 141)
    8.1 INTRODUCTION 
           8.1.1 RESEARCH METHODOLOGY
           8.1.2 ASSUMPTIONS
           8.1.3 PRIMARY INSIGHTS
                    FIGURE 36 MARKET, BY AMPERE, 2022 VS. 2027
                    TABLE 109 MARKET, BY AMPERE, 2018–2021 (MILLION UNITS)
                    TABLE 110 MARKET, BY AMPERE, 2022–2027 (MILLION UNITS)
                    TABLE 111 MARKET, BY AMPERE, 2018–2021 (USD MILLION)
                    TABLE 112 MARKET, BY AMPERE, 2022–2027 (USD MILLION)
    8.2 5A–15A RELAY 
           8.2.1 USE IN LIGHTING APPLICATIONS
                    TABLE 113 5A–15A: MARKET, BY REGION, 2018–2021 (MILLION UNITS)
                    TABLE 114 5A–15A: MARKET, BY REGION, 2022–2027 (MILLION UNITS)
                    TABLE 115 5A–15A: MARKET, BY REGION, 2018–2021 (USD MILLION)
                    TABLE 116 5A–15A: MARKET, BY REGION, 2022–2027 (USD MILLION)
    8.3 16A–35A RELAY 
           8.3.1 USE IN COMFORT FEATURES
                    TABLE 117 16A–35A: MARKET, BY REGION, 2018–2021 (MILLION UNITS)
                    TABLE 118 16A–35A: MARKET, BY REGION, 2022–2027 (MILLION UNITS)
                    TABLE 119 16A–35A: MARKET, BY REGION, 2018–2021 (USD MILLION)
                    TABLE 120 16A–35A: MARKET, BY REGION, 2022–2027 (USD MILLION)
    8.4 >35A RELAY 
           8.4.1 INCORPORATION OF ADVANCED SAFETY SYSTEMS IN VEHICLES
                    TABLE 121 >35A: MARKET, BY REGION, 2018–2021 (MILLION UNITS)
                    TABLE 122 >35A: MARKET, BY REGION, 2022–2027 (MILLION UNITS)
                    TABLE 123 >35A: MARKET, BY REGION, 2018–2021 (USD MILLION)
                    TABLE 124 >35A: MARKET, BY REGION, 2022–2027 (USD MILLION)
 
9 AUTOMOTIVE RELAY MARKET, BY VEHICLE TYPE (Page No. - 149)
    9.1 INTRODUCTION 
           9.1.1 RESEARCH METHODOLOGY
           9.1.2 ASSUMPTIONS
           9.1.3 PRIMARY INSIGHTS
                    FIGURE 37 MARKET, BY VEHICLE TYPE, 2022 VS. 2027
                    TABLE 125 MARKET, BY VEHICLE TYPE, 2018–2021 (MILLION UNITS)
                    TABLE 126 MARKET, BY VEHICLE TYPE, 2022–2027 (MILLION UNITS)
                    TABLE 127 MARKET, BY VEHICLE TYPE, 2018–2021 (USD MILLION)
                    TABLE 128 MARKET, BY VEHICLE TYPE, 2022–2027 (USD MILLION)
    9.2 ECONOMY CARS 
           TABLE 129 ECONOMY CARS: MARKET, BY REGION, 2018–2021 (MILLION UNITS)
           TABLE 130 ECONOMY CARS: MARKET, BY REGION, 2022–2027 (MILLION UNITS)
           TABLE 131 ECONOMY CARS: MARKET, BY REGION, 2018–2021 (USD MILLION)
           TABLE 132 ECONOMY CARS: MARKET, BY REGION, 2022–2027 (USD MILLION)
    9.3 MID-RANGE CARS 
           TABLE 133 MID-RANGE CARS: MARKET, BY REGION, 2018–2021 (MILLION UNITS)
           TABLE 134 MID-RANGE CARS: MARKET, BY REGION, 2022–2027 (MILLION UNITS)
           TABLE 135 MID-RANGE CARS: MARKET, BY REGION, 2018–2021 (USD MILLION)
           TABLE 136 MID-RANGE CARS: MARKET, BY REGION, 2022–2027 (USD MILLION)
    9.4 PREMIUM CARS 
           TABLE 137 PREMIUM CARS: MARKET, BY REGION, 2018–2021 (MILLION UNITS)
           TABLE 138 PREMIUM CARS: MARKET, BY REGION, 2022–2027 (MILLION UNITS)
           TABLE 139 PREMIUM CARS: MARKET, BY REGION, 2018–2021 (USD MILLION)
           TABLE 140 PREMIUM CARS: MARKET, BY REGION, 2022–2027 (USD MILLION)
    9.5 LIGHT COMMERCIAL VEHICLES 
           TABLE 141 LIGHT COMMERCIAL VEHICLES: MARKET, BY REGION, 2018–2021 (MILLION UNITS)
           TABLE 142 LIGHT COMMERCIAL VEHICLES: MARKET, BY REGION, 2022–2027 (MILLION UNITS)
           TABLE 143 LIGHT COMMERCIAL VEHICLES: MARKET, BY REGION, 2018–2021 (USD MILLION)
           TABLE 144 LIGHT COMMERCIAL VEHICLES: MARKET, BY REGION, 2022–2027 (USD MILLION)
    9.6 HEAVY-DUTY VEHICLES 
           TABLE 145 HEAVY-DUTY VEHICLES: MARKET, BY REGION, 2018–2021 (MILLION UNITS)
           TABLE 146 HEAVY-DUTY VEHICLES: MARKET, BY REGION, 2022–2027 (MILLION UNITS)
           TABLE 147 HEAVY-DUTY VEHICLES: MARKET, BY REGION, 2018–2021 (USD MILLION)
           TABLE 148 HEAVY-DUTY VEHICLES: MARKET, BY REGION, 2022–2027 (USD MILLION)
 
10 ELECTRIC VEHICLE RELAY MARKET, BY VEHICLE TYPE (Page No. - 161)
     10.1 INTRODUCTION 
             10.1.1 RESEARCH METHODOLOGY
             10.1.2 ASSUMPTIONS
             10.1.3 PRIMARY INSIGHTS
                       FIGURE 38 ELECTRIC VEHICLE RELAY MARKET, BY VEHICLE TYPE, 2022 VS. 2027
                       TABLE 149 ELECTRIC VEHICLE RELAY MARKET, BY VEHICLE TYPE, 2018–2021 (MILLION UNITS)
                       TABLE 150 ELECTRIC VEHICLE RELAY MARKET, BY VEHICLE TYPE, 2022–2027 (MILLION UNITS)
                       TABLE 151 ELECTRIC VEHICLE RELAY MARKET, BY VEHICLE TYPE, 2018–2021 (USD MILLION)
                       TABLE 152 ELECTRIC VEHICLE RELAY MARKET, BY VEHICLE TYPE, 2022–2027 (USD MILLION)
     10.2 BATTERY ELECTRIC VEHICLES (BEVS) 
             10.2.1 EMISSION-FREE AND NOISE-LESS OPERATION
                       TABLE 153 BEVS: ELECTRIC VEHICLE RELAY MARKET, BY REGION, 2018–2021 (MILLION UNITS)
                       TABLE 154 BEVS: ELECTRIC VEHICLE RELAY MARKET, BY REGION, 2022–2027 (MILLION UNITS)
                       TABLE 155 BEVS: ELECTRIC VEHICLE RELAY MARKET, BY REGION, 2018–2021 (USD MILLION)
                       TABLE 156 BEVS: ELECTRIC VEHICLE RELAY MARKET, BY REGION, 2022–2027 (USD MILLION)
     10.3 PLUG-IN HYBRID ELECTRIC VEHICLES (PHEVS) 
             10.3.1 LOWER COST OF OWNERSHIP
                       TABLE 157 PHEVS: ELECTRIC VEHICLE RELAY MARKET, BY REGION, 2018–2021 (MILLION UNITS)
                       TABLE 158 PHEVS: ELECTRIC VEHICLE RELAY MARKET, BY REGION, 2022–2027 (MILLION UNITS)
                       TABLE 159 PHEVS: ELECTRIC VEHICLE RELAY MARKET, BY REGION, 2018–2021 (USD MILLION)
                       TABLE 160 PHEVS: ELECTRIC VEHICLE RELAY MARKET, BY REGION, 2022–2027 (USD MILLION)
     10.4 FUEL CELL ELECTRIC VEHICLES (FCEVS) 
             10.4.1 REDUCED CHARGING/REFUELING TIME
                       TABLE 161 FCEVS: ELECTRIC VEHICLE RELAY MARKET, BY REGION, 2018–2021 (MILLION UNITS)
                       TABLE 162 FCEVS: ELECTRIC VEHICLE RELAY MARKET, BY REGION, 2022–2027 (MILLION UNITS)
                       TABLE 163 FCEVS: ELECTRIC VEHICLE RELAY MARKET, BY REGION, 2018–2021 (USD MILLION)
                       TABLE 164 FCEVS: ELECTRIC VEHICLE RELAY MARKET, BY REGION, 2022–2027 (USD MILLION)
 
11 ELECTRIC VEHICLE RELAY MARKET, BY RELAY TYPE (Page No. - 169)
     11.1 INTRODUCTION 
             11.1.1 RESEARCH METHODOLOGY
             11.1.2 ASSUMPTIONS
             11.1.3 PRIMARY INSIGHTS
                       FIGURE 39 ELECTRIC VEHICLE RELAY MARKET, BY RELAY TYPE, 2022 VS. 2027
                       TABLE 165 ELECTRIC VEHICLE RELAY MARKET, BY RELAY TYPE, 2018–2021 (MILLION UNITS)
                       TABLE 166 ELECTRIC VEHICLE RELAY MARKET, BY RELAY TYPE, 2022–2027 (MILLION UNITS)
                       TABLE 167 ELECTRIC VEHICLE RELAY MARKET, BY RELAY TYPE, 2018–2021 (USD MILLION)
                       TABLE 168 ELECTRIC VEHICLE RELAY MARKET, BY RELAY TYPE, 2022–2027 (USD MILLION)
     11.2 MAIN RELAYS 
             11.2.1 INCORPORATION IN BATTERY DISCHARGE UNITS
                       TABLE 169 MAIN RELAYS: ELECTRIC VEHICLE RELAY MARKET, BY REGION, 2018–2021 (MILLION UNITS)
                       TABLE 170 MAIN RELAYS: ELECTRIC VEHICLE RELAY MARKET, BY REGION, 2022–2027 (MILLION UNITS)
                       TABLE 171 MAIN RELAYS: ELECTRIC VEHICLE RELAY MARKET, BY REGION, 2018–2021 (USD MILLION)
                       TABLE 172 MAIN RELAYS: ELECTRIC VEHICLE RELAY MARKET, BY REGION, 2022–2027 (USD MILLION)
     11.3 PRECHARGE RELAYS 
             11.3.1 INCREASE IN USE OF BATTERY ELECTRIC VEHICLES
                       TABLE 173 PRECHARGE RELAYS: ELECTRIC VEHICLE RELAY MARKET, BY REGION, 2018–2021 (MILLION UNITS)
                       TABLE 174 PRECHARGE RELAYS: ELECTRIC VEHICLE RELAY MARKET, BY REGION, 2022–2027 (MILLION UNITS)
                       TABLE 175 PRECHARGE RELAYS: ELECTRIC VEHICLE RELAY MARKET, BY REGION, 2018–2021 (USD MILLION)
                       TABLE 176 PRECHARGE RELAYS: ELECTRIC VEHICLE RELAY MARKET, BY REGION, 2022–2027 (USD MILLION)
     11.4 QUICK CHARGE RELAYS 
             11.4.1 GROWING DEMAND FOR FAST-CHARGING CAPABILITIES IN ELECTRIC VEHICLES
                       TABLE 177 QUICK CHARGE RELAYS: ELECTRIC VEHICLE RELAY MARKET, BY REGION, 2018–2021 (MILLION UNITS)
                       TABLE 178 QUICK CHARGE RELAYS: ELECTRIC VEHICLE RELAY MARKET, BY REGION, 2022–2027 (MILLION UNITS)
                       TABLE 179 QUICK CHARGE RELAYS: ELECTRIC VEHICLE RELAY MARKET, BY REGION, 2018–2021 (USD MILLION)
                       TABLE 180 QUICK CHARGE RELAYS: ELECTRIC VEHICLE RELAY MARKET, BY REGION, 2022–2027 (USD MILLION)
     11.5 NORMAL CHARGE RELAY 
             11.5.1 NEED FOR SAFETY IN ELECTRIC VEHICLE CHARGING SYSTEMS
                       TABLE 181 NORMAL CHARGE RELAYS: ELECTRIC VEHICLE RELAY MARKET, BY REGION, 2018–2021 (MILLION UNITS)
                       TABLE 182 NORMAL CHARGE RELAYS: ELECTRIC VEHICLE RELAY MARKET, BY REGION, 2022–2027 (MILLION UNITS)
                       TABLE 183 NORMAL CHARGE RELAYS: ELECTRIC VEHICLE RELAY MARKET, BY REGION, 2018–2021 (USD MILLION)
                       TABLE 184 NORMAL CHARGE RELAYS: ELECTRIC VEHICLE RELAY MARKET, BY REGION, 2022–2027 (USD MILLION)
     11.6 HIGH VOLTAGE ACCESSORIES RELAYS 
             11.6.1 INCREASED DEMAND FOR COMFORT, SAFETY, AND ENTERTAINMENT FEATURES
                       TABLE 185 HIGH VOLTAGE ACCESSORIES RELAYS: ELECTRIC VEHICLE RELAY MARKET, BY REGION, 2018–2021 (MILLION UNITS)
                       TABLE 186 HIGH VOLTAGE ACCESSORIES RELAYS: ELECTRIC VEHICLE RELAY MARKET, BY REGION, 2022–2027 (MILLION UNITS)
                       TABLE 187 HIGH VOLTAGE ACCESSORIES RELAYS: ELECTRIC VEHICLE RELAY MARKET, BY REGION, 2018–2021 (USD MILLION)
                       TABLE 188 HIGH VOLTAGE ACCESSORIES RELAYS: ELECTRIC VEHICLE RELAY MARKET, BY REGION, 2022–2027 (USD MILLION)
 
12 ELECTRIC VEHICLE RELAY MARKET, BY AMPERE (Page No. - 180)
     12.1 INTRODUCTION 
             12.1.1 RESEARCH METHODOLOGY
             12.1.2 ASSUMPTIONS
             12.1.3 PRIMARY INSIGHTS
                       FIGURE 40 ELECTRIC VEHICLE RELAY MARKET, BY AMPERE, 2022 VS. 2027
                       TABLE 189 ELECTRIC VEHICLE RELAY MARKET, BY AMPERE, 2018–2021 (MILLION UNITS)
                       TABLE 190 ELECTRIC VEHICLE RELAY MARKET, BY AMPERE, 2022–2027 (MILLION UNITS)
                       TABLE 191 ELECTRIC VEHICLE RELAY MARKET, BY AMPERE, 2018–2021 (USD MILLION)
                       TABLE 192 ELECTRIC VEHICLE RELAY MARKET, BY AMPERE, 2022–2027 (USD MILLION)
     12.2 5A–15A RELAY 
             12.2.1 DEMAND FOR RELAYS IN ANCILLARY SYSTEMS
                       TABLE 193 5A–15A: ELECTRIC VEHICLE RELAY MARKET, BY REGION, 2018–2021 (MILLION UNITS)
                       TABLE 194 5A–15A: ELECTRIC VEHICLE RELAY MARKET, BY REGION, 2022–2027 (MILLION UNITS)
                       TABLE 195 5A–15A: ELECTRIC VEHICLE RELAY MARKET, BY REGION, 2018–2021 (USD MILLION)
                       TABLE 196 5A–15A: ELECTRIC VEHICLE RELAY MARKET, BY REGION, 2022–2027 (USD MILLION)
     12.3 16A–35A RELAY 
             12.3.1 DEPLOYMENT IN COMFORT FEATURES
                       TABLE 197 16A–35A: ELECTRIC VEHICLE RELAY MARKET, BY REGION, 2018–2021 (MILLION UNITS)
                       TABLE 198 16A–35A: ELECTRIC VEHICLE RELAY MARKET, BY REGION, 2022–2027 (MILLION UNITS)
                       TABLE 199 16A–35A: ELECTRIC VEHICLE RELAY MARKET, BY REGION, 2018–2021 (USD MILLION)
                       TABLE 200 16A–35A: ELECTRIC VEHICLE RELAY MARKET, BY REGION, 2022–2027 (USD MILLION)
     12.4 >35A RELAY 
             12.4.1 DEMAND FROM POWERTRAIN AND BATTERY MANAGEMENT SYSTEMS
                       TABLE 201 >35A: ELECTRIC VEHICLE RELAY MARKET, BY REGION, 2018–2021 (MILLION UNITS)
                       TABLE 202 >35A: ELECTRIC VEHICLE RELAY MARKET, BY REGION, 2022–2027 (MILLION UNITS)
                       TABLE 203 >35A: ELECTRIC VEHICLE RELAY MARKET, BY REGION, 2018–2021 (USD MILLION)
                       TABLE 204 >35A: ELECTRIC VEHICLE RELAY MARKET, BY REGION, 2022–2027 (USD MILLION)
 
13 AUTOMOTIVE RELAY MARKET, BY REGION (Page No. - 188)
     13.1 INTRODUCTION 
             13.1.1 RESEARCH METHODOLOGY
             13.1.2 ASSUMPTIONS
             13.1.3 INDUSTRY INSIGHTS
                       FIGURE 41 MARKET, BY REGION, 2022 VS. 2027 (USD MILLION)
             13.1.4 MARKET, BY REGION
                       TABLE 205 MARKET, BY REGION, 2018–2021 (MILLION UNITS)
                       TABLE 206 MARKET, BY REGION, 2022–2027 (MILLION UNITS)
                       TABLE 207 MARKET, BY REGION, 2018–2021 (USD MILLION)
                       TABLE 208 MARKET, BY REGION, 2022–2027 (USD MILLION)
     13.2 ASIA PACIFIC 
               FIGURE 42 ASIA PACIFIC: MARKET SNAPSHOT
               TABLE 209 ASIA PACIFIC: MARKET, BY COUNTRY, 2018–2021 (MILLION UNITS)
               TABLE 210 ASIA PACIFIC: MARKET, BY COUNTRY, 2022–2027 (MILLION UNITS)
               TABLE 211 ASIA PACIFIC: MARKET, BY COUNTRY, 2018–2021 (USD MILLION)
               TABLE 212 ASIA PACIFIC: MARKET, BY COUNTRY, 2022–2027 (USD MILLION)
             13.2.1 CHINA
                       13.2.1.1 Stringent regulations shift focus toward safety features
                                   TABLE 213 CHINA: MARKET, BY VEHICLE TYPE, 2018–2021 (MILLION UNITS)
                                   TABLE 214 CHINA: MARKET, BY VEHICLE TYPE, 2022–2027 (MILLION UNITS)
                                   TABLE 215 CHINA: MARKET, BY VEHICLE TYPE, 2018–2021 (USD MILLION)
                                   TABLE 216 CHINA: MARKET, BY VEHICLE TYPE, 2022–2027 (USD MILLION)
             13.2.2 INDIA
                       13.2.2.1 Increased purchasing ability and growing population
                                   TABLE 217 INDIA: MARKET, BY VEHICLE TYPE, 2018–2021 (MILLION UNITS)
                                   TABLE 218 INDIA: MARKET, BY VEHICLE TYPE, 2022–2027 (MILLION UNITS)
                                   TABLE 219 INDIA: MARKET, BY VEHICLE TYPE, 2018–2021 (USD MILLION)
                                   TABLE 220 INDIA: MARKET, BY VEHICLE TYPE, 2022–2027 (USD MILLION)
             13.2.3 JAPAN
                       13.2.3.1 Growing demand for advanced technology
                                   TABLE 221 JAPAN: MARKET, BY VEHICLE TYPE, 2018–2021 (MILLION UNITS)
                                   TABLE 222 JAPAN: MARKET, BY VEHICLE TYPE, 2022–2027 (MILLION UNITS)
                                   TABLE 223 JAPAN: MARKET, BY VEHICLE TYPE, 2018–2021 (USD MILLION)
                                   TABLE 224 JAPAN: MARKET, BY VEHICLE TYPE, 2022–2027 (USD MILLION)
             13.2.4 SOUTH KOREA
                       13.2.4.1 Environmental regulations and growth in demand for electric vehicles
                                   TABLE 225 SOUTH KOREA: MARKET, BY VEHICLE TYPE, 2018–2021 (MILLION UNITS)
                                   TABLE 226 SOUTH KOREA: MARKET, BY VEHICLE TYPE, 2022–2027 (MILLION UNITS)
                                   TABLE 227 SOUTH KOREA: MARKET, BY VEHICLE TYPE, 2018–2021 (USD MILLION)
                                   TABLE 228 SOUTH KOREA: MARKET, BY VEHICLE TYPE, 2022–2027 (USD MILLION)
             13.2.5 THAILAND
                       13.2.5.1 Stringent emission regulations and increased tourism
                                   TABLE 229 THAILAND: MARKET, BY VEHICLE TYPE, 2018–2021 (MILLION UNITS)
                                   TABLE 230 THAILAND: MARKET, BY VEHICLE TYPE, 2022–2027 (MILLION UNITS)
                                   TABLE 231 THAILAND: MARKET, BY VEHICLE TYPE, 2018–2021 (USD MILLION)
                                   TABLE 232 THAILAND: MARKET, BY VEHICLE TYPE, 2022–2027 (USD MILLION)
             13.2.6 INDONESIA
                       13.2.6.1 Rapidly growing electric vehicles market
                                   TABLE 233 INDONESIA: MARKET, BY VEHICLE TYPE, 2018–2021 (MILLION UNITS)
                                   TABLE 234 INDONESIA: MARKET, BY VEHICLE TYPE, 2022–2027 (MILLION UNITS)
                                   TABLE 235 INDONESIA: MARKET, BY VEHICLE TYPE, 2018–2021 (USD MILLION)
                                   TABLE 236 INDONESIA: MARKET, BY VEHICLE TYPE, 2022–2027 (USD MILLION)
     13.3 EUROPE 
               FIGURE 43 EUROPE: MARKET, BY COUNTRY, 2022–2027 (USD MILLION)
               TABLE 237 EUROPE: MARKET, BY COUNTRY, 2018–2021 (MILLION UNITS)
               TABLE 238 EUROPE: MARKET, BY COUNTRY, 2022–2027 (MILLION UNITS)
               TABLE 239 EUROPE: MARKET, BY COUNTRY, 2018–2021 (USD MILLION)
               TABLE 240 EUROPE: MARKET, BY COUNTRY, 2022–2027 (USD MILLION)
             13.3.1 GERMANY
                       13.3.1.1 High demand for enhanced comfort and performance
                                   TABLE 241 GERMANY: MARKET, BY VEHICLE TYPE, 2018–2021 (MILLION UNITS)
                                   TABLE 242 GERMANY: MARKET, BY VEHICLE TYPE, 2022–2027 (MILLION UNITS)
                                   TABLE 243 GERMANY: MARKET, BY VEHICLE TYPE, 2018–2021 (USD MILLION)
                                   TABLE 244 GERMANY: MARKET, BY VEHICLE TYPE, 2022–2027 (USD MILLION)
             13.3.2 FRANCE
                       13.3.2.1 Increasing safety concerns among consumers
                                   TABLE 245 FRANCE: MARKET, BY VEHICLE TYPE, 2018–2021 (MILLION UNITS)
                                   TABLE 246 FRANCE: MARKET, BY VEHICLE TYPE, 2022–2027 (MILLION UNITS)
                                   TABLE 247 FRANCE: MARKET, BY VEHICLE TYPE, 2018–2021 (USD MILLION)
                                   TABLE 248 FRANCE: MARKET, BY VEHICLE TYPE, 2022–2027 (USD MILLION)
             13.3.3 UK
                       13.3.3.1 Investments in newer technologies from domestic carmakers
                                   TABLE 249 UK: MARKET, BY VEHICLE TYPE, 2018–2021 (MILLION UNITS)
                                   TABLE 250 UK: MARKET, BY VEHICLE TYPE, 2022–2027 (MILLION UNITS)
                                   TABLE 251 UK: MARKET, BY VEHICLE TYPE, 2018–2021 (USD MILLION)
                                   TABLE 252 UK: MARKET, BY VEHICLE TYPE, 2022–2027 (USD MILLION)
             13.3.4 RUSSIA
                       13.3.4.1 Growing penetration of all vehicle segments
                                   TABLE 253 RUSSIA: MARKET, BY VEHICLE TYPE, 2018–2021 (MILLION UNITS)
                                   TABLE 254 RUSSIA: MARKET, BY VEHICLE TYPE, 2022–2027 (MILLION UNITS)
                                   TABLE 255 RUSSIA: MARKET, BY VEHICLE TYPE, 2018–2021 (USD MILLION)
                                   TABLE 256 RUSSIA: MARKET, BY VEHICLE TYPE, 2022–2027 (USD MILLION)
             13.3.5 SPAIN
                       13.3.5.1 Largescale automotive industry in Spain
                                   TABLE 257 SPAIN: MARKET, BY VEHICLE TYPE, 2018–2021 (MILLION UNITS)
                                   TABLE 258 SPAIN: MARKET, BY VEHICLE TYPE, 2022–2027 (MILLION UNITS)
                                   TABLE 259 SPAIN: MARKET, BY VEHICLE TYPE, 2018–2021 (USD MILLION)
                                   TABLE 260 SPAIN: MARKET, BY VEHICLE TYPE, 2022–2027 (USD MILLION)
             13.3.6 ITALY
                       13.3.6.1 Government-aided subsidies
                                   TABLE 261 ITALY: MARKET, BY VEHICLE TYPE, 2018–2021 (MILLION UNITS)
                                   TABLE 262 ITALY: MARKET, BY VEHICLE TYPE, 2022–2027 (MILLION UNITS)
                                   TABLE 263 ITALY: MARKET, BY VEHICLE TYPE, 2018–2021 (USD MILLION)
                                   TABLE 264 ITALY: MARKET, BY VEHICLE TYPE, 2022–2027 (USD MILLION)
     13.4 NORTH AMERICA 
               FIGURE 44 NORTH AMERICA: MARKET SNAPSHOT
               TABLE 265 NORTH AMERICA: MARKET, BY COUNTRY, 2018–2021 (MILLION UNITS)
               TABLE 266 NORTH AMERICA: MARKET, BY COUNTRY, 2022–2027 (MILLION UNITS)
               TABLE 267 NORTH AMERICA: MARKET, BY COUNTRY, 2018–2021 (USD MILLION)
               TABLE 268 NORTH AMERICA: MARKET, BY COUNTRY, 2022–2027 (USD MILLION)
             13.4.1 US
                       13.4.1.1 Large automotive sector
                                   TABLE 269 US: MARKET, BY VEHICLE TYPE, 2018–2021 (MILLION UNITS)
                                   TABLE 270 US: MARKET, BY VEHICLE TYPE, 2022–2027 (MILLION UNITS)
                                   TABLE 271 US: MARKET, BY VEHICLE TYPE, 2018–2021 (USD MILLION)
                                   TABLE 272 US: MARKET, BY VEHICLE TYPE, 2022–2027 (USD MILLION)
             13.4.2 CANADA
                       13.4.2.1 Presence of leading carmakers
                                   TABLE 273 CANADA: MARKET, BY VEHICLE TYPE, 2018–2021 (MILLION UNITS)
                                   TABLE 274 CANADA: MARKET, BY VEHICLE TYPE, 2022–2027 (MILLION UNITS)
                                   TABLE 275 CANADA: MARKET, BY VEHICLE TYPE, 2018–2021 (USD MILLION)
                                   TABLE 276 CANADA: MARKET, BY VEHICLE TYPE, 2022–2027 (USD MILLION)
             13.4.3 MEXICO
                       13.4.3.1 Liberal free-trade agreements
                                   TABLE 277 MEXICO: MARKET, BY VEHICLE TYPE, 2018–2021 (MILLION UNITS)
                                   TABLE 278 MEXICO: MARKET, BY VEHICLE TYPE, 2022–2027 (MILLION UNITS)
                                   TABLE 279 MEXICO: MARKET, BY VEHICLE TYPE, 2018–2021 (USD MILLION)
                                   TABLE 280 MEXICO: MARKET, BY VEHICLE TYPE, 2022–2027 (USD MILLION)
     13.5 ROW 
               TABLE 281 ROW: MARKET, BY COUNTRY, 2018–2021 (MILLION UNITS)
               TABLE 282 ROW: MARKET, BY COUNTRY, 2022–2027 (MILLION UNITS)
               TABLE 283 ROW: MARKET, BY COUNTRY, 2018–2021 (USD MILLION)
               TABLE 284 ROW: MARKET, BY COUNTRY, 2022–2027 (USD MILLION)
             13.5.1 BRAZIL
                       13.5.1.1 Presence of leading carmakers
                                   TABLE 285 BRAZIL: MARKET, BY VEHICLE TYPE, 2018–2021 (MILLION UNITS)
                                   TABLE 286 BRAZIL: MARKET, BY VEHICLE TYPE, 2022–2027 (MILLION UNITS)
                                   TABLE 287 BRAZIL: MARKET, BY VEHICLE TYPE, 2018–2021 (USD MILLION)
                                   TABLE 288 BRAZIL: MARKET, BY VEHICLE TYPE, 2022–2027 (USD MILLION)
             13.5.2 SOUTH AFRICA
                       13.5.2.1 Growing economy and increased purchasing power
                                   TABLE 289 SOUTH AFRICA: MARKET, BY VEHICLE TYPE, 2018–2021 (MILLION UNITS)
                                   TABLE 290 SOUTH AFRICA: MARKET, BY VEHICLE TYPE, 2022–2027 (MILLION UNITS)
                                   TABLE 291 SOUTH AFRICA: MARKET, BY VEHICLE TYPE, 2018–2021 (USD MILLION)
                                   TABLE 292 SOUTH AFRICA: MARKET, BY VEHICLE TYPE, 2022–2027 (USD MILLION)
             13.5.3 IRAN
                       13.5.3.1 Improved automotive industry
                                   TABLE 293 IRAN: MARKET, BY VEHICLE TYPE, 2018–2021 (MILLION UNITS)
                                   TABLE 294 IRAN: MARKET, BY VEHICLE TYPE, 2022–2027 (MILLION UNITS)
                                   TABLE 295 IRAN: MARKET, BY VEHICLE TYPE, 2018–2021 (USD MILLION)
                                   TABLE 296 IRAN: MARKET, BY VEHICLE TYPE, 2022–2027 (USD MILLION)
 
14 RECOMMENDATIONS BY MARKETSANDMARKETS (Page No. - 230)
     14.1 ASIA PACIFIC IS KEY MARKET FOR AUTOMOTIVE RELAY 
     14.2 >35A RELAY AND ELECTRIC & HYBRID VEHICLES CAN BE KEY FOCUS AREAS FOR MANUFACTURERS 
     14.3 CONCLUSION 
 
15 COMPETITIVE LANDSCAPE (Page No. - 232)
     15.1 OVERVIEW 
     15.2 AUTOMOTIVE RELAY MARKET SHARE ANALYSIS, 2021 
               TABLE 297 MARKET SHARE ANALYSIS, 2021
               FIGURE 45MARKET SHARE, 2021
               FIGURE 46 REVENUE ANALYSIS OF TOP LISTED/PUBLIC PLAYERS
     15.3 COMPETITIVE EVALUATION QUADRANT 
             15.3.1 TERMINOLOGY
             15.3.2 STARS
             15.3.3 EMERGING LEADERS
             15.3.4 PERVASIVE PLAYERS
             15.3.5 PARTICIPANTS
                       FIGURE 47 AUTOMOTIVE RELAY MANUFACTURERS: COMPETITIVE EVALUATION MATRIX, 2021
                       TABLE 298 MARKET: COMPANY FOOTPRINT, 2021
                       TABLE 299 MARKET: COMPANY PRODUCT FOOTPRINT, 2021
                       TABLE 300 MARKET: COMPANY REGION FOOTPRINT, 2021
     15.4 COMPETITIVE EVALUATION QUADRANT – AUTOMOTIVE EV RELAY MANUFACTURERS 
             15.4.1 TERMINOLOGY
             15.4.2 STARS
             15.4.3 EMERGING LEADERS
             15.4.4 PERVASIVE PLAYERS
             15.4.5 PARTICIPANTS
                       FIGURE 48 AUTOMOTIVE EV RELAY MANUFACTURERS: COMPETITIVE EVALUATION MATRIX, 2021
     15.5 COMPETITIVE SCENARIO 
             15.5.1 PRODUCT LAUNCHES
                       TABLE 301 PRODUCT LAUNCHES, 2020–2022
             15.5.2 DEALS
                       TABLE 302 DEALS, 2022–2022
             15.5.3 EXPANSIONS
                       TABLE 303 EXPANSIONS, 2020–2022
     15.6 COMPETITIVE BENCHMARKING 
               TABLE 304 AUTOMOTIVE RELAY MARKET: KEY RELAY MANUFACTURERS
     15.7 RIGHT TO WIN, 2019–2022 
               TABLE 305 NEW PRODUCT DEVELOPMENTS, PARTNERSHIPS, AND SUPPLY CONTRACTS, 2019–2022
 
16 COMPANY PROFILES (Page No. - 248)
(Business overview, Products offered, Recent Developments, MNM view)*
     16.1 AUTOMOTIVE RELAY MARKET — KEY PLAYERS 
             16.1.1 TE CONNECTIVITY
                       TABLE 306 TE CONNECTIVITY: BUSINESS OVERVIEW
                       FIGURE 49 TE CONNECTIVITY: COMPANY SNAPSHOT
                       TABLE 307 TE CONNECTIVITY: DEALS
             16.1.2 OMRON CORPORATION
                       TABLE 308 OMRON CORPORATION: BUSINESS OVERVIEW
                       FIGURE 50 OMRON CORPORATION: COMPANY SNAPSHOT
                       TABLE 309 OMRON CORPORATION: EXPANSION
             16.1.3 PANASONIC CORPORATION
                       TABLE 310 PANASONIC CORPORATION: BUSINESS OVERVIEW
                       FIGURE 51 PANASONIC CORPORATION: COMPANY SNAPSHOT
             16.1.4 HONGFA TECHNOLOGY CO.
                       TABLE 311 HONGFA TECHNOLOGY CO.: BUSINESS OVERVIEW
                       TABLE 312 HONGFA TECHNOLOGY CO.: EXPANSIONS
             16.1.5 FUJITSU COMPONENT LIMITED
                       TABLE 313 FUJITSU COMPONENT LIMITED: BUSINESS OVERVIEW
                       FIGURE 52 FUJITSU COMPONENT LIMITED: COMPANY SNAPSHOT
                       TABLE 314 FUJITSU COMPONENT LIMITED: NEW PRODUCT DEVELOPMENT
             16.1.6 DENSO CORPORATION
                       TABLE 315 DENSO CORPORATION: BUSINESS OVERVIEW
                       FIGURE 53 DENSO CORPORATION: COMPANY SNAPSHOT
            TABLE 316 DENSO CORPORATION: DEALS
             16.1.7 ROBERT BOSCH LLC
                       TABLE 317 ROBERT BOSCH LLC: BUSINESS OVERVIEW
                       FIGURE 54 ROBERT BOSCH LLC: COMPANY SNAPSHOT
             16.1.8 MITSUBA CORPORATION
                       TABLE 318 MITSUBA CORPORATION: BUSINESS OVERVIEW
                       FIGURE 55 MITSUBA CORPORATION: COMPANY SNAPSHOT
             16.1.9 SONG CHUAN GROUP COMPANIES
                       TABLE 319 SONG CHUAN GROUP COMPANIES: BUSINESS OVERVIEW
             16.1.10 GOOD SKY ELECTRIC CO., LTD.
                       TABLE 320 GOOD SKY ELECTRIC CO., LTD.: BUSINESS OVERVIEW
     16.2 AUTOMOTIVE RELAY MARKET — OTHER PLAYERS 
             16.2.1 XIAMEN LEVEL KING KEEP ELECTRONICS (LKK)
                       TABLE 321 XIAMEN LEVEL KING KEEP ELECTRONICS (LKK): COMPANY OVERVIEW
             16.2.2 CIT (CIRCUIT INTERRUPTION TECHNOLOGY) RELAY & SWITCH
                       TABLE 322 CIT (CIRCUIT INTERRUPTION TECHNOLOGY) RELAY & SWITCH: COMPANY OVERVIEW
             16.2.3 PICKER
                       TABLE 323 PICKER: COMPANY OVERVIEW
             16.2.4 AMERICAN ZETTLER, INC.
                       TABLE 324 AMERICAN ZETTLER, INC: COMPANY OVERVIEW
             16.2.5 AMERICAN ELECTRONIC COMPONENTS (AEC)
                       TABLE 325 AMERICAN ELECTRONIC COMPONENTS (AEC): COMPANY OVERVIEW
             16.2.6 HELLA GMBH & CO. KGAA
                       TABLE 326 HELLA GMBH & CO. KGAA: COMPANY OVERVIEW
             16.2.7 SIEMENS
                       TABLE 327 SIEMENS: COMPANY OVERVIEW
             16.2.8 ABB GROUP
                       TABLE 328 ABB GROUP: COMPANY OVERVIEW
             16.2.9 COTO TECHNOLOGY
                       TABLE 329 COTO TECHNOLOGY: COMPANY OVERVIEW
             16.2.10 SANYOU CORPORATION LIMITED
                       TABLE 330 SANYOU CORPORATION LIMITED: COMPANY OVERVIEW
*Details on Business overview, Products offered, Recent Developments, MNM view might not be captured in case of unlisted companies.
 
17 APPENDIX (Page No. - 282)
     17.1 INSIGHTS OF INDUSTRY EXPERTS 
     17.2 DISCUSSION GUIDE 
     17.3 KNOWLEDGESTORE: MARKETSANDMARKETS SUBSCRIPTION PORTAL 
     17.4 CUSTOMIZATION OPTIONS 
             17.4.1 AUTOMOTIVE RELAY MARKET, BY APPLICATION AND VEHICLE TYPE
                       17.4.1.1 Passenger cars
                       17.4.1.2 Light commercial vehicles
     17.5 RELATED REPORTS 
     17.6 AUTHOR DETAILS 

The research study involved extensive use of secondary sources such as company annual reports/presentations, industry association publications, automotive relay magazine articles, directories, technical handbooks, World Economic Outlook, trade websites, technical articles, and databases to identify and collect information on the automotive relay market. Primary sources—experts from related industries, automotive relay manufacturers, and suppliers—were interviewed to obtain and verify critical information, as well as to assess the growth prospects and market estimations.

Secondary Research

Secondary sources for this research study included corporate filings (such as annual reports, investor presentations, and financial statements); trade, business, and professional associations; white papers; certified publications; articles by recognized authors; directories; and databases. The secondary data was collected and analyzed to arrive at the overall market size, which was further validated through primary research.

Primary Research

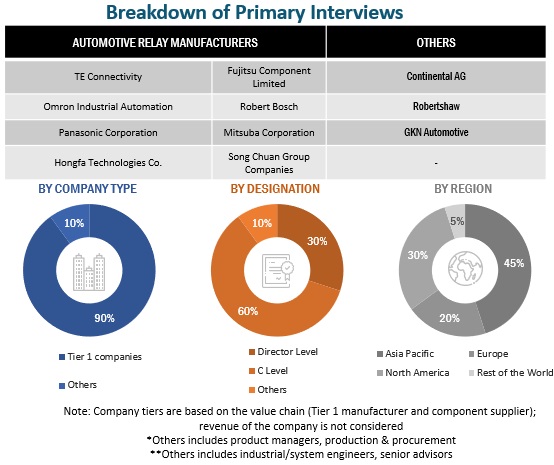
In the primary research process, various primary sources from both supply and demand sides were interviewed to obtain qualitative and quantitative information on the market. Primary sources from the supply side included various industry experts, such as CXOs, vice presidents, directors of business development, marketing, product development/innovation teams, and related key executives from various key companies. Various system integrators, industry associations, independent consultants/industry veterans, and key opinion leaders were also interviewed.

Primary interviews were conducted to gather insights such as automotive relay production forecast, market forecast, future technology trends, and upcoming technologies. Data triangulation of all these points was done with the information gathered from secondary research and company revenues. Stakeholders from the demand and supply sides were interviewed to understand their views on the aforementioned points.

Primary interviews were conducted with market experts from both the demand (OEM) and supply-side players across four major regions, namely, North America, Europe, the Asia Pacific, and the Rest of the World. Approximately 30% of interviews were conducted from the demand side, while 70% of primary interviews were conducted from the supply side. The primary data was collected through questionnaires, e-mails, and telephonic interviews. In the canvassing of primaries, various departments within organizations, such as sales and operations, were covered to provide a holistic viewpoint in this report.

After interacting with industry experts, brief sessions with highly experienced independent consultants were conducted to reinforce the findings from primaries. This, along with the opinions of the in-house subject matter experts, has led to the findings as described in the remainder of this report.
Automotive Relay Market Size, and Share

To know about the assumptions considered for the study, download the pdf brochure

Market Size Estimation

Bottom-Up Approach: Automotive Relay Market

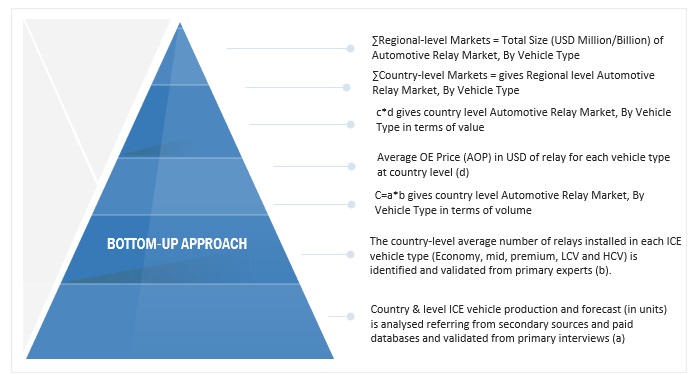
The bottom-up approach was used to estimate and validate the size of the automotive relay market. In this approach, the country-level production and forecast of ICE vehicles (passenger cars, LCV and heavy duty vehicles) (in units) were derived from secondary sources and various databases. Further, average number of relays installed in each vehicle type derived through secondary research and validated through primary interviews. Multiplication of country level vehicle production and average number of relays per vehicle type provides country-level automotive relay market, in terms of volume. Further, country-level average selling OE price of relays per vehicle type has been analyzed and multiplication with volume gives country-level automotive relay market, in terms of value. Summation of country-level markets provided the regional-level markets. The further summation of regional-level markets provided the global automotive relay market in terms of volume (units), by region, and vehicle type. Similar approach followed to analyze electric vehicle market, by EV type in terms of volume and value
Automotive Relay Market Size, and Share

To know about the assumptions considered for the study, Request for Free Sample Report

Top-Down Approach: Automotive Relay Market

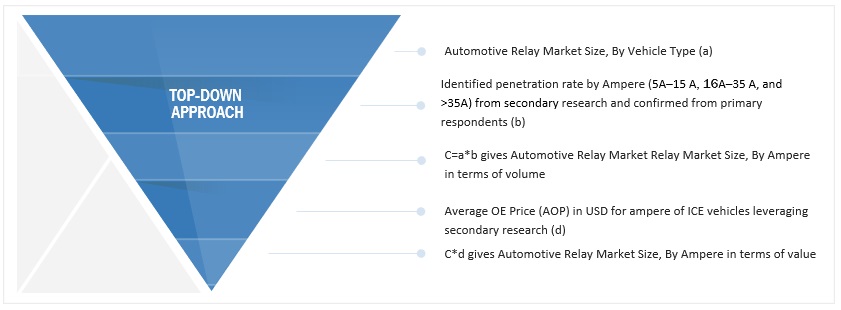
The top-down approach was followed to determine the market size by ampere and relay type for both ICE and electric vehicles in terms of volume and value for automotive relays. The region-wise automotive relay market by volume and value at regional level (Asia Pacific, North America, Europe, and the Rest of the World) were derived by vehicle type. The percentage share of relays by ampere, and relay type was derived from secondary sources and validated through primaries. It was further multiplied by the region-wise relay market volume and value. Through this, the regional level and global level for automotive relay market by ampere and relay type for both ICE and electric vehicles in terms of volume (thousand units) and value (USD million) were derived.
Automotive Relay Market Size, and Share

Data Triangulation

All percentage shares, splits, and breakdowns have been determined using secondary sources and verified by primary sources. All parameters that affect the markets covered in this research study were accounted for, viewed in extensive detail, and analyzed to obtain the final quantitative and qualitative data. This data was consolidated, enhanced with detailed inputs and analysis from MarketsandMarkets, and presented in the report. The following figure is an illustrative representation of the overall market size estimation process employed for this study.

Report Objectives

  • To define, describe, and forecast the forklift market in terms of value (USD million/USD billion) and volume (thousand units) based on the following segments:
    • By Relay Type (PCB Relays, Plug In Relays, High Voltage Relays, Protective Relays, Signal Relays, Time Relays)
    • By Application (Door Lock, Power Windows, Sunroof, Power Seat, Electronic Power Steering (EPS), Lighting, Fuel Injection, Air Conditioner, Starter, Anti-Lock Braking System (ABS), Traction Control System (TCS), Cooling Fan, Engine Management Module, Adaptive Cruise Control, Intelligent Park Assist)
    • ICE Vehicle Relay Market, By Ampere (5A-15A, 16A-35A, >35A)
    • By Vehicle Type (Economy cars, Mid-range cars, Premium cars, Light Commercial Vehicle, Heavy Duty Vehicles)
    • Electric Vehicle Relay Market, By Ampere (5A-15A, 16A-35A, >35A)
    • Electric Vehicle Relay Market, By Relay Type (Main Relay, Precharge Relay, Quick Charge Relay, Normal Charge Relay, High Voltage Accessories Relay)
    • Electric Vehicle Relay Market, By EV Type (Battery Electric Vehicle, Fuel Cell Electric Vehicle, Plug In Hybrid Electric Vehicle)
    • By Region (Asia Pacific, Europe, North America, And Rest of The World)
  • To understand the market dynamics (drivers, restraints, opportunities, and challenges) of the forklift market and provide patent analysis, case study analysis, supply chain analysis, trade analysis, Porter’s Five Force Analysis, and ecosystem analysis
  • To analyze the share of the key players operating in the automotive relay market
  • To develop competitive evaluation matrix and distinguish them into stars, emerging leaders, pervasive players, and participants according to their product portfolio strength and business strategies
  • To analyze recent developments such as deals, expansions, new product launches, and other activities carried out by key industry players in the automotive relay market

Available Customizations

Along with the market data, MarketsandMarkets offers customizations in accordance with company-specific needs.

The following customization options are available for the report:

Automotive Relay Market, By Application And Vehicle Type

  • Passenger cars
  • Light commercial vehicles

Note: The market will be provided for all application considered under study for ICE Vehicle type only

Custom Market Research Services

We will customize the research for you, in case the report listed above does not meet with your exact requirements. Our custom research will comprehensively cover the business information you require to help you arrive at strategic and profitable business decisions.

Request Customization

Instant Answers with GPT - Ask Now!

Ask real questions. Get complete answers !
Report Code
AT 5382
Published ON
Dec, 2022
Choose License Type
BUY NOW
  • SHARE
X
Request Customization
Speak to Analyst
Speak to Analyst
OR FACE-TO-FACE MEETING
PERSONALIZE THIS RESEARCH
  • Triangulate with your Own Data
  • Get Data as per your Format and Definition
  • Gain a Deeper Dive on a Specific Application, Geography, Customer or Competitor
  • Any level of Personalization
REQUEST A FREE CUSTOMIZATION
LET US HELP YOU!
  • What are the Known and Unknown Adjacencies Impacting the Automotive Relay Market
  • What will your New Revenue Sources be?
  • Who will be your Top Customer; what will make them switch?
  • Defend your Market Share or Win Competitors
  • Get a Scorecard for Target Partners
CUSTOMIZED WORKSHOP REQUEST
  • Call Us
  • +1-888-600-6441 (Corporate office hours)
  • +1-888-600-6441 (US/Can toll free)
  • +44-800-368-9399 (UK office hours)
CONNECT WITH US
ABOUT TRUST ONLINE
©2024 MarketsandMarkets Research Private Ltd. All rights reserved
DMCA.com Protection Status Website Feedback