Connected Car Market by Service ICE & EV (OTA, Navigation, Cybersecurity, Multimedia Streaming, Social Media, e-Call, Autopilot, Home Integration), Form, Market (OE, Aftermarket), Network, Transponder, Hardware and Region - Global Forecast to 2026
The connected car market was valued at USD 23.6 Billion in 2021, and it is expected to reach USD 56.3 Billion by 2026, registering a CAGR of about 19.0% in terms of revenue during the forecast period (2022-2026). Factors such as the rollout of stringent safety regulations, growing sales of high-end luxury cars, development of 5G infrastructure, autonomous vehicles, and growing adoption of integrated connectivity are expected to drive the demand for connected car market.
To know about the assumptions considered for the study, Request for Free Sample Report
Market Dynamics
DRIVER: Increased demand for enhanced user comfort, safety, and convenience
An increase in ADAS features in cars is the primary driver for the connected car market, as these features ensure enhanced levels of safety. Governments in various countries also focus on mandating various ADAS and safety features. There are various ADAS features mandated in Europe and the US. For instance, Anti-lock Braking System (ABS) has been mandatory for all new vehicles sold in the EU since 2004, and Electronic Stability Control (ESC) became mandatory in 2014. Autonomous Emergency Braking (AEB) has been mandatory for all commercial vehicles sold in the EU since 2015. Similarly, connected car features such as e-call have been mandatory in all new cars sold within the EU since April 2018. As governments mandate various ADAS and other safety-related connected car features, the overall demand for connected cars has increased.
RESTRAINTS: Lack of infrastructure for the proper functioning of connected cars
Due to limited network connectivity on highways, vehicles are not connected to each other and the cloud. In developing countries such as Mexico, Brazil, and India, IT infrastructure development on highways is slower than in developed economies. 3G and 4G-LTE communication networks are presently limited to urban and semi-urban areas. While several third-party logistics companies operate in semi-urban and rural areas, there are low connectivity issues. Therefore, the lack of IT and communication infrastructure in developing regions and lag in government norms can hamper the growth of the connected car market in these countries. Also, as providers of telecom services, industry players might become subject to country-specific telecom regulations, such as lawful intercept and in-country entity requirements. The interoperability of the various platforms and the cross-border use cases will have to be discussed and regulated. The reliance on data networks also raises the question of net neutrality, where internet service providers give some data transmission priority.
OPPORTUNITIES: Emergence of various technologies such as 5G and AI
The enhanced user experience for all connected cars depends on wireless connectivity. Many telecom industry players are developing 5G to increase the safety and efficiency of connected cars. According to the international 5G automotive associations, 68% of accidents can be avoided with the upcoming 5G technology. For instance, the EU and South Korea have signed a deal to work together on 5G development, while both promised USD 782 million and USD 1.5 billion in funding for local 5G projects. In the UK, USD 78 million of funding has been commissioned for a 5G research facility known as the 5G Innovation Centre (5GIC). With the increasing use of sensors and other data technologies, AI will be key to making sense of everything. Some automobiles already use AI for Level 3 autonomous driving, but for the industry to reach Level 5, major enhancements must be made to the cars and the infrastructure.
CHALLENGES: Cybersecurity
Despite major developments in connected car technology, cybersecurity remains a major challenge. Connected cars comprise hardware, software, mobile apps, and Bluetooth, each vulnerable to cyberattacks. There are various instances where cybersecurity has created a nuisance. For instance, in 2015, Fiat Chrysler recalled around 1.4 million vehicles due to safety reasons. Hackers took control of the car's infotainment system, which was connected to the mobile data network. Security researchers demonstrated that hackers could control a Jeep Cherokee remotely using the car’s infotainment system connected to the mobile data network. Similarly, Tesla S and Nissan Leaf are also examples of the threat of cyberattacks that connected cars face.
The integrated connectivity segment is estimated to be the fastest-growing market during the forecast period
The embedded connected car solution currently holds most of the connected car market by value. Earlier, OEMs relied on wired GPS or OBD dongle-based solutions to collect data from vehicles, but smartphone or integrated connectivity is growing rapidly. As integrated connectivity requires no additional fitted device, the solution becomes scalable, affordable, and reliable. Also, the growing popularity of shared mobility makes smartphone-connected solutions an attractive option to assess driving behavior and other connected solutions. The Asia Pacific is expected to be the fastest-growing market because of its cost-sensitive nature as smartphone/integrated connectivity requires minimal to no cost. For instance, according to GSMA, in 2020, 64% of the population in the Asia Pacific was connected by smartphone connectivity. This penetration and usage gap of 36% shows a huge potential in the Asia Pacific in the coming years. In Europe and North America, embedded connectivity is very popular due to various reasons such as government OBD mandates and already existing higher share of the premium and high-end vehicles (which already have in-built embedded connectivity).
Additionally, the development of 5G infrastructure is expected to be a major boost to the integrated connectivity market. In January 2022, the MIIT revealed that operators in mainland China had launched more than 1.4 million 5G base stations. It has set an ambitious plan to triple the number of 5G base stations to 3.64 million by the end of 2025.
Auto Parking is expected to register the fastest growth in the connected car services market
Auto parking/connected parking still has very low penetration, and this feature is currently offered for limited parking areas around various cities. It is limited to premium and high-end vehicles. For instance, Tesla has an autonomous driving feature with a completely remote parking service where the vehicle can park itself in a garage or charging station without a driver. Similarly, Ford, Peugeot, Renault, Toyota, and Volkswagen provide real-time information about parking locations and prices at specific destinations.
Collaborations between automakers to demonstrate the potential of connected parking are highly likely to drive its popularity and adoption. In September 2021, as part of a German Association of the Automobile Industry collaboration, Ford has partnered with infrastructure providers and technology companies, including Bosch, to demonstrate the potential for a connected vehicle to communicate with the car park infrastructure, to not only find a space but to park itself too. Automated Valet Parking enables drivers to use an app to send the vehicle into an automated parking maneuver – all from outside the vehicle. Additionally, developing smart city initiatives and advanced connectivity infrastructure would drive the popularity and demand for auto parking, as this connected car service requires smart infrastructure to access the desired features. Europe and North America currently have the largest penetration of auto parking/intelligent parking, but with growing smart city infrastructure, the demand in the Asia Pacific is expected to grow.
To know about the assumptions considered for the study, download the pdf brochure
The Asia Pacific connected car market is expected to register the highest growth rate during the forecast period
The Asia Pacific market is expected to witness the fastest CAGR growth during the forecast period. Currently, the penetration of connected cars in Asia is concentrated, with China expected to witness significant growth in the coming years. The market's growth is driven primarily by increasing vehicle safety and security norms, demand for vehicle-to-vehicle (V2V) connectivity technology, and the incorporation of IoT in the automotive industry. Integration of 5G in vehicle models is expected to be a major factor driving the connected car market. For instance, in 2021, GM announced its plan to roll out 5G in the Chinese market. The 5G service will provide faster internet speeds over the OnStar 4G LTE Wi-Fi that it already offers in its vehicles. These faster upload/download speeds will enable over-the-air updates in more vehicles. They will also help new GM vehicles connect and communicate with other vehicles on the road (vehicle-to-vehicle) and the public road infrastructure (vehicle-to-infrastructure). Since China is the largest automobile market, the growth in telematics adoption in China will strongly drive the telematics industry in APAC. The emergence of autonomous vehicle technology in the Asia Pacific market is one of the key trends increasing the demand for advanced connected car features. Also, the growing popularity of shared mobility and ride-hailing services is expected to boost the demand for connected car features in the Asia Pacific. Growing penetration of smartphone connectivity will also provide a strong boost to the market. Additionally, the increasing demand for aftermarket services through the renewal of connected car service subscriptions will drive the connected car services market in the coming years.
Connected Car Ecosystem
Key Market Players
The globally connected car market is dominated by major players such as Continental (Germany), Bosch (Germany), HARMAN (US), Airbiquity (US), and Visteon (US). These companies have strong distribution networks at a global level and offer an extensive product range. These companies adopt strategies such as new product developments, collaborations, and contracts & agreements to sustain their market position.
Get online access to the report on the World's First Market Intelligence Cloud
- Easy to Download Historical Data & Forecast Numbers
- Company Analysis Dashboard for high growth potential opportunities
- Research Analyst Access for customization & queries
- Competitor Analysis with Interactive dashboard
- Latest News, Updates & Trend analysis
Request Sample Scope of the Report
Get online access to the report on the World's First Market Intelligence Cloud
- Easy to Download Historical Data & Forecast Numbers
- Company Analysis Dashboard for high growth potential opportunities
- Research Analyst Access for customization & queries
- Competitor Analysis with Interactive dashboard
- Latest News, Updates & Trend analysis
Report Metric |
Details |
Market Revenue in 2021 |
USD 23.6 Billion |
Estimated Value by 2026 |
USD 56.3 Billion |
Growth Rate |
Poised to grow at a CAGR of 19.0% |
Market Segmentation |
By Service, Form Type, Hardware, End Market, Transponder, Network, EV Service, and Region |
Market Driver |
Increased demand for enhanced user comfort, safety, and convenience |
Market Opportunity |
Emergence of various technologies such as 5G and AI |
Geographies covered |
North America, Europe, Asia Pacific, and Rest of the World |
This research report categorizes the connected car market by Service ICE & EV, Form Type, Hardware, End Market, Transponder, Network, EV Service, and Region.
Recent Developments
- In February 2022, HARMAN announced HARMAN Savari MECWAVE, an Ultra Low-Latency Edge-Based Compute Platform for Turn-Key Connectivity. MECWAVE speeds up the deployment of vehicle-to-everything (V2X) communications, such as hazard alerts, and high-throughput connectivity experiences like interactive infotainment and video streaming. MECWAVE also extends V2X capabilities to vehicles and devices that are not V2X capable, such as bikes and scooters, as well as mobile and wearable devices.
- In November 2021, Continental developed a technology solution for highly automated driving: an intelligent software that enables complex driving maneuvers autonomously. The Next Generation Driving Planner is an innovative software solution that enables highly automated driving from Level 3. This means vehicles can master certain driving tasks independently and without driver intervention. The software developed by Continental represents a significant leap forward in driving intelligence.
- In June 2020, Bosch announced the launch of its new MEMS sensor, the SMI230, which ensures trouble-free navigation and helps realistically visualize vehicle movements. Production of the SMI230 at Bosch has recently started; the first customers are already getting the sensor as standard.
- In September 2020, Visteon Corporation introduced an all-new digital cluster for the 2021 Ford F-150. Leaving the traditional gauge design behind and establishing bold interface enhancements with cutting-edge HMI, Visteon’s solution refreshes the model’s cockpit with a contemporary shape – integrating high-resolution graphics that deliver realistic drive modes for a wide range of roads, environments, and weather conditions.
- In October 2020, Airbiquity launched its OTAmatic Vehicle Configurator, a tool for defining and managing connected vehicle software. The OTAmatic Vehicle Configurator gives automakers insight into the exact hardware and software configurations within a vehicle, manages known combinations of electronic control units (ECUs) and software versions in vehicles, and meets emerging government compliance requirements for type-certified vehicle systems.
Frequently Asked Questions (FAQ):
How big is the connected car market?
The global connected car market in terms of revenue was estimated to be worth $23.6 billion in 2021 and is poised to reach $56.3 billion by 2026, growing at a CAGR of 19.0%.
Which are the most promising services presently and which will be witness popularity in the coming years?
Currently, navigation, infotainment and e-call are the most popular connected car services. However, However, owing to developments in autonomous and connected cars, advanced telematics services such as remote diagnostics, over-the-air updates, auto pilot are expected to grow significantly post 2025.
What are the key market trends impacting the growth of the connected car market?
The emergence of various technologies such as 5G and AI, the increasing popularity of automation in the automotive sector, and developments in ridesharing and mobility services are projected to drive the demand for connected cars.
Which type of connectivity will witness the fastest growth in the coming years?
Integrated form type is expected to witness the fastest growth as it requires minimal hardware and installation cost. Also, growing availability of connected services apps with minimum subscription cost, better accuracy and assessing details are expected to drive smartphone/integrated connectivity in automobiles.
What is the trend in connected car industry regarding market structure?
Currently, telematics services providers offer connected car services. Now, Internet service providers (ISPs) have also started offering telematics/connected car hardware, which telematics service providers offer, to strengthen their market share. These players have also started investing in 5G hardware/technology to stay ahead in the competitive nature of the market. Thus, taking into consideration the continuous efforts by the automakers to stay competitive, the connected car market is expected to flourish in the near future.
What revenue shift would be observed in the connected car ecosystem?
Currently majority of the revenue generates from the ICE vehicle industry majorly, OEM sales. But in the coming years, government safety mandates and connected services benefits is expected to drive aftermarket connected car market as well. This will extend to electric vehicles, autonomous vehicles, robo taxis, ride hailing services and more. .
To speak to our analyst for a discussion on the above findings, click Speak to Analyst
TABLE OF CONTENTS
1 INTRODUCTION (Page No. - 23)
1.1 OBJECTIVES
1.2 MARKET DEFINITION
1.2.1 INCLUSIONS & EXCLUSIONS
TABLE 1 SEGMENT-WISE INCLUSIONS & EXCLUSIONS
1.3 MARKET SCOPE
FIGURE 1 MARKET SEGMENTATION: CONNECTED CAR MARKET
FIGURE 2 MARKET: BY REGION
1.4 SUMMARY OF CHANGES
2 RESEARCH METHODOLOGY (Page No. - 27)
2.1 RESEARCH DATA
FIGURE 3 MARKET: RESEARCH DESIGN
FIGURE 4 RESEARCH METHODOLOGY MODEL
2.1.1 SECONDARY DATA
2.1.1.1 List of key secondary sources to estimate base numbers
2.1.1.2 List of key secondary connected car sources
2.1.1.3 Key data from secondary sources
2.1.2 PRIMARY DATA
FIGURE 5 BREAKDOWN OF PRIMARY INTERVIEWS
2.1.2.1 Sampling techniques & data collection methods
2.2 MARKET SIZE ESTIMATION
FIGURE 6 RESEARCH METHODOLOGY: HYPOTHESIS BUILDING
2.2.1 BOTTOM-UP APPROACH: MARKET, BY SERVICE (ICE AND ELECTRIC VEHICLES)
FIGURE 7 BOTTOM-UP APPROACH: GLOBAL MARKET
FIGURE 8 BOTTOM-UP APPROACH: GLOBAL MARKET (BY FORM TYPE)
2.2.2 TOP-DOWN APPROACH: MARKET
FIGURE 9 TOP-DOWN APPROACH: GLOBAL CAR MARKET, BY TRANSPONDER
FIGURE 10 TOP-DOWN APPROACH: GLOBAL MARKET, BY HARDWARE
FIGURE 11 TOP-DOWN APPROACH: GLOBAL MARKET, BY NETWORK
FIGURE 12 TOP-DOWN APPROACH: GLOBAL MARKET, BY END MARKET
FIGURE 13 MARKET: RESEARCH DESIGN & METHODOLOGY
2.2.3 FACTOR ANALYSIS FOR MARKET SIZING: DEMAND AND SUPPLY-SIDE
2.3 FACTOR ANALYSIS
2.4 MARKET BREAKDOWN AND DATA TRIANGULATION
FIGURE 14 DATA TRIANGULATION
2.5 GLOBAL ASSUMPTIONS
2.6 ASSUMPTIONS
2.7 RESEARCH LIMITATIONS
3 EXECUTIVE SUMMARY (Page No. - 46)
3.1 PRE- VS POST-COVID-19 SCENARIO
FIGURE 15 PRE- & POST-COVID-19 SCENARIO: MARKET SIZE, 2018–2026 (USD MILLION)
TABLE 2 MARKET SIZE: PRE- VS. POST-COVID-19 SCENARIO, 2018–2026 (USD MILLION)
3.2 REPORT SUMMARY
FIGURE 16 GLOBAL CAR MARKET OVERVIEW, 2021–2026
FIGURE 17 GLOBAL CAR MARKET, BY REGION, 2021 VS. 2026 (USD MILLION)
4 PREMIUM INSIGHTS (Page No. - 50)
4.1 ATTRACTIVE OPPORTUNITIES IN MARKET
FIGURE 18 GOVERNMENT REGULATIONS MANDATING SAFETY FEATURES, INCREASING PENETRATION OF CONNECTED CARS, AND DEMAND FOR INTERNET-BASED SMARTPHONE SOLUTIONS TO DRIVE MARKET DURING FORECAST PERIOD
4.2 GLOBAL MARKET, BY FORM TYPE
FIGURE 19 EMBEDDED SEGMENT ESTIMATED TO LEAD MARKET DURING FORECAST PERIOD DUE TO ITS POPULARITY IN NORTH AMERICA AND EUROPE
4.3 GLOBAL MARKET, BY SERVICE
FIGURE 20 CYBERSECURITY SEGMENT ESTIMATED TO BE LARGEST SERVICE SEGMENT BY 2026 AS CONNECTED CARS ARE PRONE TO HACKING
4.4 GLOBAL MARKET, BY END MARKET
FIGURE 21 OE MARKET TO HOLD LARGER MARKET SHARE DURING FORECAST PERIOD (2021-2026)
4.5 GLOBAL MARKET, BY HARDWARE
FIGURE 22 ECU SEGMENT ESTIMATED TO ACCOUNT FOR LARGEST SHARE IN CONNECTED CAR HARDWARE DURING FORECAST PERIOD
4.6 GLOBAL MARKET, BY TRANSPONDER
FIGURE 23 ONBOARD UNIT SEGMENT TO WITNESS HIGHER GROWTH RATE DURING FORECAST PERIOD
4.7 GLOBAL MARKET, BY NETWORK
FIGURE 24 CELLULAR SEGMENT EXPECTED TO HOLD LARGER MARKET SHARE DURING FORECAST PERIOD
4.8 CONNECTED ELECTRIC CAR MARKET, BY VEHICLE TYPE
FIGURE 25 BEV SEGMENT TO HOLD LARGEST MARKET SHARE AND WITNESS HIGHEST GROWTH RATE DURING FORECAST PERIOD
4.9 GLOBAL MARKET, BY REGION
FIGURE 26 ASIA PACIFIC ESTIMATED TO LEAD MARKET IN 2021
5 MARKET OVERVIEW (Page No. - 55)
5.1 INTRODUCTION
5.2 MARKET DYNAMICS
FIGURE 27 CONNECTED CAR: MARKET DYNAMICS
5.2.1 DRIVERS
5.2.1.1 Regulations mandating advanced features for enhanced user comfort, safety, and convenience
TABLE 3 CURRENT AND UPCOMING SAFETY REGULATIONS FOR CONNECTED CARS IN US AND EUROPE
FIGURE 28 AUTOMOTIVE ADAS MARKET, BY REGION, 2021 VS. 2026 (USD MILLION)
5.2.1.2 Continuous developments in connected car technology and growing collaborations between OEMs and software & hardware providers
5.2.1.3 Reduction in fuel consumption
FIGURE 29 GLOBAL FUEL ECONOMY AND CO2 EMISSION DATA (2016–2025)
5.2.1.4 Increasing adoption of telematics and usage-based insurance
FIGURE 30 AUTOMOTIVE USER-BASED INSURANCE MARKET, 2021 VS. 2026 (USD MILLION)
FIGURE 31 AUTOMOTIVE TELEMATICS MARKET, 2020 VS. 2025 (USD MILLION)
5.2.2 RESTRAINTS
5.2.2.1 Lack of infrastructure for proper functioning of connected cars
5.2.3 OPPORTUNITIES
5.2.3.1 Emergence of various technologies, such as 5G and AI
5.2.3.1.1 5G
5.2.3.1.2 Artificial Intelligence (AI)
FIGURE 32 AUTOMOTIVE AND TRANSPORTATION 5G SERVICES MARKET, 2021 VS. 2026 (USD BILLION)
FIGURE 33 TRANSPORTATION ARTIFICIAL INTELLIGENCE MARKET, 2021 VS. 2026 (USD BILLION)
5.2.3.2 Developments in autonomous vehicles
FIGURE 34 L3 AND L4 AUTONOMOUS CAR MARKET, US, 2018 VS. 2022 VS. 2025 (THOUSAND UNITS)
5.2.3.3 Developments of ride-sharing and mobility services
FIGURE 35 MOBILITY-AS-A-SERVICE MARKET, BY REGION, 2021 VS. 2030 (USD MILLION)
FIGURE 36 RIDE SHARING MARKET, BY REGION, 2021 VS. 2026 (USD MILLION)
5.2.4.1 Cybersecurity
FIGURE 37 TOP SMART MOBILITY ATTACK VENDORS
5.2.5 COVID-19 IMPACT ON GLOBAL MARKET
5.2.6 REVENUE SHIFT DRIVING MARKET GROWTH
5.3 MARKET, SCENARIOS (2018–2026)
FIGURE 38 MARKET: COVID-19 SCENARIO ANALYSIS
5.3.1 MOST LIKELY SCENARIO
TABLE 4 MOST LIKELY SCENARIO: GLOBAL MARKET, BY REGION, 2018–2026 (USD MILLION)
5.3.2 HIGH COVID-19 IMPACT SCENARIO
TABLE 5 HIGH IMPACT SCENARIO: GLOBAL MARKET, BY REGION, 2018–2026 (USD MILLION)
5.3.3 LOW COVID-19 IMPACT SCENARIO
TABLE 6 LOW IMPACT SCENARIO: GLOBAL MARKET, BY REGION, 2018–2026 (USD MILLION)
5.4 PATENT ANALYSIS
5.5 ECOSYSTEM/MARKET MAP
TABLE 7 MARKET: ECOSYSTEM
5.6 CASE STUDY ANALYSIS, BY COGNIZANT
5.7 TECHNOLOGY ANALYSIS
5.8 VALUE CHAIN ANALYSIS
FIGURE 39 CONNECTED CAR VALUE CHAIN
5.9 AVERAGE SELLING PRICE ANALYSIS
TABLE 8 MARKET: AVERAGE OE PRICE RANGE (USD) ANALYSIS, BY FORM TYPE, 2021
5.10 PORTER’S FIVE FORCES ANALYSIS
TABLE 9 PORTER’S 5 FORCES IMPACT ON MARKET
FIGURE 40 PORTER’S FIVE FORCES ANALYSIS
5.10.1 THREAT OF NEW ENTRANTS
5.10.2 THREAT OF SUBSTITUTES
5.10.3 BARGAINING POWER OF SUPPLIERS
5.10.4 BARGAINING POWER OF BUYERS
5.10.5 INTENSITY OF COMPETITIVE RIVALRY
6 CONNECTED CAR MARKET, BY SERVICE (Page No. - 78)
The market size and forecast of each connected car service is further segmented into regions – Asia Pacific, Europe, North America and RoW
6.1 INTRODUCTION
6.1.1 RESEARCH METHODOLOGY
6.1.2 ASSUMPTIONS
6.1.3 PRIMARY INSIGHTS
6.2 OPERATIONAL DATA
6.2.1 FEATURES OF VARIOUS MAJOR CONNECTED CAR SERVICES OFFERED BY OEMS
TABLE 10 CONNECTED CAR, BY SERVICE, FEATURES OFFERED BY OEMS
FIGURE 41 MARKET, BY SERVICE, 2021 VS. 2026 (USD MILLION)
TABLE 11 MARKET, BY SERVICE, 2018–2020 (USD MILLION)
TABLE 12 MARKET, BY SERVICE, 2021–2026 (USD MILLION)
6.3 NAVIGATION
6.3.1 GROWING DEMAND FOR ROUTE TRACKING AND REAL-TIME TRAFFIC MONITORING WILL BOOST MARKET
TABLE 13 MARKET, BY REGION, 2018–2020 (USD MILLION)
TABLE 14 MARKET, BY REGION, 2021–2026 (USD MILLION)
6.4 REMOTE DIAGNOSTICS
6.4.1 NEED FOR REDUCING VEHICLE DOWNTIME AND MAINTENANCE COSTS WILL FUEL MARKET
TABLE 15 MARKET, BY REGION, 2018–2020 (USD MILLION)
TABLE 16 MARKET, BY REGION, 2021–2026 (USD MILLION)
6.5 MULTIMEDIA STREAMING
6.5.1 INCREASE IN DEMAND FOR ENTERTAINMENT FEATURES TO DRIVE MARKET
TABLE 17 MARKET, BY REGION, 2018–2020 (USD MILLION)
TABLE 18 MARKET, BY REGION, 2021–2026 (USD MILLION)
6.6 SOCIAL MEDIA & OTHER APPS
6.6.1 EXTENSIVE USAGE OF SOCIAL MEDIA AND OTHER APPS TO DRIVE MARKET
TABLE 19 MARKET, BY REGION, 2018–2020 (USD MILLION)
TABLE 20 MARKET, BY REGION, 2021–2026 (USD MILLION)
6.7 OTA UPDATES
6.7.1 EASY DEPLOYMENT OF SOFTWARE UPDATES ELIMINATES RISK OF RECALL AND OFFER COST REDUCTION
TABLE 21 MARKET, BY REGION, 2018–2020 (USD MILLION)
TABLE 22 MARKET, BY REGION, 2021–2026 (USD MILLION)
6.8 ON-ROAD ASSISTANCE
6.8.1 NEED FOR ASSISTANCE WHILE DRIVING IN TERMS OF BREAKDOWN AND OTHER VEHICLE HEALTH ISSUES WILL BOOST MARKET
TABLE 23 MARKET, BY REGION, 2018–2020 (USD MILLION)
TABLE 24 MARKET, BY REGION, 2021–2026 (USD MILLION)
6.9 E-CALL & SOS ASSISTANCE
6.9.1 DEMAND FOR EMERGENCY SERVICES AND SAFETY REGULATIONS WILL DRIVE MARKET
TABLE 25 MARKET, BY REGION, 2018–2020 (USD MILLION)
TABLE 26 MARKET, BY REGION, 2021–2026 (USD MILLION)
6.10 CYBERSECURITY
6.10.1 DEMAND FOR DATA PRIVACY AND SECURITY OF INFORMATION WILL DRIVE CYBERSECURITY MARKET
TABLE 27 MARKET, BY REGION, 2018–2020 (USD MILLION)
TABLE 28 MARKET, BY REGION, 2021–2026 (USD MILLION)
6.11 REMOTE OPERATION
6.11.1 INCREASE IN DEMAND FOR ADVANCED SAFETY & COMFORT FEATURES WILL DRIVE MARKET
TABLE 29 MARKET, BY REGION, 2018–2020 (USD MILLION)
TABLE 30 MARKET, BY REGION, 2021–2026 (USD MILLION)
6.12 COLLISION WARNING
6.12.1 INCREASE IN GOVERNMENT REGULATIONS ON SAFETY FEATURES WOULD DRIVE MARKET
TABLE 31 MARKET, BY REGION, 2018–2020 (USD MILLION)
TABLE 32 MARKET, BY REGION, 2021–2026 (USD MILLION)
6.13 AUTO PARKING/CONNECTED PARKING
6.13.1 NEED FOR IMPROVED UTILIZATION OF AVAILABLE PARKING SPACES WILL DRIVE MARKET
TABLE 33 MARKET, BY REGION, 2018–2020 (USD MILLION)
TABLE 34 MARKET, BY REGION, 2021–2026 (USD MILLION)
6.14 AUTOPILOT
6.14.1 CONNECTED AUTONOMOUS CARS TO DRIVE MARKET
TABLE 35 MARKET, BY REGION, 2021–2026 (USD MILLION)
6.15 HOME INTEGRATION
6.15.1 USE OF IOT IN HOMES WILL DRIVE MARKET
TABLE 36 MARKET, BY REGION, 2018–2020 (USD MILLION)
TABLE 37 MARKET, BY REGION, 2021–2026 (USD MILLION)
6.16 VEHICLE MANAGEMENT
6.16.1 TRENDS TOWARDS VEHICLE SHARING AND SELF-DRIVING VEHICLES DRIVING DEMAND FOR VEHICLE MANAGEMENT SERVICES
TABLE 38 MARKET, BY REGION, 2018–2020 (USD MILLION)
TABLE 39 MARKET, BY REGION, 2021–2026 (USD MILLION)
6.17 ASSET TRACKING
6.17.1 HIGH DEMAND FOR SECURITY AND TRACKING FACILITIES BY FLEET OPERATORS TO DRIVE MARKET
TABLE 40 MARKET, BY REGION, 2018–2020 (USD MILLION)
TABLE 41 MARKET, BY REGION, 2021–2026 (USD MILLION)
7 CONNECTED CAR MARKET, BY FORM TYPE (Page No. - 100)
The market size and forecast of each form type is further segmented into regions – Asia Pacific, Europe, North America and RoW
7.1 INTRODUCTION
7.1.1 RESEARCH METHODOLOGY
7.1.2 ASSUMPTIONS
7.1.3 PRIMARY INSIGHTS
FIGURE 42 MARKET, BY FORM TYPE, 2021 VS. 2026 (USD MILLION)
7.2 OPERATIONAL DATA
7.2.1 FEATURES OF VARIOUS CONNECTED CARS IN TERMS OF CONNECTIVITY FORM
TABLE 42 CONNECTED CAR, BY FORM TYPE, FEATURES
TABLE 43 MARKET, BY FORM TYPE, 2018–2020 (‘000 UNITS)
TABLE 44 MARKET, BY FORM TYPE, 2021–2026 (‘000 UNITS)
TABLE 45 MARKET, BY FORM TYPE, 2018–2020 (USD MILLION)
TABLE 46 MARKET, BY FORM TYPE, 2021–2026 (USD MILLION)
7.3 EMBEDDED
7.3.1 REDUCTION IN PRICES FOR SERVICE PLANS AND TELEMATICS REGULATIONS WILL DRIVE MARKET
TABLE 47 EMBEDDED: MARKET, BY REGION, 2018–2020 (‘000 UNITS)
TABLE 48 MARKET, BY REGION, 2021–2026 (‘000 UNITS)
TABLE 49 MARKET, BY REGION, 2018–2020 (USD MILLION)
TABLE 50 MARKET, BY REGION, 2021–2026 (USD MILLION)
7.4 TETHERED
7.4.1 LESS COSTLY IN-VEHICLE HARDWARE AND DIRECT ALLOCATION OF SERVICE CONNECTIVITY EXPECTED TO DRIVE MARKET
TABLE 51 TETHERED: MARKET, BY REGION, 2018–2020 (‘000 UNITS)
TABLE 52 MARKET, BY REGION, 2021–2026 (‘000 UNITS)
TABLE 53 MARKET, BY REGION, 2018–2020 (USD MILLION)
TABLE 54 MARKET, BY REGION, 2021–2026 (USD MILLION)
7.5 INTEGRATED
7.5.1 DEVELOPMENT OF APPS FOR EASY INTEGRATION EXPECTED TO DRIVE MARKET GROWTH
TABLE 55 INTEGRATED: MARKET, BY REGION, 2018–2020 (‘000 UNITS)
TABLE 56 MARKET, BY REGION, 2021–2026 (‘000 UNITS)
TABLE 57 MARKET, BY REGION, 2018–2020 (USD MILLION)
TABLE 58 MARKET, BY REGION, 2021–2026 (USD MILLION)
8 CONNECTED CAR MARKET, BY END MARKET (Page No. - 110)
The market size and forecast of end market is further segmented into regions – Asia Pacific, Europe, North America and RoW
8.1 INTRODUCTION
8.1.1 RESEARCH METHODOLOGY
8.1.2 ASSUMPTIONS
8.1.3 PRIMARY INSIGHTS
FIGURE 43 MARKET, BY END MARKET, 2021 VS. 2026 (USD MILLION)
TABLE 59 MARKET, BY END MARKET, 2018–2020 (USD MILLION)
TABLE 60 MARKET, BY END MARKET, 2021–2026 (USD MILLION)
8.2 ORIGINAL EQUIPMENT MANUFACTURER (OEM)
8.2.1 INCREASE IN DEMAND FOR SAFETY AND SECURITY SERVICES WILL DRIVE OEM MARKET
TABLE 61 CONNECTED CAR OE MARKET, BY REGION, 2018–2020 (USD MILLION)
TABLE 62 CONNECTED CAR OE MARKET, BY REGION, 2021–2026 (USD MILLION)
8.3 AFTERMARKET
8.3.1 WILLINGNESS OF CUSTOMERS TO PAY FOR COMFORT AND SAFETY SERVICES WILL FUEL AFTERMARKET
TABLE 63 CONNECTED CAR AFTERMARKET, BY REGION, 2018–2020 (USD MILLION)
TABLE 64 CONNECTED CAR AFTERMARKET, BY REGION, 2021–2026 (USD MILLION)
9 CONNECTED CAR MARKET, BY HARDWARE (Page No. - 116)
The market size and forecast of each hardware is further segmented into regions – Asia Pacific, Europe, North America and RoW
9.1 INTRODUCTION
9.1.1 RESEARCH METHODOLOGY
9.1.2 ASSUMPTIONS
9.1.3 PRIMARY INSIGHTS
FIGURE 44 MARKET, BY HARDWARE, 2021 VS. 2026 (USD MILLION)
TABLE 65 MARKET, BY HARDWARE, 2018–2020 (USD MILLION)
TABLE 66 MARKET, BY HARDWARE, 2021–2026 (USD MILLION)
9.2 HEAD UNIT
9.2.1 INFOTAINMENT SYSTEMS WILL DRIVE HEAD UNIT MARKET FOR CONNECTED CARS
TABLE 67 MARKET, BY REGION, 2018–2020 (USD MILLION)
TABLE 68 MARKET, BY REGION, 2021–2026 (USD MILLION)
9.3 CENTRAL GATEWAY (CGW)
9.3.1 TRANSFORMATION IN VEHICLE NETWORK ARCHITECTURE WILL DRIVE MARKET
TABLE 69 MARKET, BY REGION, 2018–2020 (USD MILLION)
TABLE 70 MARKET, BY REGION, 2021–2026 (USD MILLION)
9.4 INTELLIGENT ANTENNA
9.4.1 DEMAND FOR SMALL AND POWERFUL ANTENNAS WILL BOOST INTELLIGENT ANTENNA MARKET
TABLE 71 MARKET, BY REGION, 2018–2020 (USD MILLION)
TABLE 72 MARKET, BY REGION, 2021–2026 (USD MILLION)
9.5 ELECTRONIC CONTROL UNIT (ECU)
9.5.1 DEMAND FOR HIGH-CAPACITY ECU WILL DRIVE MARKET IN FUTURE
TABLE 73 MARKET, BY REGION, 2018–2020 (USD MILLION)
TABLE 74 MARKET, BY REGION, 2021–2026 (USD MILLION)
9.6 TELEMATIC CONTROL UNIT (TCU)
9.6.1 ECALL MANDATE IN EUROPE AND SAFETY AND SECURITY REGULATIONS ELSEWHERE WILL BOOST TCU MARKET
TABLE 75 MARKET, BY REGION, 2018–2020 (USD MILLION)
TABLE 76 MARKET, BY REGION, 2021–2026 (USD MILLION)
9.7 KEYLESS ENTRY SYSTEM
9.7.1 NEED FOR COMFORT AND CONVENIENCE WILL DRIVE KEYLESS ENTRY SYSTEM MARKET
TABLE 77 MARKET, BY REGION, 2018–2020 (USD MILLION)
TABLE 78 MARKET, BY REGION, 2021–2026 (USD MILLION)
9.8 SENSOR
9.8.1 DEMAND FOR ADAS AND AUTONOMOUS FEATURES WILL DRIVE SENSOR MARKET
TABLE 79 MARKET, BY REGION, 2018–2020 (USD MILLION)
TABLE 80 MARKET, BY REGION, 2021–2026 (USD MILLION)
10 CONNECTED CAR MARKET, BY TRANSPONDER (Page No. - 127)
The market size and forecast of each transponder is further segmented into regions – Asia Pacific, Europe, North America and RoW
10.1 INTRODUCTION
10.1.1 RESEARCH METHODOLOGY
10.1.2 ASSUMPTIONS
10.1.3 PRIMARY INSIGHTS
FIGURE 45 MARKET, BY TRANSPONDER, 2021 VS. 2026 (USD MILLION)
TABLE 81 MARKET, BY TRANSPONDER, 2018–2020 (‘000 UNITS)
TABLE 82 MARKET, BY TRANSPONDER, 2021–2026 (‘000 UNITS)
TABLE 83 MARKET, BY TRANSPONDER, 2018–2020 (USD MILLION)
TABLE 84 MARKET, BY TRANSPONDER, 2021–2026 (USD MILLION)
10.2 ONBOARD UNIT
10.2.1 DEMAND FOR SAFETY AND V2V COMMUNICATION WILL DRIVE MARKET
TABLE 85 MARKET, BY REGION, 2018–2020 (‘000 UNITS)
TABLE 86 MARKET, BY REGION, 2021–2026 (‘000 UNITS)
TABLE 87 MARKET, BY REGION, 2018–2020 (USD MILLION)
TABLE 88 MARKET, BY REGION, 2021–2026 (USD MILLION)
10.3 ROADSIDE UNIT
10.3.1 SMART CITIES WILL DRIVE ROADSIDE UNIT MARKET
TABLE 89 MARKET, BY REGION, 2018–2020 (‘000 UNITS)
TABLE 90 MARKET, BY REGION, 2021–2026 (‘000 UNITS)
TABLE 91 MARKET, BY REGION, 2018–2020 (USD MILLION)
TABLE 92 MARKET, BY REGION, 2021–2026 (USD MILLION)
11 CONNECTED CAR MARKET, BY NETWORK (Page No. - 135)
The market size and forecast of each network is further segmented into regions – Asia Pacific, Europe, North America and RoW
11.1 INTRODUCTION
11.1.1 RESEARCH METHODOLOGY
11.1.2 ASSUMPTIONS
11.1.3 PRIMARY INSIGHTS
11.2 OPERATIONAL DATA
TABLE 93 COMPARISON BETWEEN DSRC AND CELLULAR FOR V2X COMMUNICATION
FIGURE 46 MARKET, BY NETWORK, 2021 VS. 2026 (‘000 UNITS)
TABLE 94 MARKET, BY NETWORK, 2018–2020 (‘000 UNITS)
TABLE 95 MARKET, BY NETWORK, 2021–2026 (‘000 UNITS)
11.3 DEDICATED SHORT RANGE COMMUNICATION (DSRC)
11.3.1 V2X COMMUNICATION WILL DRIVE DSRC MARKET
TABLE 96 DSRC MARKET, BY REGION, 2018–2020 (‘000 UNITS)
TABLE 97 DSRC MARKET, BY REGION, 2021–2026 (‘000 UNITS)
11.4 CELLULAR
11.4.1 ADVENT OF 5G NETWORK WILL DRIVE CELLULAR MARKET
11.4.1.1 4G
11.4.1.2 5G
TABLE 98 CELLULAR MARKET, BY REGION, 2018–2020 (‘000 UNITS)
TABLE 99 CELLULAR MARKET, BY REGION, 2021–2026 (‘000 UNITS)
12 CONNECTED CAR MARKET, BY REGION (Page No. - 142)
The market size and forecast of each country is further segmented into service – navigation, remote diagnostics, multimedia streaming, social media & apps, OTA updates, on-road assistance, eCall & SOS assistance, cybersecurity, remote operation, collision warning, auto parking/connected parking, autopilot, home integration, vehicle management, and asset tracking
12.1 INTRODUCTION
12.1.1 RESEARCH METHODOLOGY
12.1.2 ASSUMPTIONS/LIMITATIONS
12.1.3 PRIMARY INSIGHTS
FIGURE 47 MARKET, BY REGION, 2021 VS. 2026 (USD MILLION)
TABLE 100 MARKET, BY REGION, 2018–2020 (USD MILLION)
TABLE 101 MARKET, BY REGION, 2021–2026 (USD MILLION)
12.2 ASIA PACIFIC
FIGURE 48 ASIA PACIFIC: MARKET SNAPSHOT
TABLE 102 ASIA PACIFIC: MARKET, BY COUNTRY, 2018–2020 (USD MILLION)
TABLE 103 ASIA PACIFIC: MARKET, BY COUNTRY, 2021–2026 (USD MILLION)
12.2.1 CHINA
12.2.1.1 Automakers launching models with 5G and collaborations between telecommunication players and tech giants will drive market
TABLE 104 CHINA: MARKET, BY SERVICE, 2018–2020 (USD MILLION)
TABLE 105 CHINA: MARKET, BY SERVICE, 2021–2026 (USD MILLION)
12.2.2 INDIA
12.2.2.1 Demand for infotainment and navigation will drive market
TABLE 106 INDIA: MARKET, BY SERVICE, 2018–2020 (USD MILLION)
TABLE 107 INDIA: MARKET, BY SERVICE, 2021–2026 (USD MILLION)
12.2.3 JAPAN
12.2.3.1 Government’s push to develop autonomous cars and investment to develop next-generation communications devices will boost market
TABLE 108 JAPAN: MARKET, BY SERVICE, 2018–2020 (USD MILLION)
TABLE 109 JAPAN: MARKET, BY SERVICE, 2021–2026 (USD MILLION)
12.2.4 SOUTH KOREA
12.2.4.1 Increasing sales of connected car models and developments in autonomous vehicles will drive market
TABLE 110 SOUTH KOREA: MARKET, BY SERVICE, 2018–2020 (USD MILLION)
TABLE 111 SOUTH KOREA: MARKET, BY SERVICE, 2021–2026 (USD MILLION)
12.2.5 THAILAND
12.2.5.1 Efforts towards self-driving taxis backed by government will drive adoption of connectivity in automobiles
TABLE 112 THAILAND: MARKET, BY SERVICE, 2018–2020 (USD MILLION)
TABLE 113 THAILAND: MARKET, BY SERVICE, 2021–2026 (USD MILLION)
12.2.6 REST OF ASIA PACIFIC
12.2.6.1 Rolling out services such as OTA updates and voice recognition technology will drive market
TABLE 114 REST OF ASIA PACIFIC: MARKET, BY SERVICE, 2018–2020 (USD MILLION)
TABLE 115 REST OF ASIA PACIFIC: MARKET, BY SERVICE, 2021–2026 (USD MILLION)
12.3 EUROPE
FIGURE 49 EUROPE: MARKET, 2021 VS. 2026 (USD MILLION)
TABLE 116 EUROPE: MARKET, BY COUNTRY, 2018–2020 (USD MILLION)
TABLE 117 EUROPE: MARKET, BY COUNTRY, 2021–2026 (USD MILLION)
12.3.1 GERMANY
12.3.1.1 Increased R&D and government bill supporting automated driving will drive market
TABLE 118 GERMANY: MARKET, BY SERVICE, 2018–2020 (USD MILLION)
TABLE 119 GERMANY: MARKET, BY SERVICE, 2021–2026 (USD MILLION)
12.3.2 FRANCE
12.3.2.1 Adoption of advanced ADAS features and government regulations permitting automated driving will drive market
TABLE 120 FRANCE: MARKET, BY SERVICE, 2018–2020 (USD MILLION)
TABLE 121 FRANCE: MARKET, BY SERVICE, 2021–2026 (USD MILLION)
12.3.3 UK
12.3.3.1 Customer shift towards premium vehicles will increase adoption of connected cars
TABLE 122 UK: MARKET, BY SERVICE, 2018–2020 (USD MILLION)
TABLE 123 UK: MARKET, BY SERVICE, 2021–2026 (USD MILLION)
12.3.4 SPAIN
12.3.4.1 Launches of enhanced connected car solutions to drive market
TABLE 124 SPAIN: MARKET, BY SERVICE, 2018–2020 (USD MILLION)
TABLE 125 SPAIN: MARKET, BY SERVICE, 2021–2026 (USD MILLION)
12.3.5 ITALY
12.3.5.1 Developments and investments in smart road infrastructure will drive market
TABLE 126 ITALY: MARKET, BY SERVICE, 2018–2020 (USD MILLION)
TABLE 127 ITALY: MARKET, BY SERVICE, 2021–2026 (USD MILLION)
12.3.6 RUSSIA
12.3.6.1 Embedded connectivity will drive market
TABLE 128 RUSSIA: MARKET, BY SERVICE, 2018–2020 (USD MILLION)
TABLE 129 RUSSIA: MARKET, BY SERVICE, 2021–2026 (USD MILLION)
12.3.7 REST OF EUROPE
12.3.7.1 5G connectivity and services will drive market
TABLE 130 REST OF EUROPE: MARKET, BY SERVICE, 2018–2020 (USD MILLION)
TABLE 131 REST OF EUROPE: MARKET, BY SERVICE, 2021–2026 (USD MILLION)
12.4 NORTH AMERICA
FIGURE 50 NORTH AMERICA: MARKET, SNAPSHOT
TABLE 132 NORTH AMERICA: MARKET, BY COUNTRY, 2018–2020 (USD MILLION)
TABLE 133 NORTH AMERICA: MARKET, BY COUNTRY, 2021–2026 (USD MILLION)
12.4.1 US
12.4.1.1 High penetration of internet to drive market in US
TABLE 134 US: MARKET, BY SERVICE, 2018–2020 (USD MILLION)
TABLE 135 US: MARKET, BY SERVICE, 2021–2026 (USD MILLION)
12.4.2 CANADA
12.4.2.1 Growing popularity of mobile broadband access in vehicles driving launches of connected cars
TABLE 136 CANADA: MARKET, BY SERVICE, 2018–2020 (USD MILLION)
TABLE 137 CANADA: MARKET, BY SERVICE, 2021–2026 (USD MILLION)
12.4.3 MEXICO
12.4.3.1 Partnerships between telecommunications companies and automakers to drive popularity of connected cars
TABLE 138 MEXICO: MARKET, BY SERVICE, 2018–2020 (USD MILLION)
TABLE 139 MEXICO: MARKET, BY SERVICE, 2021–2026 (USD MILLION)
12.5 REST OF THE WORLD
FIGURE 51 ROW: MARKET, BY COUNTRY, 2021 VS. 2026 (USD MILLION)
TABLE 140 ROW: MARKET, BY COUNTRY, 2018–2020 (USD MILLION)
TABLE 141 ROW: MARKET, BY COUNTRY, 2021–2026 (USD MILLION)
12.5.1 BRAZIL
12.5.1.1 Car tracking and safety features will drive market
TABLE 142 BRAZIL: MARKET, BY SERVICE, 2018–2020 (USD MILLION)
TABLE 143 BRAZIL: MARKET, BY SERVICE, 2021–2026 (USD MILLION)
12.5.2 ARGENTINA
12.5.2.1 Government initiatives and investment to support internet infrastructure expected to drive adoption of connectivity in cars
TABLE 144 ARGENTINA: MARKET, BY SERVICE, 2018–2020 (USD MILLION)
TABLE 145 ARGENTINA: MARKET, BY SERVICE, 2021–2026 (USD MILLION)
12.5.3 IRAN
12.5.3.1 Domestic production of premium and luxury cars expected to drive market in Iran
TABLE 146 IRAN: MARKET, BY SERVICE, 2018–2020 (USD MILLION)
TABLE 147 IRAN: MARKET, BY SERVICE, 2021–2026 (USD MILLION)
12.5.4 REST OF ROW
12.5.4.1 Demand for advanced mobility solutions and development of 5G infrastructure will drive market
TABLE 148 REST OF ROW: MARKET, BY SERVICE, 2018–2020 (USD MILLION)
TABLE 149 REST OF ROW: MARKET, BY SERVICE, 2021–2026 (USD MILLION)
13 CONNECTED ELECTRIC CAR MARKET, BY VEHICLE TYPE (Page No. - 193)
The market size and forecast of each connected electric vehicle type is further segmented into service – navigation, remote diagnostics, multimedia streaming, social media & apps, OTA updates, on-road assistance, eCall & SOS assistance, cybersecurity, remote operation, collision warning, auto parking/connected parking, autopilot, home integration, vehicle management, and asset tracking
13.1 INTRODUCTION
13.1.1 RESEARCH METHODOLOGY
13.1.2 ASSUMPTIONS
13.1.3 PRIMARY INSIGHTS
FIGURE 52 CONNECTED ELECTRIC CAR MARKET, BY VEHICLE TYPE, 2021 VS. 2026 (USD MILLION)
TABLE 150 MARKET, BY VEHICLE TYPE, 2018–2020 (USD MILLION)
TABLE 151 MARKET, BY VEHICLE TYPE, 2021–2026 (USD MILLION)
13.2 BEV
13.2.1 INCREASING INVESTMENT BY AUTOMAKERS TO ELECTRIFY THEIR PRODUCT LINE TO DRIVE DEVELOPMENTS IN MARKET
TABLE 152 BEV: MARKET, BY SERVICE, 2018–2020 (USD MILLION)
TABLE 153 MARKET, BY SERVICE, 2021–2026 (USD MILLION)
13.3 PLUG-IN HYBRID ELECTRIC VEHICLE
13.3.1 GROWING SALES OF PHEVS IN EUROPE AND STRINGENT SAFETY STANDARDS TO DRIVE CONNECTED PHEV MARKET
TABLE 154 PHEV: MARKET, BY SERVICE, 2018–2020 (USD MILLION)
TABLE 155 MARKET, BY SERVICE, 2021–2026 (USD MILLION)
13.4 FUEL CELL ELECTRIC VEHICLE
13.4.1 LAUNCH OF FCEV MODELS WITH ADVANCED SAFETY FEATURES LIKELY TO BOOST CONNECTED FCEV MARKET
TABLE 156 FCEV: MARKET, BY SERVICE, 2018–2020 (USD MILLION)
TABLE 157 MARKET, BY SERVICE, 2021–2026 (USD MILLION)
14 CONNECTED CAR TECHNOLOGY: BY APPLICATION (Page No. - 203)
14.1 DATA CAPTURE AND MANAGEMENT (DCM)
14.2 DYNAMIC MOBILITY
14.3 ROAD WEATHER MANAGEMENT
14.4 REAL-TIME INFORMATION SYNTHESIS
14.5 VEHICLE HEALTH MONITORING
15 COMPETITIVE LANDSCAPE (Page No. - 206)
15.1 OVERVIEW
FIGURE 53 COMPANIES ADOPTED NEW PRODUCT DEVELOPMENT AS KEY GROWTH STRATEGY, 2019–2021
15.2 REVENUE ANALYSIS OF TOP FOUR PLAYERS, 2018-2020
15.3 MARKET SHARE ANALYSIS
TABLE 158 MARKET STRUCTURE, 2020
FIGURE 54 MARKET SHARE ANALYSIS, 2020
15.4 COMPETITIVE LEADERSHIP MAPPING
15.4.1 TERMINOLOGY
15.4.2 STARS
15.4.3 EMERGING LEADERS
15.4.4 PERVASIVE
15.4.5 PARTICIPANT
15.5 COMPETITIVE LEADERSHIP MAPPING - CONNECTED CAR SOLUTION PROVIDERS
FIGURE 55 CONNECTED CAR SOLUTION PROVIDERS: COMPETITIVE LEADERSHIP MAPPING, 2020
TABLE 159 MARKET: COMPANY FOOTPRINT (SOLUTIONS)
TABLE 160 COMPANY TECHNOLOGY FOOTPRINT (SOLUTIONS)
TABLE 161 COMPANY REGION FOOTPRINT (SOLUTIONS)
15.6 COMPETITIVE LEADERSHIP MAPPING: CONNECTED CAR MANUFACTURERS
FIGURE 56 CONNECTED CAR MANUFACTURERS: COMPETITIVE LEADERSHIP MAPPING, 2020
TABLE 162 COMPANY CONNECTED CAR SERVICE FOOTPRINT (OEM)
TABLE 163 COMPANY REGION FOOTPRINT (OEM)
TABLE 164 MARKET: COMPANY FOOTPRINT (OEM)
15.7 COMPETITIVE SCENARIO
15.7.1 NEW PRODUCT DEVELOPMENTS/LAUNCHES
TABLE 165 NEW PRODUCT DEVELOPMENTS/LAUNCHES, 2020–2021
15.7.2 EXPANSIONS
TABLE 166 EXPANSIONS, 2019-2020
15.7.3 ACQUISITIONS
TABLE 167 ACQUISITIONS, 2021
15.7.4 PARTNERSHIPS/CONTRACTS
TABLE 168 PARTNERSHIPS/CONTRACTS/STRATEGIC COOPERATION, 2019–2021
16 COMPANY PROFILES (Page No. - 221)
The Business Overview, Recent Financials, Products Offered, and Recent Developments are covered for Top 10 Connected Car Solution and Hardware Suppliers and OEMs, where financial information is provided for listed companies only MnM View is covered for top 5 Connected Car Hardware Suppliers
Profiles of ‘Other players’ cover Business Overview, Products Offered and Company’s Regional Presence
(Business Overview, Products Offered, Recent Developments, MNM view) *
16.1 KEY PLAYERS
16.1.1 CONTINENTAL AG
TABLE 169 CONTINENTAL AG: BUSINESS OVERVIEW
FIGURE 57 CONTINENTAL AG: COMPANY SNAPSHOT
TABLE 170 CONTINENTAL AG: PRODUCTS OFFERED
TABLE 171 CONTINENTAL AG: NEW PRODUCT DEVELOPMENTS
TABLE 172 CONTINENTAL AG: DEALS
TABLE 173 CONTINENTAL AG: OTHER DEVELOPMENTS
16.1.2 BOSCH
TABLE 174 BOSCH: BUSINESS OVERVIEW
FIGURE 58 BOSCH: COMPANY SNAPSHOT
TABLE 175 BOSCH: PRODUCTS OFFERED
TABLE 176 BOSCH: NEW PRODUCT DEVELOPMENTS
TABLE 177 BOSCH: DEALS
TABLE 178 BOSCH: OTHER DEVELOPMENTS
16.1.3 HARMAN
TABLE 179 HARMAN: BUSINESS OVERVIEW
FIGURE 59 HARMAN: COMPANY SNAPSHOT
TABLE 180 HARMAN: PRODUCTS OFFERED
TABLE 181 HARMAN: NEW PRODUCT DEVELOPMENTS
TABLE 182 HARMAN: DEALS
TABLE 183 HARMAN: OTHER DEVELOPMENTS
16.1.4 VISTEON
TABLE 184 VISTEON: BUSINESS OVERVIEW
FIGURE 60 VISTEON: COMPANY SNAPSHOT
TABLE 185 VISTEON: PRODUCTS OFFERED
TABLE 186 VISTEON: NEW PRODUCT DEVELOPMENTS
TABLE 187 VISTEON: DEALS
TABLE 188 VISTEON: OTHER DEVELOPMENTS
16.1.5 AIRBIQUITY
TABLE 189 AIRBIQUITY: BUSINESS OVERVIEW
TABLE 190 AIRBIQUITY: PRODUCTS OFFERED
TABLE 191 AIRBIQUITY: NEW PRODUCT DEVELOPMENTS
TABLE 192 AIRBIQUITY: DEALS
TABLE 193 AIRBIQUITY: OTHER DEVELOPMENTS
16.1.6 CLOUDMADE
TABLE 194 CLOUDMADE: BUSINESS OVERVIEW
TABLE 195 CLOUDMADE: PRODUCTS OFFERED
TABLE 196 CLOUDMADE: DEALS
16.1.7 INTELLIAS
TABLE 197 INTELLIAS: BUSINESS OVERVIEW
TABLE 198 INTELLIAS: PRODUCTS OFFERED
TABLE 199 INTELLIAS: DEALS
TABLE 200 INTELLIAS: OTHER DEVELOPMENT
16.1.8 TESLA
TABLE 201 TESLA: BUSINESS OVERVIEW
FIGURE 61 TESLA: COMPANY SNAPSHOT
TABLE 202 TESLA: PRODUCTS OFFERED
TABLE 203 TESLA: NEW PRODUCT DEVELOPMENTS
TABLE 204 TESLA: DEALS
TABLE 205 TESLA: OTHER DEVELOPMENTS
16.1.9 FORD MOTOR COMPANY
TABLE 206 FORD MOTOR COMPANY: BUSINESS OVERVIEW
FIGURE 62 FORD MOTOR COMPANY: COMPANY SNAPSHOT
TABLE 207 FORD MOTOR COMPANY: PRODUCTS OFFERED
TABLE 208 FORD MOTOR COMPANY: NEW PRODUCT DEVELOPMENTS
TABLE 209 FORD MOTOR COMPANY: DEALS
16.1.10 AUDI
TABLE 210 AUDI: BUSINESS OVERVIEW
FIGURE 63 AUDI: COMPANY SNAPSHOT
TABLE 211 AUDI: PRODUCTS OFFERED
TABLE 212 AUDI: DEALS
TABLE 213 AUDI: OTHER DEVELOPMENTS
16.1.11 AT&T
TABLE 214 AT&T: BUSINESS OVERVIEW
FIGURE 64 AT&T: COMPANY SNAPSHOT
TABLE 215 AT&T: PRODUCTS OFFERED
TABLE 216 AT&T: DEALS
16.1.12 QUALCOMM
TABLE 217 QUALCOMM: BUSINESS OVERVIEW
FIGURE 65 QUALCOMM: COMPANY SNAPSHOT
TABLE 218 QUALCOMM: PRODUCTS OFFERED
TABLE 219 QUALCOMM: NEW PRODUCT DEVELOPMENTS
TABLE 220 QUALCOMM: DEALS
TABLE 221 QUALCOMM: OTHER DEVELOPMENTS
16.1.13 VERIZON COMMUNICATIONS
TABLE 222 VERIZON COMMUNICATIONS: BUSINESS OVERVIEW
FIGURE 66 VERIZON COMMUNICATIONS: COMPANY SNAPSHOT
TABLE 223 VERIZON COMMUNICATIONS: PRODUCTS OFFERED
TABLE 224 VERIZON COMMUNICATIONS: NEW PRODUCT DEVELOPMENTS
TABLE 225 VERIZON COMMUNICATIONS: DEALS
TABLE 226 VERIZON COMMUNICATIONS: OTHER DEVELOPMENTS
16.1.14 TOMTOM
TABLE 227 TOMTOM: BUSINESS OVERVIEW
FIGURE 67 TOMTOM: COMPANY SNAPSHOT
TABLE 228 TOMTOM: PRODUCTS OFFERED
TABLE 229 TOMTOM: NEW PRODUCT DEVELOPMENTS
TABLE 230 TOMTOM: DEALS
16.1.15 SIERRA WIRELESS
TABLE 231 SIERRA WIRELESS: BUSINESS OVERVIEW
FIGURE 68 SIERRA WIRELESS: COMPANY SNAPSHOT
TABLE 232 SIERRA WIRELESS: PRODUCTS OFFERED
TABLE 233 SIERRA WIRELESS: DEALS
16.1.16 APTIV PLC
TABLE 234 APTIV PLC: BUSINESS OVERVIEW
FIGURE 69 APTIV PLC: COMPANY SNAPSHOT
TABLE 235 APTIV PLC: PRODUCTS OFFERED
TABLE 236 APTIV PLC: NEW PRODUCT DEVELOPMENTS
TABLE 237 APTIV PLC: DEALS
16.1.17 VALEO
TABLE 238 VALEO: BUSINESS OVERVIEW
FIGURE 70 VALEO: COMPANY SNAPSHOT
TABLE 239 VALEO: PRODUCTS OFFERED
TABLE 240 VALEO: NEW PRODUCT DEVELOPMENTS
TABLE 241 VALEO: DEALS
16.2 OTHER KEY PLAYERS
16.2.1 PANASONIC
TABLE 242 PANASONIC: COMPANY OVERVIEW
16.2.2 TECH MAHINDRA
TABLE 243 TECH MAHINDRA: COMPANY OVERVIEW
16.2.3 MICROSOFT AZURE
TABLE 244 MICROSOFT AZURE: COMPANY OVERVIEW
16.2.4 ZUBIE
TABLE 245 ZUBIE: COMPANY OVERVIEW
16.2.5 BMW
TABLE 246 BMW: COMPANY OVERVIEW
16.2.6 DAIMLER AG
TABLE 247 DAIMLER AG: COMPANY OVERVIEW
16.2.7 TELEFONICA
TABLE 248 TELEFONICA: COMPANY OVERVIEW
16.2.8 LUXOFT
TABLE 249 LUXOFT: COMPANY OVERVIEW
16.2.9 VODAFONE
TABLE 250 VODAFONE: COMPANY OVERVIEW
*Details on Business overview, Products offered, Recent developments & MnM View might not be captured in case of unlisted companies.
17 RECOMMENDATIONS BY MARKETSANDMARKETS (Page No. - 292)
17.1 ASIA PACIFIC WILL BE MAJOR MARKET FOR CONNECTED CARS
17.2 INTEGRATED FORM OF CONNECTIVITY EXPECTED TO CREATE NEW REVENUE POCKETS IN FUTURE
17.3 AFTERMARKET EXPECTED TO OFFER ATTRACTIVE OPPORTUNITIES TO AUTOMAKERS
17.4 CONCLUSION
18 APPENDIX (Page No. - 294)
18.1 CURRENCY & PRICING
TABLE 251 CURRENCY EXCHANGE RATES (WRT PER USD)
18.2 INSIGHTS OF INDUSTRY EXPERTS
18.3 DISCUSSION GUIDE
18.4 KNOWLEDGE STORE: MARKETSANDMARKETS’ SUBSCRIPTION PORTAL
18.5 AVAILABLE CUSTOMIZATIONS
18.5.1 CONNECTED CAR SERVICE MARKET, BY VEHICLE TYP
18.5.1.1 BEV
18.5.1.2 PHEV
18.5.1.3 FCEV
18.5.2 CONNECTED CAR MARKET, BY CELLULAR NETWORK
18.5.2.1 4G/LTE
18.5.2.2 5G
18.5.3 CONNECTED CAR HARDWARE MARKET, BY AFTERMARKET
18.5.3.1 Head unit
18.5.3.2 Central gateway
18.5.3.3 Intelligent Antenna
18.5.3.4 Electronic control unit (ECU)
18.5.3.5 Telematic control unit (TCU)
18.5.3.6 Keyless entry system
18.5.3.7 Sensor
18.6 RELATED REPORTS
18.7 AUTHOR DETAILS
The study involved four major activities in estimating the current size of the connected car market. Exhaustive secondary research was carried out to collect information on the market, the peer market, and the parent market. The next step was to validate these findings, assumptions, and sizing with the industry experts across value chains through primary research. The bottom-up and top-down approaches were employed to estimate the complete market size. Thereafter, market breakdown and data triangulation processes were used to estimate the market size of segments and subsegments.
Secondary Research
In the secondary research process, various secondary sources, such as company annual reports, presentations, and press releases; associations, such as Organisation Internationale des Constructeurs d'Automobiles (OICA), the International Energy Agency (IEA), European Automobile Manufacturers’ Association, Canadian Automobile Association (CAA), country-level automotive associations and trade organizations, and the US Department of Transportation (DOT); industry association publications, such as publications of OEMs’ vehicle sales; connected car magazine articles, directories, and technical handbooks; World Economic Outlook; trade websites, and technical articles, were used to identify and collect information useful for an extensive commercial study of the global connected car market.
Primary Research
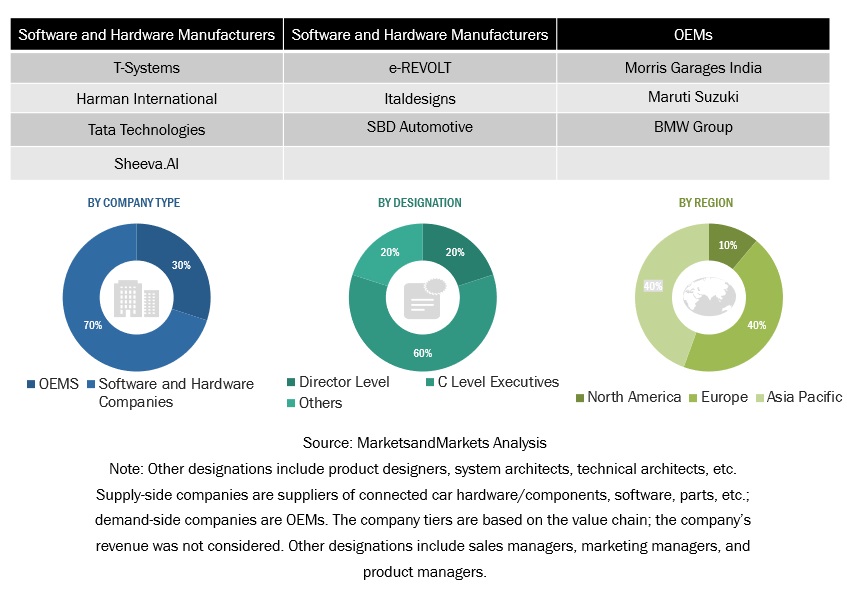
In the primary research process, various primary sources from both the supply and demand sides were interviewed to obtain qualitative and quantitative information on the market. The primary sources from the supply side included various industry experts, such as CXOs, vice presidents, directors from business development, marketing, and product development/innovation teams, and related key executives from various key companies. Various system integrators, industry associations, independent consultants/industry veterans, and key opinion leaders were also interviewed.
Primary interviews were conducted to gather insights such as vehicle production forecast, connected car market forecast, future technology trends, and upcoming technologies in the connected car industry. Data triangulation of all these points was carried out with the information gathered from secondary research as well as model mapping. Stakeholders from the demand as well as supply sides were interviewed to understand their views on the points mentioned above.
Primary interviews were conducted with market experts from both the demand (OEMs) and supply (connected car solution and service providers) sides across four major regions, namely, North America, Europe, Asia Pacific, and Rest of the World. Approximately 40%, 40% and 20% of primary interviews were conducted from the demand side, supply side and others, respectively. Primary data was collected through questionnaires, emails, and telephonic interviews. In the canvassing of primaries, we have strived to cover various departments within organizations, such as sales and operations, to provide a holistic viewpoint in our report.
After interacting with industry experts, we have also conducted brief sessions with highly experienced independent consultants to reinforce the findings from our primaries. This, along with the in-house subject matter experts’ opinions, has led us to the findings as described in the remainder of this report.
To know about the assumptions considered for the study, download the pdf brochure
Market Size Estimation
A detailed market estimation approach was followed to estimate and validate the value of the connected car market for automotive and other dependent submarkets, as mentioned below:
- Key players in the global market were identified through secondary research, and their global market shares were determined through primary and secondary research.
- The research methodology included a study of annual and quarterly financial reports and regulatory filings of major market players (public) as well as interviews with industry experts for detailed market insights.
- All industry-level penetration rates, percentage shares, splits, and breakdowns for the connected car market for automotive were determined using secondary sources and verified through primary sources.
- All key macro indicators affecting the revenue growth of the market segments and subsegments were accounted for, viewed in extensive detail, verified through primary research, and analyzed to get the validated and verified quantitative and qualitative data.
- The gathered market data was consolidated and added with detailed inputs, analyzed, and presented in this report.
- Qualitative aspects such as market drivers, restraints, opportunities, and challenges were taken into consideration while calculating and forecasting the market size.
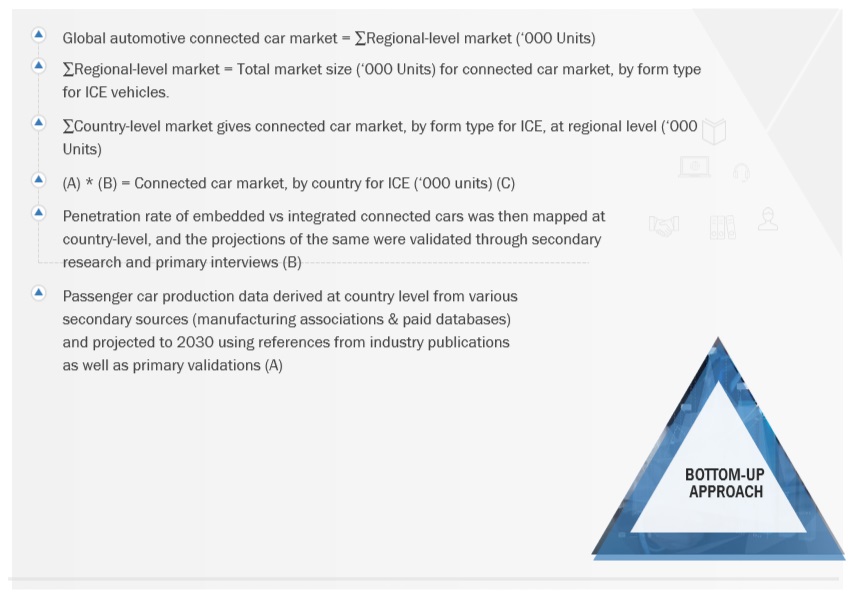
Bottom-Up Approach: OE and Connected Electric Car Market
To know about the assumptions considered for the study, Request for Free Sample Report
Bottom-Up Approach: Form Type
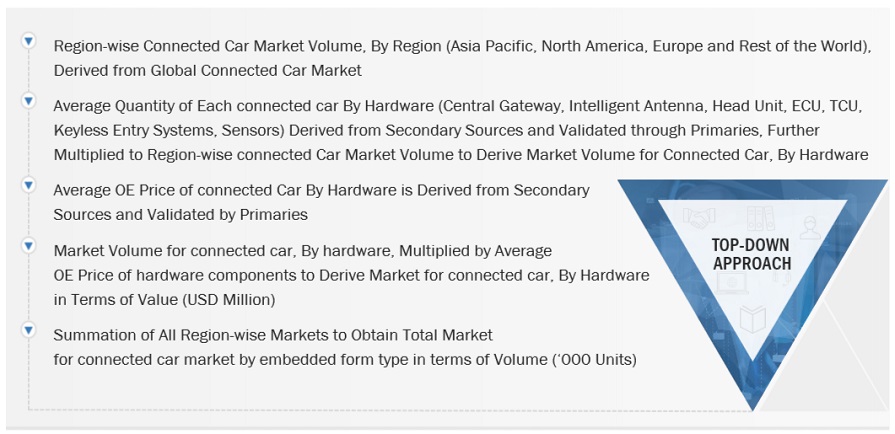
Top-Down Approach: End Market
Data Triangulation
- After arriving at the overall market size—using the market size estimation processes as explained above—the market was split into several segments and subsegments. To complete the overall market engineering process and arrive at the exact statistics of each market segment and subsegment, data triangulation and market breakdown procedures were employed, wherever applicable. The data was triangulated by studying various factors and trends from both the demand and supply sides.
Report Objectives
- To define, describe, and forecast the connected car market in terms of value (USD million) and volume (thousand units)
- By service (navigation, remote diagnostics, multimedia streaming, social media & other apps, OTA updates, on-road assistance, eCall & SOS assistance, cybersecurity, remote operation, collision warning, auto parking/connected parking, autopilot, home integration, vehicle management, and asset tracking) at the regional level, in terms of value at regional level
- By end market (OEM and aftermarket), in terms of value at the regional level
- By form type (embedded, tethered, and integrated), in terms of volume and value at the regional level
- By hardware (head unit, central gateway, intelligent antenna, electronic control unit, telematics control unit, keyless entry system, and sensor), in terms of value at the regional level
- By transponder (onboard unit and roadside unit), in terms of volume and value at the regional level
- By network (DSRC and cellular) at the regional level, in terms of volume
- By region (Asia Pacific, Europe, North America, and RoW), in terms of value
- By connected electric car market based on vehicle type (BEV, PHEV, and FCEV), in terms of value at the regional level
- To analyze the impact of COVID-19 on the global market (pre-COVID-19 vs. post-COVID-19)
- To analyze the most likely, low-impact, and high-impact scenarios of COVID-19 on the market
- To understand the market dynamics (drivers, restraints, opportunities, and challenges) of the global market
- To analyze the following with respect to the market
- Value Chain Analysis
- Ecosystem
- Market Scenario Analysis
- Porter’s Five Forces Analysis
- Average Selling Price Analysis
- Market Share Analysis
- Ranking Analysis of Top 5 Players
- To analyze the market ranking of key players operating in this market
- To analyze the competitive landscape and prepare a competitive leadership mapping/ranking quadrant for the global players operating in this market
- To analyze recent developments, alliances, joint ventures, mergers & acquisitions, new product launches, and other activities carried out by key industry participants in the connected car market
Available Customizations
With the given market data, MarketsandMarkets offers customizations in accordance with a company’s specific needs.
Connected Electric Car Market, By Region
- Asia Pacific
- Europe
- North America
Connected Electric Car Services Market, By Vehicle Type
- BEV
- PHEV
Growth opportunities and latent adjacency in Connected Car Market
I am mainly interested in the way the autonomous vehicles will develop in the near future in terms of market size/value and technologies used. I am also interested in exploring the main players in the autonomous vehicle market now and in the near future. Hope that gives a better understanding.
Growth of the connected car market - Investments in entertainment software for connected cars, in particular new 3D sound systems
As an SW consultant, I would like to present customers how the connected car market would be in the future and what should be prepared.
From reading the brief description, I get the sense that Connected Services are going to be the largest drivers of the annual growth rate of connected cars. As with any other new services, most of these new connected services need to break the "lack of adoption" barrier (as witnessed by mobile wallet industry). With high numbers of vehicles (in USA) on the road now (existing, non-connected cars), how do we expect the consumers to quickly adopt to the new connected services? Can we leverage some of the existing technologies and provide the "convenience" of driving to the existing consumers of non-connected cars? In a way, get them used to the newfound convenience which encourages them to adopt to new connected services after they buy a new "connected" cars. This is exactly what we are trying to address in our company. We would like to leverage the details in this report and make a case for an accelerated adoption roadmap for connected services.Thank you
Developing / selling end-to-end connected vehicles solution. Client (consumer and industrial) applications developed by ourselves or third parties on car sharing, taxi dispatching, bus dispatching, etc.
Looking to understand what market sizing for digital engagement (advertising and personalization) in the connected car is projected for the next 5 or so years.
Amply provides fleet charging as a service to connected cars / fleets. Need to understand the addressable market
sdsaf