V2X Market by Vehicle Type (PC, CV), V2X Communication Type (V2I, V2V+V2I, V2V+V2N), V2X Charging Type (V2L, V2H+V2L), Connectivity (CV2X, DSRC), Propulsion (ICE, EV), Offering, Technology, Fitment, Unit, and Region - Global Forecast to 2035

icon1
USD 4.05
MARKET SIZE, 2035
icon2
CAGR 26.1%
(2026-2035)
icon3
350
REPORT PAGES
icon4
250
MARKET TABLES

OVERVIEW

automotive-vehicle-to-everything-v2x-market Overview

Source: Secondary Research, Interviews with Experts, MarketsandMarkets Analysis

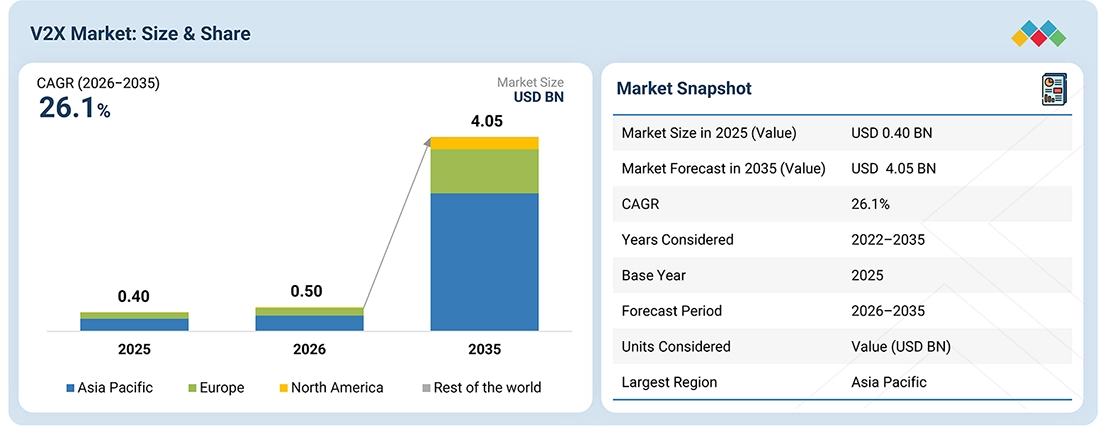
The V2X market is projected to grow from USD 0.50 billion in 2026 to USD 4.05 billion by 2035, at a CAGR of 26.1%. The market is transitioning toward connected mobility systems, driven by regulatory mandates, C-V2X communication, 5G-based vehicle connectivity, and intelligent transportation infrastructure. Market growth is supported by government-funded V2X programs, OEM integration of communication units, and rising demand for low-latency vehicle-to-vehicle and vehicle-to-infrastructure messaging. Adoption of C-V2X chipsets, onboard units (OBUs), roadside units (RSUs), and cellular positioning technologies is expanding safety applications such as intersection collision warnings, emergency braking alerts, vulnerable road user detection, and road hazard notifications. Increasing deployment of 5G NR V2X, cooperative perception, and edge computing is enabling more advanced applications that require real-time sharing of vehicle and infrastructure data. Asia Pacific remains a leading regional market, driven by China's vehicle road cloud integration initiatives, Japan's cooperative intelligent transport systems, South Korea's connected mobility programs, and growing smart transportation investments in India.

KEY TAKEAWAYS

  • MARKET SNAPSHOT:
    Market Size (2025): USD 0.40 Billion
    Current Market Size (2026): USD 0.50 Billion
    Projected Market Size (2033): USD 4.05 Billion
    CAGR (2026–2033):  26.1%
  • By Region
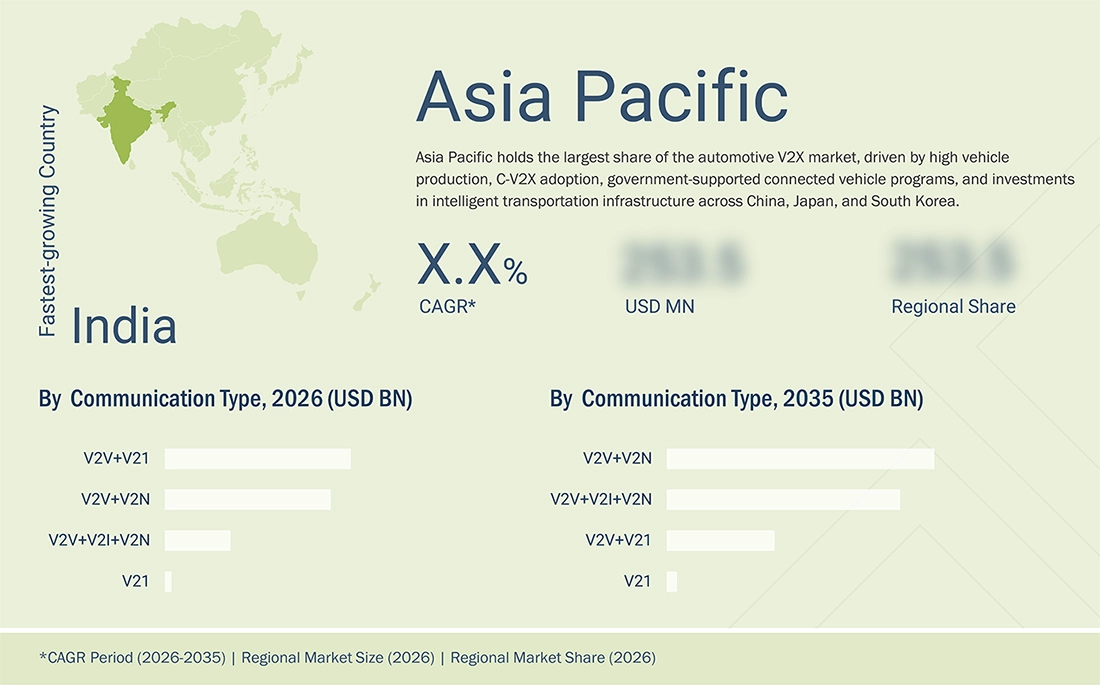
    Asia Pacific is projected to lead the V2X market during the forecast period. This segment is projected to grow from USD 0.33 billion in 2026 to USD 2.88 billion in 2035 at a CAGR of 27.3%.
  • By Vehicle Type
    The passenger cars segment is projected to lead the market during the forecast period. This segment is projected to grow from USD 5.41 billion in 2026 to USD 39.33 billion by 2033 at a CAGR of 24.8%.
  • By Propulsion
    The EV segment is projected to lead the market during the forecast period. This segment is projected to grow from USD 0.90 billion in 2026 to USD 2.25 billion in 2035 at a CAGR of 31.8%.
  • By Communication Type
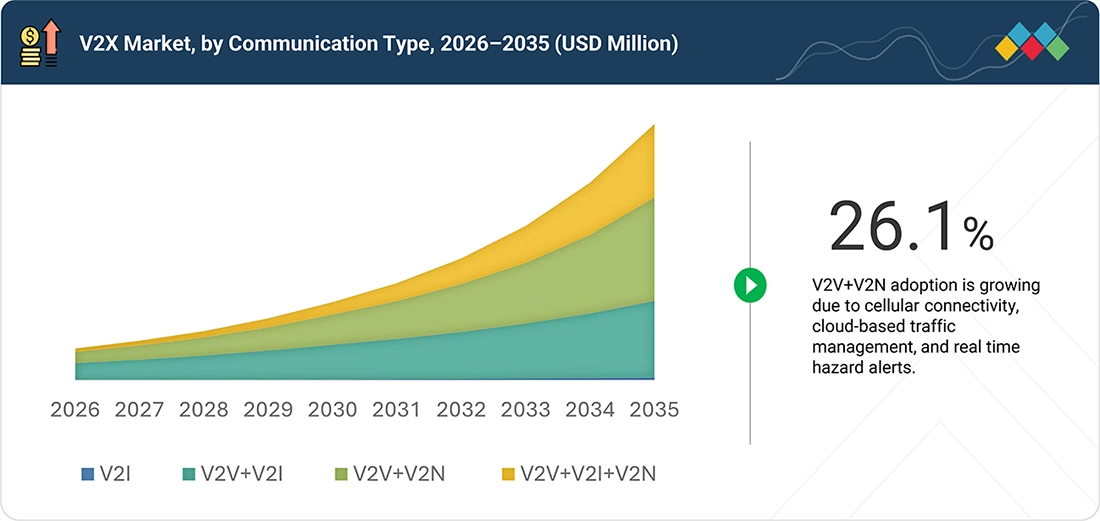
    The V2V+V2N segment is projected to lead the market during the forecast period. This segment is projected to grow from USD 0.18 billion in 2026 to USD 1.63 billion by 2035 at a CAGR of 27.9%.
  • By Connectivity Type
    The C-V2X segment is projected to lead the market during the forecast period.
  • By Offering Type
    The software segment is projected to lead the market during the forecast period.
  • By Technology
    The Automated Driver Assistance segment is projected to lead the market during the forecast period.
  • By V2X Charging Type
    The V2L segment is projected to lead the market during the forecast period.
  • By Unit
    The Onboard unit segment is projected to lead the market during the forecast period.
  • Competitive Landscape
    The market is dominated by key players, such as Qualcomm Incorporated (US), HARMAN International (US), Huawei Technologies Co., Ltd. (China), NXP Semiconductors (Netherlands), and AUMOVIO SE (Germany).
  • Competitive Landscape
    The market is dominated by other key players, such as Marben Products (France), Capgemini (France), Nokia Corporation (Finland), Ficosa Internacional (Spain), and Vector Informatik GmbH (Germany).

The V2X market is expected to be driven by C-V2X integration, 5G NR V2X development, connected road infrastructure investments, and OEM demand for cooperative safety systems. OBUs, RSUs, V2X chipsets, and antennas will see broader adoption across V2V, V2I, and V2N communication applications. Growth opportunities will center on retrofit V2X units, software-upgradeable communication modules, cooperative perception, and edge computing, supporting collision warnings, intersection safety, and real-time hazard detection across passenger cars and commercial vehicles.

TRENDS & DISRUPTIONS IMPACTING CUSTOMERS' CUSTOMERS

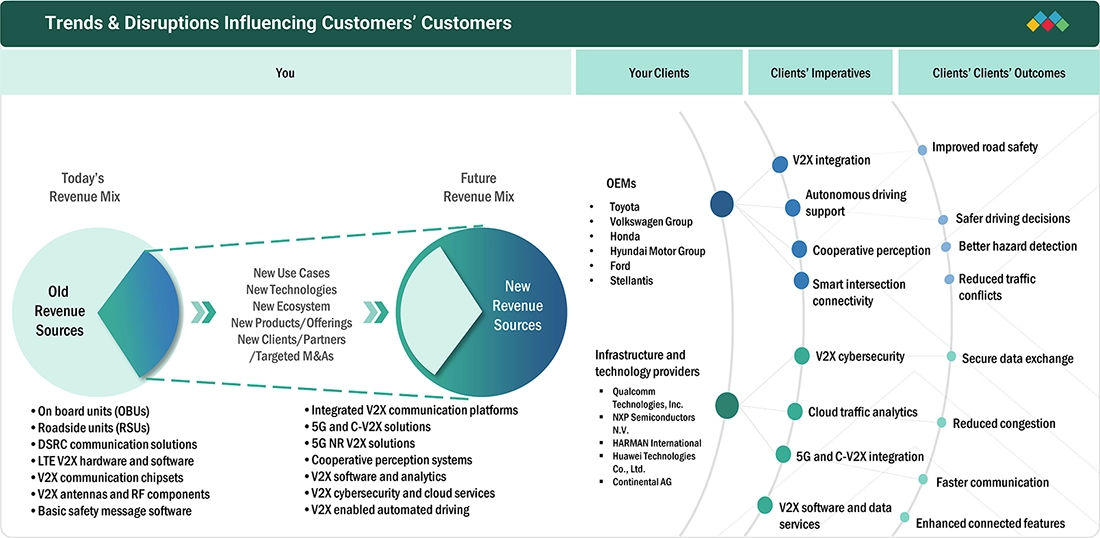
The V2X market is shifting from standalone vehicle communication systems toward integrated, connected, and cooperative mobility solutions. Traditional vehicle connectivity is increasingly complemented by C-V2X, 5G NR V2X, vehicle-to-infrastructure communication, roadside units, edge computing, and cooperative perception technologies. OEMs, Tier 1 suppliers, semiconductor companies, and infrastructure operators are adopting these solutions to improve road safety, enable real-time hazard warnings, support traffic management, and advance connected and automated driving. This transition is creating revenue opportunities across V2X chipsets, onboard units, roadside infrastructure, software platforms, cybersecurity, and connectivity services, while enabling faster hazard detection, improved traffic efficiency, enhanced interoperability, and greater integration between vehicles, roads, and communication networks.

automotive-vehicle-to-everything-v2x-market Disruptions

Source: Secondary Research, Interviews with Experts, MarketsandMarkets Analysis

MARKET DYNAMICS

Drivers
Impact
Level
  • V2X becoming complementary perception layer for ADAS and automated driving
  • Integration of C-V2X directly into next-generation automotive E/E and connectivity architectures
RESTRAINTS
Impact
Level
  • Low V2X penetration creates “network-effect” barrier to value realization
  • Interoperability, cybersecurity, and trust requirements complicate large-scale deployment  
OPPORTUNITIES
Impact
Level
  • Retrofitting existing vehicles with aftermarket V2X devices
  • Commercialization of V2X-enabled smart corridors and connected intersections
CHALLENGES
Impact
Level
  • Unclear commercial ownership and monetization of V2X services
  • Lack of interoperability across vehicle and infrastructure ecosystems

Source: Secondary Research, Interviews with Experts, MarketsandMarkets Analysis

Driver: V2X becoming complementary perception layer for ADAS and automated driving

Growing adoption of advanced driver assistance systems (ADAS) and automated driving technologies is increasing demand for V2X communication solutions that complement onboard sensors such as cameras, radar, and LiDAR. V2X enables vehicles to exchange real-time information about road hazards, traffic signals, surrounding vehicles, and vulnerable road users, improving situational awareness, collision avoidance, and cooperative driving capabilities.

Restraint:Low V2X penetration creates “network-effect” barrier to value realization

Limited deployment of V2X-enabled vehicles and roadside infrastructure restricts the effectiveness of V2X communication systems. The benefits depend on widespread adoption across vehicles, road infrastructure, and connected traffic networks. Differences in communication standards, infrastructure readiness, and regional deployment rates can delay adoption and limit near-term returns on investment for automotive manufacturers and technology providers.

Opportunity: Retrofitting existing vehicles with aftermarket V2X devices

Retrofitting existing vehicles with aftermarket V2X communication devices creates opportunities for suppliers to expand adoption beyond newly manufactured vehicles. Aftermarket onboard units and retrofit communication modules can enable vehicle-to-vehicle and vehicle-to-infrastructure messaging, supporting hazard alerts, intersection safety, and traffic information services. Fleet operators, commercial vehicle owners, and public transport providers represent potential customer groups for retrofit solutions.

Challenge: Unclear commercial ownership and monetization of V2X services

The V2X market faces challenges in establishing clear revenue models and commercial ownership across automotive OEMs, semiconductor suppliers, telecom operators, infrastructure providers, software developers, and public authorities. Uncertainty over who funds roadside infrastructure, manages connected data, and pays for ongoing services can slow commercialization. Suppliers must establish viable business models through hardware sales, software licensing, connectivity subscriptions, data services, and partnerships while addressing cybersecurity, privacy, interoperability, and deployment costs.

V2X MARKET: COMMERCIAL USE CASES ACROSS INDUSTRIES

COMPANY USE CASE DESCRIPTION BENEFITS
company logo
Develops C V2X chipsets, connectivity platforms, and communication technologies that enable vehicle-to-vehicle, vehicle-to-infrastructure, and vehicle-to-pedestrian communication. Low latency communication, improved road safety, real-time hazard alerts, and support for connected and automated vehicles.
company logo
Provides automotive connectivity solutions, connected vehicle platforms, and V2X technologies for communication between vehicles and surrounding infrastructure. Enhanced driver awareness, improved traffic safety, real-time information sharing, and seamless vehicle connectivity.
company logo
Develops intelligent vehicle connectivity solutions, C V2X technologies, and communication infrastructure supporting connected transportation and intelligent road systems. Improved traffic management, reduced collision risks, enhanced road efficiency, and reliable communication between vehicles and infrastructure.
company logo
Supplies automotive V2X chipsets, secure communication technologies, and semiconductor solutions for onboard vehicle units and roadside infrastructure. Secure data exchange, low latency communication, improved intersection safety, and support for intelligent transportation systems.
company logo
The company name requires confirmation. If this refers to an automotive technology or connectivity supplier, its use case should be aligned with its specific V2X products and services. Benefits depend on the company's actual V2X portfolio and should be verified before inclusion in the report.

Logos and trademarks shown above are the property of their respective owners. Their use here is for informational and illustrative purposes only.

MARKET ECOSYSTEM

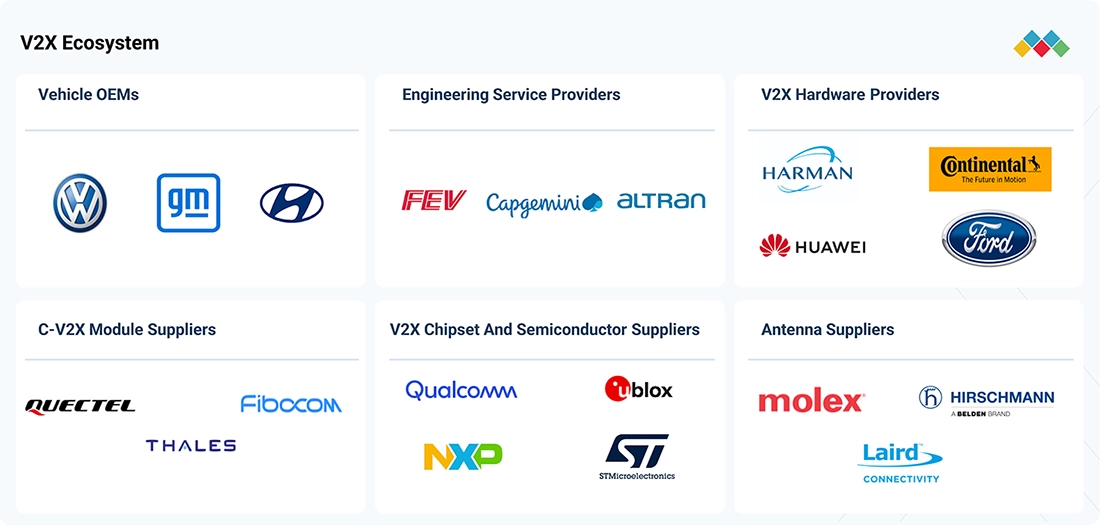
The V2X market ecosystem comprises vehicle OEMs, engineering service providers, V2X solution providers, OBU and RSU suppliers, and antenna suppliers that collaborate to develop, integrate, and deploy connected vehicle communication technologies. Vehicle OEMs, including Volkswagen, General Motors, and Hyundai, integrate V2X technologies into connected vehicle platforms. Engineering service providers such as FEV, Capgemini Engineering, and Altran support system engineering, software development, and vehicle integration. V2X solution providers, including Qualcomm, NXP Semiconductors, and STMicroelectronics, supply communication chipsets and connectivity technologies, while OBU and RSU suppliers such as Harman, Autotalks, and other specialized providers support vehicle and infrastructure communication. V2X providers, including Qualcomm, NXP, STMicroelectronics, and Cohda Wireless, contribute to communication platforms and V2X technology development. Antenna suppliers such as Molex and Laird Connectivity provide RF components that enable reliable wireless communication between vehicles, roadside infrastructure, and network systems.

automotive-vehicle-to-everything-v2x-market Ecosystem

Logos and trademarks shown above are the property of their respective owners. Their use here is for informational and illustrative purposes only.

MARKET SEGMENTS

automotive-vehicle-to-everything-v2x-market Segments

Source: Secondary Research, Interviews with Experts, MarketsandMarkets Analysis

By Vehicle Type

Passenger cars account for significant V2X demand due to high production volumes and increasing integration of connected safety features. LCVs are adopting V2X for fleet safety and urban logistics, while HCVs offer opportunities in collision prevention, platooning, and highway traffic coordination.

By Propulsion

ICE vehicles contribute through high production volumes, while hybrid and electric vehicles support the integration of connected safety and intelligent mobility functions. BEVs offer opportunities for V2X integration through advanced electronic architectures and connected vehicle platforms.

By V2X Communication Type

V2V and V2I communication support collision warnings, intersection safety, and infrastructure alerts. V2N enables cloud connectivity, traffic information, and hazard notifications, while combined communication configurations support broader connected mobility applications.

By Connectivity Type

DSRC supports short-range safety messaging, while C-V2X enables direct vehicle communication and network connectivity. 5G NR V2X is gaining importance for advanced cooperative driving, low-latency data exchange, and future automated driving applications.

By Offering Type

Hardware accounts for demand for OBUs, RSUs, chipsets, and antennas. Software supports communication protocols, cybersecurity, and data processing, while services cover system integration, testing, deployment, and maintenance.

By Technology Type

C-V2X remains a key technology for connected vehicle communication, supported by direct communication and cellular network connectivity. 5G NR V2X, cooperative perception, edge computing, and advanced positioning are expanding capabilities for real-time hazard detection and cooperative driving.

By V2X Charging Type

V2L enables electric vehicles to supply power to external devices and equipment, creating opportunities for connected power management and load monitoring. V2G supports bidirectional electricity flow between vehicles and the grid, while V2H enables vehicle batteries to power residential loads. V2X communication supports coordination between vehicles, charging infrastructure, and energy management systems for optimized power distribution and real-time monitoring.

By Fitment Type

OEM fitment is supported by factory integration of V2X modules into vehicle electronic architectures. Aftermarket fitment offers retrofit opportunities for existing vehicles and commercial fleets, particularly where connected safety deployment requires upgrades to vehicles already in operation.

By Unit

OBUs account for vehicle-to-vehicle communication demand, enabling V2V messaging, infrastructure connectivity, and real-time safety alerts. RSUs support infrastructure-side communication by transmitting signal phase and timing data, road hazard warnings, and traffic information. Integrated telematics units with embedded V2X capabilities offer OEMs opportunities to reduce hardware duplication and simplify vehicle integration.

REGION

Asia Pacific is leading the automotive V2X market

Asia Pacific holds the largest share of the V2X market, led by China, Japan, and other Southeast Asian countries, supported by high vehicle production, government-backed intelligent transportation initiatives, and expanding connected vehicle infrastructure. China leads regional adoption through vehicle road cloud integration projects and C-V2X deployment, while Japan and South Korea advance cooperative intelligent transport systems and connected vehicle technologies. India and Southeast Asia present growth opportunities through smart city projects, highway connectivity, and increasing demand for vehicle safety applications. Growing investments in roadside units, 5G connectivity, and vehicle communication systems are supporting regional market expansion.

automotive-vehicle-to-everything-v2x-market Region

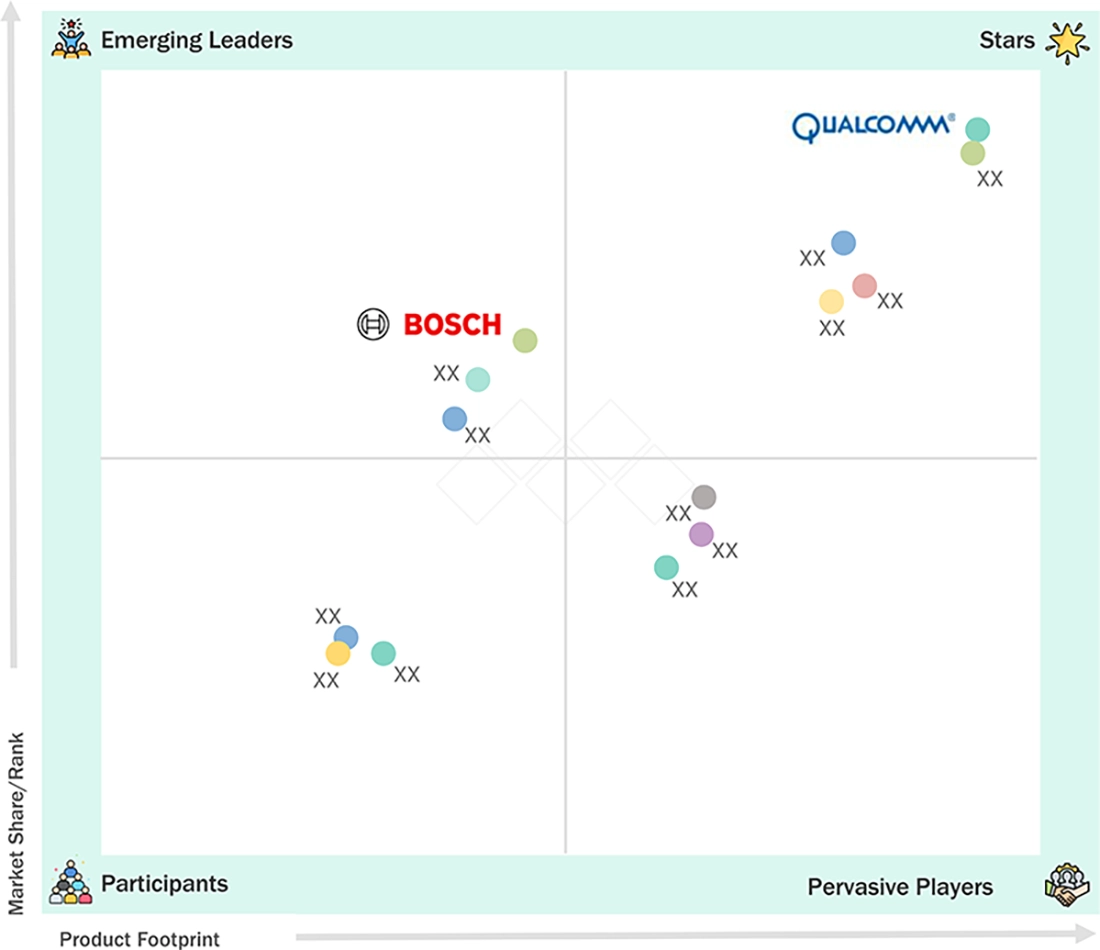
V2X MARKET: COMPANY EVALUATION MATRIX

Qualcomm is categorized as a Star player in the market, supported by its strong position in C-V2X chipsets, connected vehicle platforms, and cellular communication technologies. Its V2X solutions enable vehicle-to-vehicle, vehicle-to-infrastructure, and vehicle-to-network communication for collision avoidance, cooperative driving, and real-time road safety alerts. By integrating 5G connectivity, positioning, and automotive computing capabilities, and collaborating with global automotive manufacturers, it strengthens its market position. Bosch is categorized as a key Emerging player in the market, supported by its automotive electronics, connected mobility, and intelligent transportation system capabilities. Its expertise in vehicle connectivity, automotive system integration, and road safety technologies supports the development of connected vehicle applications. Established OEM relationships and growing demand for interoperable communication systems create opportunities for Bosch to expand its presence in the global V2X market.

automotive-vehicle-to-everything-v2x-market Evaluation Metrics

Source: Secondary Research, Interviews with Experts, MarketsandMarkets Analysis

KEY MARKET PLAYERS

MARKET SCOPE

REPORT METRIC DETAILS
Market Size in 2025 (Value) USD 0.40 Billion
Market Size in 2026 (Value) USD 0.50 Billion
Market Forecast in 2035 (Value) USD 4.05 Billion
Growth Rate CAGR of 26.1% from 2026–2035
Years Considered 2022–2035
Base Year 2025
Forecast Period 2026-2035
Units Considered Value (USD Million), Volume (Thousand Units)
Report Coverage Revenue Forecast, Competitive Landscape, Company Share, Growth Factors and Trends
Segments Covered By Offering, By V2X Charging, By Propulsion, By V2X Communication, By Connectivity, By Vehicle Type, By Unit, By Fitment, By Technology
Regional Scope Asia Pacific, North America, Europe, and Rest of the World

WHAT IS IN IT FOR YOU: V2X MARKET REPORT CONTENT GUIDE

automotive-vehicle-to-everything-v2x-market Content Guide

DELIVERED CUSTOMIZATIONS

We have successfully delivered the following deep-dive customizations:

CLIENT REQUEST CUSTOMIZATION DELIVERED VALUE ADDS
V2X Market Segmentation Developed separate analysis by communication type, including V2I, V2V + V2I, V2V + V2N, and V2V + V2I + V2N, along with hardware, software, and services. Helps prioritize high growth communication segments and technology opportunities.
V2X Demand Drivers Mapped demand drivers including connected vehicle adoption, ADAS integration, automated driving, road safety requirements, 5G connectivity, intelligent transportation systems, and government initiatives. Supports technology planning, market entry, and investment decisions.
OEM and Supplier Benchmarking Benchmarked automotive OEMs, Tier 1 suppliers, semiconductor manufacturers, connectivity providers, and V2X technology companies based on product portfolios, communication technologies, partnerships, and market presence. Enables competitive positioning and partnership evaluation.
Vehicle Platform Analysis Assessed V2X requirements across passenger cars, SUVs, LCVs, HCVs, buses, and commercial vehicle fleets, considering connectivity architecture, onboard units, communication standards, and vehicle integration requirements. Identifies platform specific connectivity requirements and future technology needs.
Application Level Insights Analyzed demand across vehicle-to-vehicle, vehicle-to-infrastructure, vehicle-to-network, and vehicle-to-pedestrian applications, including collision avoidance, traffic signal coordination, hazard alerts, cooperative driving, and connected mobility services. Supports targeted product development and application specific positioning.
Regional Market Deep Dive Delivered country-level analysis covering V2X-enabled vehicle sales, communication technology adoption, connected road infrastructure, regulatory frameworks, 5G deployment, OEM presence, and supplier activity across key regional markets. Supports regional expansion, investment planning, and market prioritization.
Regulatory and Compliance Assessment Evaluated regional V2X regulations, spectrum allocation, communication standards, cybersecurity requirements, data privacy rules, and vehicle safety frameworks across the US, Europe, China, Japan, and other key markets. Identifies compliance driven demand and reduces regulatory and market entry risks.
V2X Technology Mapping Mapped DSRC and C-V2X technologies, including 4G LTE V2X, 5G NR V2X, onboard units, roadside units, communication chipsets, antennas, cloud connectivity, and edge computing solutions. Improves technology visibility and supports future product development and partnership strategies.
Technology Investment Analysis Assessed investment trends across V2X chipsets, 5G connectivity, connected vehicle platforms, cybersecurity, cooperative driving technologies, roadside infrastructure, and software-based V2X services. Identifies emerging technologies and future investment opportunities.
CAPEX and Deployment Analysis Evaluated infrastructure deployment costs, onboard unit integration, roadside unit installation, communication network requirements, software development, cybersecurity investments, and ongoing maintenance costs. Supports infrastructure planning, technology investment, deployment decisions, and cost optimization.
Strategic Recommendations Provided recommendations on communication technology priorities, OEM targeting, supplier partnerships, regional expansion, infrastructure collaboration, software monetization, and V2X ecosystem development. Enables informed investment decisions, stronger competitive positioning, and sustainable market growth.

RECENT DEVELOPMENTS

  • July 2026 : BMW Group named Qualcomm as its lead compute silicon provider for digital cockpit and next-generation ADAS and automated driving systems for the next decade. The agreement covers unified compute platforms across vehicle domains, supporting connected, automated driving, and future V2X-capable architectures.
  • July 2026 : Qualcomm Technologies collaborated with Hyundai Mobis to demonstrate a V2X solution designed to detect non-line-of-sight hazards, including obstructed vehicles and two-wheelers, enabling earlier warnings and supporting braking interventions to improve road safety.
  • May 2026 : Stellantis and Qualcomm expanded their multi-year technology partnership for next-generation vehicle architectures. Stellantis will adopt Snapdragon Digital Chassis driver assistance, cockpit, and connectivity platforms across brands, enabling unified compute, connected services, and ADAS features that support future C-V2X and broader V2X capabilities.
  • April 2026 : Bosch and Qualcomm extended their strategic partnership into advanced driver-assistance systems, agreeing to co-develop scalable, cost-optimized vehicle ADAS solutions. The partnership targets camera, radar, and domain controller platforms that support higher levels of automation
  • Jan 2026 : HARMAN announced enhanced Ready Aware safety capabilities that use existing 4G/5G connectivity and machine-learning-based alert confidence to improve road-hazard awareness and reduce false alerts.
  • August 2025 : Cohda Wireless and Danlaw formed a collaboration with Integrity Security Services to demonstrate secure vehicle-to-network-to-everything communications using routelink RSUs and SCMS security technology.
  • March 2025 : HARMAN formed a technology collaboration with HERE Technologies to develop direct and cloud-based V2X driver-assistance systems for road-hazard alerts, wrong-way-driver warnings, and support for evolving Euro NCAP requirements.


Table of Contents

checkmarkExclusive indicates content/data unique to MarketsandMarkets and not available with any competitors.

TITLE
PAGE NO
1
INTRODUCTION


24
2
EXECUTIVE SUMMARY


33
3
PREMIUM INSIGHTS


38
4
MARKET OVERVIEW
V2X integration transforms traffic intelligence, enabling cooperative perception and enhancing automated driving systems.


42
 
4.1
INTRODUCTION


4.2
MARKET DYNAMICS


4.2.1
DRIVERS


4.2.1.1
V2X BECOMING COMPLEMENTARY PERCEPTION LAYER FOR ADAS AND AUTOMATED DRIVING


4.2.1.2
INTEGRATION OF C-V2X INTO NEXT-GENERATION AUTOMOTIVE E/E AND CONNECTIVITY ARCHITECTURES


4.2.1.3
SHIFT FROM ISOLATED VEHICLE AWARENESS TO COOPERATIVE TRAFFIC AND ROAD-OPERATIONS INTELLIGENCE


4.2.2
RESTRAINTS


4.2.2.1
LOW V2X PENETRATION CREATES NETWORK-EFFECT BARRIER TO VALUE REALIZATION


4.2.2.2
INTEROPERABILITY, CYBERSECURITY, AND TRUST REQUIREMENTS COMPLICATE LARGE-SCALE DEPLOYMENT


4.2.3
OPPORTUNITIES


4.2.3.1
RETROFITTING EXISTING VEHICLES WITH AFTERMARKET V2X DEVICES


4.2.3.2
COMMERCIALIZATION OF V2X-ENABLED SMART CORRIDORS AND CONNECTED INTERSECTIONS


4.2.3.3
INTEGRATION OF V2X WITH AUTONOMOUS DRIVING AND COOPERATIVE PERCEPTION


4.2.4
CHALLENGES


4.2.4.1
UNCLEAR COMMERCIAL OWNERSHIP AND MONETIZATION OF V2X SERVICES


4.2.4.2
LACK OF INTEROPERABILITY ACROSS VEHICLE AND INFRASTRUCTURE ECOSYSTEMS


4.3
UNMET NEEDS AND WHITE SPACES


4.3.1
RELIABLE, INTEROPERABLE, AND SCALABLE V2X COMMUNICATION ACROSS DIVERSE VEHICLE AND INFRASTRUCTURE ECOSYSTEMS


4.3.2
LIMITED END-TO-END V2X SYSTEM INTEGRATION AND CONTINUOUS COMPLIANCE


4.3.3
LIMITED DATA UTILIZATION FOR INTELLIGENT V2X APPLICATIONS


4.4
V2X-ENABLED COOPERATIVE PERCEPTION AND AUTOMATED DRIVING


4.4.1
SENSOR AUGMENTATION


4.4.2
NON-LINE-OF-SIGHT PERCEPTION


4.4.3
INTERSECTION AWARENESS


4.4.4
VULNERABLE ROAD USER DETECTION


4.4.5
EMERGENCY VEHICLE ALERTS


4.4.6
PLATOONING AND L2+/L3 APPLICATIONS


5
INDUSTRY TRENDS
Discover how evolving V2X tech reshapes automotive telematics and global supply chains.


57
 
5.1
MACROECONOMIC INDICATORS


5.1.1
INTRODUCTION


5.1.2
GDP TRENDS AND FORECAST


5.1.3
TRENDS IN AUTOMOTIVE TELEMATICS MARKET


5.1.4
TRENDS IN GLOBAL V2X INDUSTRY


5.2
SUPPLY CHAIN ANALYSIS


5.3
ECOSYSTEM MAPPING


5.3.1
TELECOM NETWORK PROVIDERS


5.3.2
ROAD INFRASTRUCTURE UNIT PROVIDERS


5.3.3
MAPPING AND POSITIONING PROVIDERS


5.3.4
FLEET OPERATORS AND MOBILITY SERVICE PROVIDERS


5.3.5
V2X HARDWARE PROVIDERS


5.3.6
V2X SOFTWARE PROVIDERS


5.3.7
AUTOMOTIVE ENGINEERING SERVICE PROVIDERS


5.3.8
C-V2X MODULE SUPPLIERS


5.3.9
ANTENNA SUPPLIERS


5.3.10
OEMS


5.4
PRICING ANALYSIS


5.5
KEY CONFERENCES AND EVENTS, 2027


5.6
TRENDS AND DISRUPTIONS IMPACTING CUSTOMER BUSINESSES


5.7
INVESTMENT AND FUNDING SCENARIO


5.8
BILL OF MATERIALS


5.8.1
BILL OF MATERIALS FOR V2X COMMUNICATION ON BOARD UNIT


5.9
CASE STUDY ANALYSIS


5.9.1
PILOT PROJECT ON VIRGINIA SMART ROAD


5.9.2
VEHICLE POSITIONING ACCURACY IN NEW YORK


5.9.3
TOWARDS ZERO ROAD SAFETY STRATEGY


5.9.4
PREPARING ROADS FOR AUTONOMOUS VEHICLES


5.9.5
PILOT PROJECT ON SAN DIEGO ROADWAYS


5.9.6
ECOCAR MOBILITY CHALLENGE


5.9.7
TRANSFORMING SNOW REMOVAL IN DENVER WITH V2X TECHNOLOGY


5.10
OEM VS. AFTERMARKET V2X DEPLOYMENT STRATEGIES


5.11
V2X RETROFIT OPPORTUNITY IN EXISTING VEHICLE FLEETS


5.12
AFTERMARKET V2X BUSINESS MODELS AND REVENUE STREAMS


6
TECHNOLOGICAL ADVANCEMENTS, AI-DRIVEN IMPACT, PATENTS, INNOVATIONS, AND FUTURE APPLICATIONS IN V2X MARKET
5G NR-V2X and predictive QoS revolutionize V2X with real-time cooperative perception and dynamic mapping.


76
 
6.1
TECHNOLOGY ANALYSIS


6.1.1
INTRODUCTION


6.1.2
KEY EMERGING TECHNOLOGIES


6.1.2.1
5G NR-V2X


6.1.2.2
COOPERATIVE PERCEPTION / SENSOR SHARING


6.1.2.3
PREDICTIVE QOS & ADAPTIVE V2X


6.1.2.4
V2X AS A SERVICE


6.1.3
ADJACENT TECHNOLOGIES


6.1.3.1
EDGE COMPUTING / MEC FOR V2X


6.1.3.2
V2N2X / HYBRID DIRECT + NETWORK V2X


6.2
TECHNOLOGY/PRODUCT ROADMAP


6.3
PATENT ANALYSIS


6.3.1
INTRODUCTION


6.3.1.1
LIST OF PATENTS


6.4
FUTURE APPLICATIONS


6.4.1
COOPERATIVE AUTONOMOUS DRIVING


6.4.2
REAL-TIME COOPERATIVE PERCEPTION


6.4.3
PREDICTIVE V2X


6.4.4
V2X + DIGITAL TWINS / DYNAMIC HD MAPS


6.4.5
COOPERATIVE TRAFFIC FLOW & INTERSECTION INTELLIGENCE


7
REGULATORY LANDSCAPE
Navigate complex V2X regulations and spectrum allocations across global markets for strategic compliance.


86
 
7.1
REGULATORY LANDSCAPE


7.1.1
COUNTRY-WISE REGULATIONS


7.1.1.1
V2X SPECTRUM ALLOCATION


7.1.1.2
V2X TECHNOLOGY REGULATORY DIRECTION


7.1.1.3
C-ITS & AUTOMATED DRIVING REGULATIONS


7.1.2
REGULATORY BODIES, GOVERNMENT AGENCIES, AND OTHER ORGANIZATIONS


8
CUSTOMER LANDSCAPE AND BUYING BEHAVIOR
Unlock stakeholder influence and buying criteria to navigate complex customer decision-making landscapes.


92
 
8.1
DECISION-MAKING PROCESS


8.2
KEY STAKEHOLDERS AND BUYING CRITERIA


8.2.1
V2I


8.2.2
V2V + V2I


8.2.3
V2V + V2N


8.2.4
V2V + V2I + V2N


8.2.5
KEY STAKEHOLDERS IN BUYING PROCESS


8.2.6
BUYING CRITERIA


8.3
ADOPTION BARRIERS & INTERNAL CHALLENGES


9
V2X MARKET, BY OFFERING
Market Size & Growth Rate Forecast Analysis to 2035 in USD Million | 6 Data Tables


97
 
9.1
INTRODUCTION


9.2
HARDWARE


9.2.1
INCREASING DEPLOYMENT OF CONNECTED VEHICLE AND ROADSIDE INFRASTRUCTURE


9.3
SOFTWARE


9.3.1
RISING INTEGRATION OF V2X APPLICATIONS WITH SOFTWARE-DEFINED VEHICLES


9.4
KEY PRIMARY INSIGHTS


10
V2X MARKET, BY CHARGING
Market Size & Growth Rate Forecast Analysis to 2035 in USD Million | 8 Data Tables


102
 
10.1
INTRODUCTION


10.2
V2L


10.2.1
RISING DEMAND FOR PORTABLE AND EMERGENCY VEHICLE POWER


10.3
V2H + V2L


10.3.1
INCREASING DEMAND FOR RESIDENTIAL ENERGY FLEXIBILITY


10.4
V2G + V2H + V2L


10.4.1
EXPANDING ROLE OF EV BATTERIES IN GRID FLEXIBILITY


10.5
KEY PRIMARY INSIGHTS


11
V2X MARKET, BY PROPULSION
Market Size & Growth Rate Forecast Analysis to 2035 in USD Million and Units | 12 Data Tables


108
 
11.1
INTRODUCTION


11.2
INTERNAL COMBUSTION ENGINE (ICE)


11.2.1
EXPANDING V2X ADOPTION THROUGH CONNECTED AND SAFETY-FOCUSED ICE VEHICLES


11.3
ELECTRIC VEHICLE (EV)


11.3.1
ACCELERATING V2X DEPLOYMENT THROUGH ELECTRIFICATION AND SOFTWARE-DEFINED VEHICLES


11.4
KEY PRIMARY INSIGHTS


12
V2X MARKET, BY COMMUNICATION
Market Size & Growth Rate Forecast Analysis to 2035 in USD Million and Units | 20 Data Tables


115
 
12.1
INTRODUCTION


12.2
V2I


12.2.1
INCREASING DEPLOYMENT OF INTELLIGENT ROADSIDE INFRASTRUCTURE


12.3
V2V+V2I


12.3.1
ACCELERATING COOPERATIVE SAFETY THROUGH VEHICLE AND INFRASTRUCTURE CONNECTIVITY


12.4
V2V+V2N


12.4.1
EXPANDING CELLULAR CONNECTIVITY AND CLOUD-BASED VEHICLE COMMUNICATION


12.5
V2V+V2I+V2N


12.5.1
INTEGRATING DIRECT, INFRASTRUCTURE, AND NETWORK CONNECTIVITY


12.6
V2P


12.6.1
INCREASING FOCUS ON VULNERABLE ROAD USER SAFETY


12.7
KEY PRIMARY INSIGHTS


13
V2X MARKET, BY VEHICLE TYPE
Market Size & Growth Rate Forecast Analysis to 2035 in Units | 6 Data Tables


126
 
13.1
INTRODUCTION


13.2
PASSENGER CARS


13.2.1
INCREASING INTEGRATION OF V2X WITH CONNECTED PASSENGER VEHICLES AND ADAS


13.3
COMMERCIAL VEHICLES


13.3.1
RISING ADOPTION OF V2X FOR FLEET SAFETY, AUTOMATION, AND LOGISTICS EFFICIENCY


13.4
KEY PRIMARY INSIGHTS


14
V2X MARKET, BY CONNECTIVITY
Market Size & Growth Rate Forecast Analysis to 2035 in Units | 6 Data Tables


131
 
14.1
INTRODUCTION


14.2
C-V2X


14.2.1
ACCELERATING CELLULAR-BASED V2X DEPLOYMENT AND CONNECTED VEHICLE INTEGRATION


14.3
DSRC


14.3.1
SUPPORTING LEGACY V2X INFRASTRUCTURE AND INTEROPERABILITY REQUIREMENTS


14.4
KEY PRIMARY INSIGHTS


15
V2X MARKET, BY UNIT
Market Size & Growth Rate Forecast Analysis


136
 
15.1
INTRODUCTION


15.2
ONBOARD UNITS


15.3
ROADSIDE UNITS


15.4
KEY PRIMARY INSIGHTS


16
V2X MARKET, BY FITMENT
Market Size & Growth Rate Forecast Analysis


138
 
16.1
INTRODUCTION


16.2
PLUG-AND-PLAY FITMENT


16.3
RETROFIT FITMENT


16.4
INTEGRATED FITMENT


16.5
KEY PRIMARY INSIGHTS


17
V2X MARKET, BY TECHNOLOGY
Market Size & Growth Rate Forecast Analysis


140
 
17.1
INTRODUCTION


17.2
AUTOMATED DRIVER ASSISTANCE


17.3
INTELLIGENT TRAFFIC SYSTEM


17.4
EMERGENCY VEHICLE NOTIFICATION


17.5
PASSENGER INFORMATION SYSTEM


17.6
FLEET & ASSET MANAGEMENT


17.7
PARKING MANAGEMENT SYSTEM


17.8
LINE-OF-SIGHT


17.9
NON-LINE-OF-SIGHT


17.10
BACKING


17.11
OTHERS


17.12
KEY PRIMARY INSIGHTS


18
V2X MARKET, BY REGION
Comprehensive coverage of 4 Regions with country-level deep-dive of 14 Countries | 58 Data Tables.


145
 
18.1
INTRODUCTION


18.2
ASIA PACIFIC


18.2.1
CHINA


18.2.1.1
RAPID C-V2X DEPLOYMENT AND VEHICLE-ROAD-CLOUD INTEGRATION TO DRIVE MARKET


18.2.2
JAPAN


18.2.2.1
C-V2X DEPLOYMENT AND CONNECTED VEHICLE DEVELOPMENT TO DRIVE MARKET


18.2.3
INDIA


18.2.3.1
PROPOSED V2X MANDATES TO DRIVE MARKET IN INDIA


18.2.4
SOUTH KOREA


18.2.4.1
C-ITS DEPLOYMENT ON MAJOR ROADS TO DRIVE MARKET


18.3
EUROPE


18.3.1
GERMANY


18.3.1.1
GROWING V2X DEPLOYMENT AND 5G V2X TRIALS TO DRIVE MARKET


18.3.2
FRANCE


18.3.2.1
GOVERNMENT SUPPORT AND CONNECTED MOBILITY PROGRAMS TO DRIVE MARKET


18.3.3
ITALY


18.3.3.1
EXPANSION OF 5G INFRASTRUCTURE AND CONNECTED MOBILITY CORRIDORS TO DRIVE MARKET


18.3.4
SPAIN


18.3.4.1
SMART ROAD INFRASTRUCTURE AND 5G CORRIDORS TO ACCELERATE V2X COMMERCIALIZATION


18.3.5
UK


18.3.5.1
GOVERNMENT-BACKED V2X AND AUTOMATED MOBILITY PROGRAMS TO DRIVE MARKET


18.4
NORTH AMERICA


18.4.1
US


18.4.1.1
C-V2X DEPLOYMENT AND CONNECTED MOBILITY APPLICATIONS TO DRIVE MARKET


18.4.2
CANADA


18.4.2.1
CONNECTED VEHICLE RESEARCH, C-V2X DEPLOYMENT, AND CYBERSECURITY PROGRAMS TO DRIVE MARKET


18.4.3
MEXICO


18.4.3.1
EXPANSION OF CONNECTED ROAD INFRASTRUCTURE AND AUTOMOTIVE MANUFACTURING TO DRIVE MARKET


18.5
REST OF THE WORLD


18.5.1
BRAZIL


18.5.1.1
CONNECTED ROAD INFRASTRUCTURE AND AUTOMOTIVE TECHNOLOGY PROGRAMS TO SUPPORT V2X ADOPTION


18.5.2
ARGENTINA


18.5.2.1
CONNECTED ROAD INFRASTRUCTURE AND AUTOMATED MOBILITY PROGRAMS TO DRIVE MARKET


19
COMPETITIVE LANDSCAPE
Discover strategic moves and market dominance shaping the V2X landscape through 2025.


177
 
19.1
OVERVIEW


19.2
KEY PLAYER STRATEGIES/RIGHT TO WIN


19.2.1
OVERVIEW OF STRATEGIES ADOPTED BY PLAYERS IN V2X MARKET


19.3
MARKET SHARE ANALYSIS, 2025


19.4
REVENUE ANALYSIS, 2021–2025


19.5
COMPANY VALUATION AND FINANCIAL METRICS


19.5.1
COMPANY VALUATION


19.5.2
FINANCIAL METRICS


19.6
BRAND/PRODUCT COMPARISON


19.7
COMPANY EVALUATION MATRIX: KEY PLAYERS, 2025


19.7.1
STARS


19.7.2
EMERGING LEADERS


19.7.3
PERVASIVE PLAYERS


19.7.4
PARTICIPANTS


19.7.5
COMPANY FOOTPRINT: KEY PLAYERS, 2025


19.7.5.1
COMPANY FOOTPRINT


19.7.5.2
REGION FOOTPRINT


19.7.5.3
VEHICLE TYPE FOOTPRINT


19.8
COMPANY EVALUATION MATRIX: STARTUPS/SMES, 2025


19.8.1
PROGRESSIVE COMPANIES


19.8.2
RESPONSIVE COMPANIES


19.8.3
DYNAMIC COMPANIES


19.8.4
STARTING BLOCKS


19.8.5
COMPETITIVE BENCHMARKING, STARTUPS/SMES, 2025


19.8.5.1
LIST OF KEY STARTUPS/SMES


19.8.5.2
COMPETITIVE BENCHMARKING OF STARTUPS/SMES


19.9
COMPETITIVE SCENARIO


19.9.1
PRODUCT LAUNCHES/DEVELOPMENTS/ENHANCEMENTS


19.9.2
DEALS


19.9.3
EXPANSIONS


19.9.4
OTHER DEVELOPMENTS


20
COMPANY PROFILES
In-depth Company Profiles of Leading Market Players with detailed Business Overview, Product and Service Portfolio, Recent Developments, and Unique Analyst Perspective (MnM View)


194
 
20.1
KEY PLAYERS


20.1.1
QUALCOMM INCORPORATED


20.1.1.1
BUSINESS OVERVIEW


20.1.1.2
PRODUCTS/SOLUTIONS/SERVICES OFFERED


20.1.1.3
RECENT DEVELOPMENTS


20.1.1.4
MNM VIEW


20.1.1.4.1
KEY STRENGTHS


20.1.1.4.2
STRATEGIC CHOICES


20.1.1.4.3
WEAKNESSES AND COMPETITIVE THREATS


20.1.2
HARMAN INTERNATIONAL


20.1.3
HUAWEI TECHNOLOGIES CO., LTD.


20.1.4
NXP SEMICONDUCTORS


20.1.5
AUMOVIO SE


20.1.6
ROBERT BOSCH GMBH


20.1.7
COHDA WIRELESS


20.1.8
INFINEON TECHNOLOGIES AG


20.1.9
DENSO CORPORATION


20.1.10
STMICROELECTRONICS


20.1.11
HYUNDAI MOBIS


20.1.12
KAPSCH GROUP


20.2
OTHER PLAYERS


20.2.1
MARBEN PRODUCTS


20.2.2
CAPGEMINI ENGINEERING


20.2.3
NOKIA


20.2.4
DSPACE GMBH


20.2.5
FICOSA INTERNACIONAL SA


20.2.6
VECTOR INFORMATIK GMBH


20.2.7
BMW AG


20.2.8
MERCEDES-BENZ GROUP AG


20.2.9
RENAULT GROUP


20.2.10
UNEX TECHNOLOGY CORP.


20.2.11
MITSUBISHI ELECTRIC CORPORATION


20.2.12
FLEX LTD.


20.2.13
TATA MOTORS PASSENGER VEHICLES LIMITED


20.2.14
HITACHI SOLUTIONS, LTD.


20.2.15
NISSAN MOTOR CO., LTD.


20.2.16
LEAR CORPORATION


20.2.17
INTEL CORPORATION


20.2.18
DANLAW, INC.


20.2.19
COMMSIGNIA LTD.


20.2.20
GENERAL MOTORS


20.2.21
FORD MOTOR COMPANY


21
RESEARCH METHODOLOGY


262
 
21.1
RESEARCH DATA


21.1.1
SECONDARY DATA


21.1.2
KEY SECONDARY SOURCES


21.1.2.1
LIST OF SECONDARY SOURCES


21.1.2.2
KEY DATA FROM SECONDARY SOURCES


21.1.3
PRIMARY DATA


21.1.3.1
PRIMARY INTERVIEWS – DEMAND AND SUPPLY SIDES


21.1.3.2
KEY INDUSTRY INSIGHTS AND BREAKDOWN OF PRIMARY INTERVIEWS


21.1.3.3
LIST OF PRIMARY PARTICIPANTS


21.2
MARKET SIZE ESTIMATION


21.2.1
BOTTOM-UP APPROACH


21.2.2
TOP-DOWN APPROACH


21.3
DATA TRIANGULATION


21.4
FACTOR ANALYSIS


21.5
RESEARCH LIMITATIONS


21.6
RESEARCH ASSUMPTIONS AND RISK ASSESSMENT


22
APPENDIX


274
 
22.1
KEY INSIGHTS OF INDUSTRY EXPERTS


22.2
DISCUSSION GUIDE


22.3
KNOWLEDGESTORE: MARKETSANDMARKETS’ SUBSCRIPTION PORTAL


22.4
CUSTOMIZATION OPTIONS


22.4.1
V2X MARKET, BY CHARGING, AT THE COUNTRY LEVEL (FOR REGIONS COVERED IN THE REPORT)


22.4.2
MARKET, BY PROPULSION, AT THE COUNTRY LEVEL (FOR THE COUNTRIES ADDED UP TO 3 IN THE REPORT)


22.4.3
COMPANY INFORMATION


22.4.3.1
PROFILES OF ADDITIONAL MARKET PLAYERS (UP TO FIVE)


22.5
RELATED REPORTS


22.6
AUTHOR DETAILS


LIST OF TABLES


TABLE 1
V2X MARKET DEFINITION, BY COMMUNICATION


TABLE 2
MARKET DEFINITION, BY CHARGING


TABLE 3
MARKET DEFINITION, BY VEHICLE TYPE


TABLE 4
MARKET DEFINITION, BY CONNECTIVITY


TABLE 5
MARKET DEFINITION, BY UNIT


TABLE 6
MARKET DEFINITION, BY PROPULSION


TABLE 7
MARKET DEFINITION, BY OFFERING


TABLE 8
MARKET DEFINITION, BY FITMENT


TABLE 9
MARKET DEFINITION, BY TECHNOLOGY


TABLE 10
MARKET: INCLUSIONS AND EXCLUSIONS


TABLE 11
CURRENCY EXCHANGE RATES, 2021-2025


TABLE 12
MARKET: V2X TECHNOLOGY AND APPLICATION COMPARISON


TABLE 13
MARKET: V2X INTEROPERABILITY AND CYBERSECURITY ASSESSMENT


TABLE 14
MARKET: AFTERMARKET V2X RETROFIT ASSESSMENT


TABLE 15
MARKET: SMART CORRIDOR AND CONNECTED INTERSECTION DEPLOYMENT


TABLE 16
MARKET: V2X COMMERCIALIZATION AND MONETIZATION MODELS


TABLE 17
MARKET: REAL-WORLD V2X INTEROPERABILITY CHALLENGES


TABLE 18
MARKET: IMPACT OF MARKET DYNAMICS


TABLE 19
APPLICATION OVERVIEW OF V2X-ENABLED COOPERATIVE PERCEPTION AND AUTOMATED DRIVING IN MARKET


TABLE 20
GDP PERCENTAGE CHANGE, BY KEY COUNTRY, 2022–2031


TABLE 21
MARKET: ROLE OF KEY PLAYERS IN ECOSYSTEM


TABLE 22
KEY CONFERENCES AND EVENTS, 2027


TABLE 23
BILL OF MATERIALS FOR V2X COMMUNICATION ON BOARD UNIT (USD PER UNIT)


TABLE 24
MARKET: OEM VS. AFTERMARKET V2X DEPLOYMENT STRATEGIES


TABLE 25
MARKET: REVENUE STREAMS BY APPLICATION


TABLE 26
MARKET: TECHNOLOGY EVOLUTION AND ADVANCED USE CASES OF 5G NR-V2X


TABLE 27
MARKET: QUANTIFIED GOVERNMENT RESULTS DEMONSTRATE SAFETY IMPACT OF COOPERATIVE PERCEPTION


TABLE 28
MARKET: LEADING COMPANIES ARE IMPLEMENTING HYBRID PC5–UU CONNECTIVITY FOR V2X


TABLE 29
PATENT REGISTRATIONS IN MARKET, MAY 2026–OCTOBER 2026


TABLE 30
COUNTRY-WISE V2X SPECTRUM ALLOCATION AND REGULATORY REQUIREMENTS


TABLE 31
COUNTRY-WISE V2X TECHNOLOGY DIRECTION AND REGULATORY IMPLICATIONS


TABLE 32
COUNTRY-WISE C-ITS AND AUTOMATED DRIVING REGULATORY FRAMEWORK


TABLE 33
NORTH AMERICA: REGULATORY BODIES, GOVERNMENT AGENCIES, AND OTHER ORGANIZATIONS


TABLE 34
EUROPE: REGULATORY BODIES, GOVERNMENT AGENCIES, AND OTHER ORGANIZATIONS


TABLE 35
ASIA PACIFIC: REGULATORY BODIES, GOVERNMENT AGENCIES, AND OTHER ORGANIZATIONS


TABLE 36
INFLUENCE OF STAKEHOLDERS ON BUYING PROCESS FOR TOP APPLICATIONS (%)


TABLE 37
KEY BUYING CRITERIA FOR TOP APPLICATIONS


TABLE 38
MARKET, BY OFFERING, 2022–2025 (USD MILLION)


TABLE 39
MARKET, BY OFFERING, 2026–2035 (USD MILLION)


TABLE 40
HARDWARE MARKET, BY REGION, 2022–2025 (USD MILLION)


TABLE 41
HARDWARE MARKET, BY REGION, 2026–2035 (USD MILLION)


TABLE 42
SOFTWARE MARKET, BY REGION, 2022–2025 (USD MILLION)


TABLE 43
SOFTWARE MARKET, BY REGION, 2026–2035 (USD MILLION)


TABLE 44
MARKET, BY CHARGING, 2022–2025 (USD MILLION)


TABLE 45
MARKET, BY CHARGING, 2026–2035 (USD MILLION)


TABLE 46
V2L CHARGING MARKET, BY REGION, 2022–2025 (USD MILLION)


TABLE 47
V2L CHARGING MARKET, BY REGION, 2026–2035 (USD MILLION)


TABLE 48
V2H + V2L CHARGING MARKET, BY REGION, 2022–2025 (USD MILLION)


TABLE 49
V2H + V2L CHARGING MARKET, BY REGION, 2026–2035 (USD MILLION)


TABLE 50
V2G + V2H + V2L CHARGING MARKET, BY REGION, 2022–2025 (USD MILLION)


TABLE 51
V2G + V2H + V2L CHARGING MARKET, BY REGION, 2026–2035 (USD MILLION)


TABLE 52
MARKET, BY PROPULSION, 2022–2025 (THOUSAND UNITS)


TABLE 53
MARKET, BY PROPULSION, 2026–2035 (THOUSAND UNITS)


TABLE 54
MARKET, BY PROPULSION, 2022–2025 (USD MILLION)


TABLE 55
MARKET, BY PROPULSION, 2026–2035 (USD MILLION)


TABLE 56
ICE MARKET, BY REGION, 2022–2025 (THOUSAND UNITS)


TABLE 57
ICE MARKET, BY REGION, 2026–2035 (THOUSAND UNITS)


TABLE 58
ICE MARKET, BY REGION, 2022–2025 (USD MILLION)


TABLE 59
ICE V2X MARKET, BY REGION, 2026–2035 (USD MILLION)


TABLE 60
EV V2X MARKET, BY REGION, 2022–2025 (THOUSAND UNITS)


TABLE 61
EV V2X MARKET, BY REGION, 2026–2035 (THOUSAND UNITS)


TABLE 62
EV V2X MARKET, BY REGION, 2022–2025 (USD MILLION)


TABLE 63
EV V2X MARKET, BY REGION, 2026–2035 (USD MILLION)


TABLE 64
V2X MARKET, BY COMMUNICATION, 2022–2025 (THOUSAND UNITS)


TABLE 65
MARKET, BY COMMUNICATION, 2026–2035 (THOUSAND UNITS)


TABLE 66
MARKET, BY COMMUNICATION, 2022–2025 (USD MILLION)


TABLE 67
MARKET, BY COMMUNICATION, 2026–2035 (USD MILLION)


TABLE 68
V2I MARKET, BY REGION, 2022–2025 (THOUSAND UNITS)


TABLE 69
V2I MARKET, BY REGION, 2026–2035 (THOUSAND UNITS)


TABLE 70
V2I MARKET, BY REGION, 2022–2025 (USD MILLION)


TABLE 71
V2I MARKET, BY REGION, 2026–2035 (USD MILLION)


TABLE 72
V2V+V2I MARKET, BY REGION, 2022–2025 (THOUSAND UNITS)


TABLE 73
V2V+V2I MARKET, BY REGION, 2026–2035 (THOUSAND UNITS)


TABLE 74
V2V+V2I MARKET, BY REGION, 2022–2025 (USD MILLION)


TABLE 75
V2V+V2I MARKET, BY REGION, 2026–2035 (USD MILLION)


TABLE 76
V2V+V2N MARKET, BY REGION, 2022–2025 (THOUSAND UNITS)


TABLE 77
V2V+V2N MARKET, BY REGION, 2026–2035 (THOUSAND UNITS)


TABLE 78
V2V+V2N MARKET, BY REGION, 2022–2025 (USD MILLION)


TABLE 79
V2V+V2N MARKET, BY REGION, 2026–2035 (USD MILLION)


TABLE 80
V2V+V2I+V2N MARKET, BY REGION, 2022–2025 (THOUSAND UNITS)


TABLE 81
V2V+V2I+V2N MARKET, BY REGION, 2026–2035 (THOUSAND UNITS)


TABLE 82
V2V+V2I+V2N MARKET, BY REGION, 2022–2025 (USD MILLION)


TABLE 83
V2V+V2I+V2N MARKET, BY REGION, 2026–2035 (USD MILLION)


TABLE 84
MARKET, BY VEHICLE TYPE, 2022–2025 (THOUSAND UNITS)


TABLE 85
MARKET, BY VEHICLE TYPE, 2026–2035 (THOUSAND UNITS)


TABLE 86
PASSENGER CAR V2X MARKET, BY REGION, 2022–2025 (THOUSAND UNITS)


TABLE 87
PASSENGER CAR V2X MARKET, BY REGION, 2026–2035 (THOUSAND UNITS)


TABLE 88
COMMERCIAL VEHICLE V2X MARKET, BY REGION, 2022–2025 (THOUSAND UNITS)


TABLE 89
COMMERCIAL VEHICLE V2X MARKET, BY REGION, 2026–2035 (THOUSAND UNITS)


TABLE 90
MARKET, BY CONNECTIVITY, 2022–2025 (THOUSAND UNITS)


TABLE 91
MARKET, BY CONNECTIVITY, 2026–2035 (THOUSAND UNITS)


TABLE 92
C-MARKET, BY REGION, 2022–2025 (THOUSAND UNITS)


TABLE 93
C-V2X MARKET, BY REGION, 2026–2035 (THOUSAND UNITS)


TABLE 94
DSRC MARKET, BY REGION, 2022–2025 (THOUSAND UNITS)


TABLE 95
DSRC MARKET, BY REGION, 2026–2035 (THOUSAND UNITS)


TABLE 96
MARKET, BY REGION, 2022–2025 (THOUSAND UNITS)


TABLE 97
MARKET, BY REGION, 2026–2035 (THOUSAND UNITS)


TABLE 98
MARKET, BY REGION, 2022–2025 (USD MILLION)


TABLE 99
MARKET, BY REGION, 2026–2035 (USD MILLION)


TABLE 100
ASIA PACIFIC: MARKET, BY COUNTRY, 2022–2025 (THOUSAND UNITS)


TABLE 101
ASIA PACIFIC: MARKET, BY COUNTRY, 2026–2035 (THOUSAND UNITS)


TABLE 102
ASIA PACIFIC: MARKET, BY COUNTRY, 2022–2025 (USD MILLION)


TABLE 103
ASIA PACIFIC: MARKET, BY COUNTRY, 2026–2035 (USD MILLION)


TABLE 104
CHINA: MARKET, BY COMMUNICATION TYPE, 2022–2025 (THOUSAND UNITS)


TABLE 105
CHINA: MARKET, BY COMMUNICATION TYPE, 2026–2035 (THOUSAND UNITS)


TABLE 106
CHINA: MARKET, BY COMMUNICATION TYPE, 2022–2025 (USD MILLION)


TABLE 107
CHINA: MARKET, BY COMMUNICATION TYPE, 2026–2035 (USD MILLION)


TABLE 108
JAPAN: MARKET, BY CAPACITY TYPE, 2022–2025 (THOUSAND UNITS)


TABLE 109
JAPAN: MARKET, BY COMMUNICATION TYPE, 2026–2035 (THOUSAND UNITS)


TABLE 110
JAPAN: MARKET, BY COMMUNICATION TYPE, 2022–2025 (USD MILLION)


TABLE 111
JAPAN: MARKET, BY COMMUNICATION TYPE, 2026–2035 (USD MILLION)


TABLE 112
INDIA: MARKET, BY COMMUNICATION TYPE, 2026–2035 (THOUSAND UNITS)


TABLE 113
INDIA: MARKET, BY COMMUNICATION TYPE, 2026–2035 (USD MILLION)


TABLE 114
SOUTH KOREA: MARKET, BY COMMUNICATION TYPE, 2026–2035 (THOUSAND UNITS)


TABLE 115
SOUTH KOREA: MARKET, BY COMMUNICATION TYPE, 2026–2035 (USD MILLION)


TABLE 116
EUROPE: MARKET, BY COUNTRY, 2022–2025 (THOUSAND UNITS)


TABLE 117
EUROPE: MARKET, BY COUNTRY, 2026–2035 (THOUSAND UNITS)


TABLE 118
EUROPE: MARKET, BY COUNTRY, 2022–2025 (USD MILLION)


TABLE 119
EUROPE: MARKET, BY COUNTRY, 2026–2035 (USD MILLION)


TABLE 120
GERMANY: MARKET, BY COMMUNICATION TYPE, 2022–2025 (THOUSAND UNITS)


TABLE 121
GERMANY: MARKET, BY COMMUNICATION TYPE, 2026–2035 (THOUSAND UNITS)


TABLE 122
GERMANY: MARKET, BY COMMUNICATION TYPE, 2022–2025 (USD MILLION)


TABLE 123
GERMANY: MARKET, BY COMMUNICATION TYPE, 2026–2035 (USD MILLION)


TABLE 124
FRANCE: MARKET, BY COMMUNICATION TYPE, 2026–2035 (THOUSAND UNITS)


TABLE 125
FRANCE: MARKET, BY COMMUNICATION TYPE, 2026–2035 (USD MILLION)


TABLE 126
ITALY: MARKET, BY COMMUNICATION TYPE, 2026–2035 (THOUSAND UNITS)


TABLE 127
ITALY: MARKET, BY COMMUNICATION TYPE, 2026–2035 (USD MILLION)


TABLE 128
SPAIN: MARKET, BY COMMUNICATION TYPE, 2026–2035 (THOUSAND UNITS)


TABLE 129
SPAIN: MARKET, BY COMMUNICATION TYPE, 2026–2035 (USD MILLION)


TABLE 130
UK: MARKET, BY COMMUNICATION TYPE, 2026–2035 (THOUSAND UNITS)


TABLE 131
UK: MARKET, BY COMMUNICATION TYPE, 2026–2035 (USD MILLION)


TABLE 132
NORTH AMERICA: MARKET, BY COUNTRY, 2022–2025 (THOUSAND UNITS)


TABLE 133
NORTH AMERICA: MARKET, BY COUNTRY, 2026–2035 (THOUSAND UNITS)


TABLE 134
NORTH AMERICA: MARKET, BY COUNTRY, 2022–2025 (USD MILLION)


TABLE 135
NORTH AMERICA: MARKET, BY COUNTRY, 2026–2035 (USD MILLION)


TABLE 136
US: MARKET, BY COMMUNICATION TYPE, 2022–2025 (THOUSAND UNITS)


TABLE 137
US: MARKET, BY COMMUNICATION TYPE, 2026–2035 (THOUSAND UNITS)


TABLE 138
US: MARKET, BY COMMUNICATION TYPE, 2022–2025 (USD MILLION)


TABLE 139
US: MARKET, BY COMMUNICATION TYPE, 2026–2035 (USD MILLION)


TABLE 140
CANADA: MARKET, BY COMMUNICATION TYPE, 2022–2025 (THOUSAND UNITS)


TABLE 141
CANADA: MARKET, BY COMMUNICATION TYPE, 2026–2035 (THOUSAND UNITS)


TABLE 142
CANADA: MARKET, BY COMMUNICATION TYPE, 2022–2025 (USD MILLION)


TABLE 143
CANADA: MARKET, BY COMMUNICATION TYPE, 2026–2035 (USD MILLION)


TABLE 144
MEXICO: MARKET, BY COMMUNICATION TYPE, 2022–2025 (THOUSAND UNITS)


TABLE 145
MEXICO: MARKET, BY COMMUNICATION TYPE, 2026–2035 (THOUSAND UNITS)


TABLE 146
MEXICO: MARKET, BY COMMUNICATION TYPE, 2022–2025 (USD MILLION)


TABLE 147
MEXICO: MARKET, BY COMMUNICATION TYPE, 2026–2035 (USD MILLION)


TABLE 148
REST OF THE WORLD: MARKET, BY COUNTRY, 2026–2035 (THOUSAND UNITS)


TABLE 149
REST OF THE WORLD: MARKET, BY COUNTRY, 2026–2035 (USD MILLION)


TABLE 150
BRAZIL: MARKET, BY COMMUNICATION TYPE, 2026–2035 (THOUSAND UNITS)


TABLE 151
BRAZIL: MARKET, BY COMMUNICATION TYPE, 2026–2035 (USD MILLION)


TABLE 152
ARGENTINA: MARKET, BY COMMUNICATION TYPE, 2026–2035 (THOUSAND UNITS)


TABLE 153
ARGENTINA: MARKET, BY COMMUNICATION TYPE, 2026–2035 (USD MILLION)


TABLE 154
OVERVIEW OF STRATEGIES DEPLOYED BY KEY COMPANIES


TABLE 155
DEGREE OF COMPETITION IN MARKET, 2025


TABLE 156
MARKET: REGION FOOTPRINT, 2025


TABLE 157
MARKET: VEHICLE TYPE FOOTPRINT, 2025


TABLE 158
MARKET: KEY STARTUPS/SMES


TABLE 159
COMPETITIVE BENCHMARKING OF KEY STARTUPS/SMES


TABLE 160
MARKET: PRODUCT LAUNCHES/DEVELOPMENTS/ENHANCEMENTS, JANUARY 2022–OCTOBER 2026


TABLE 161
MARKET: DEALS, JANUARY 2022–OCTOBER 2026


TABLE 162
MARKET: EXPANSIONS, JANUARY 2022–OCTOBER 2026


TABLE 163
MARKET: OTHER DEVELOPMENTS, JANUARY 2022–OCTOBER 2026


TABLE 164
QUALCOMM INCORPORATED: COMPANY OVERVIEW


TABLE 165
QUALCOMM INCORPORATED: PRODUCTS/SOLUTIONS/SERVICES OFFERED


TABLE 166
QUALCOMM INCORPORATED: PRODUCT LAUNCHES


TABLE 167
QUALCOMM INCORPORATED: DEALS


TABLE 168
QUALCOMM INCORPORATED: EXPANSIONS


TABLE 169
HARMAN INTERNATIONAL: COMPANY OVERVIEW


TABLE 170
HARMAN INTERNATIONAL: PRODUCTS/SOLUTIONS/SERVICES OFFERED


TABLE 171
HARMAN INTERNATIONAL: PRODUCT LAUNCHES/ENHANCEMENTS


TABLE 172
HARMAN INTERNATIONAL: DEALS


TABLE 173
HARMAN INTERNATIONAL: OTHER DEVELOPMENTS


TABLE 174
HUAWEI TECHNOLOGIES CO., LTD.: COMPANY OVERVIEW


TABLE 175
HUAWEI TECHNOLOGIES CO., LTD.: PRODUCTS/SOLUTIONS/SERVICES OFFERED


TABLE 176
HUAWEI TECHNOLOGIES CO., LTD.: PRODUCT LAUNCHES


TABLE 177
HUAWEI TECHNOLOGIES CO., LTD.: DEALS


TABLE 178
NXP SEMICONDUCTORS: COMPANY OVERVIEW


TABLE 179
NXP SEMICONDUCTORS: PRODUCTS/SOLUTIONS/SERVICES OFFERED


TABLE 180
NXP SEMICONDUCTORS: DEALS


TABLE 181
NXP SEMICONDUCTORS: EXPANSIONS


TABLE 182
NXP SEMICONDUCTORS: OTHER DEVELOPMENTS


TABLE 183
AUMOVIO SE: COMPANY OVERVIEW


TABLE 184
AUMOVIO SE: PRODUCTS/SOLUTIONS/SERVICES OFFERED


TABLE 185
AUMOVIO SE: DEALS


TABLE 186
ROBERT BOSCH GMBH: COMPANY OVERVIEW


TABLE 187
ROBERT BOSCH GMBH: PRODUCTS/SOLUTIONS/SERVICES OFFERED


TABLE 188
ROBERT BOSCH GMBH: KEY CUSTOMERS


TABLE 189
ROBERT BOSCH GMBH: PRODUCT LAUNCHES


TABLE 190
ROBERT BOSCH GMBH: DEALS


TABLE 191
ROBERT BOSCH GMBH: OTHER DEVELOPMENTS


TABLE 192
COHDA WIRELESS: COMPANY OVERVIEW


TABLE 193
COHDA WIRELESS: PRODUCTS/SOLUTIONS/SERVICES OFFERED


TABLE 194
COHDA WIRELESS: DEALS


TABLE 195
COHDA WIRELESS: OTHER DEVELOPMENTS


TABLE 196
INFINEON TECHNOLOGIES AG: COMPANY OVERVIEW


TABLE 197
INFINEON TECHNOLOGIES AG: KEY CUSTOMERS


TABLE 198
INFINEON TECHNOLOGIES AG: PRODUCTS/SOLUTIONS/SERVICES OFFERED


TABLE 199
INFINEON TECHNOLOGIES AG: PRODUCT LAUNCHES/DEVELOPMENTS


TABLE 200
INFINEON TECHNOLOGIES AG: DEALS


TABLE 201
DENSO CORPORATION: COMPANY OVERVIEW


TABLE 202
DENSO CORPORATION: KEY CUSTOMERS


TABLE 203
DENSO CORPORATION: PRODUCTS/SOLUTIONS/SERVICES OFFERED


TABLE 204
DENSO CORPORATION: PRODUCT LAUNCHES


TABLE 205
DENSO CORPORATION: DEALS


TABLE 206
STMICROELECTRONICS: COMPANY OVERVIEW


TABLE 207
STMICROELECTRONICS: PRODUCTS/SOLUTIONS/SERVICES OFFERED


TABLE 208
STMICROELECTRONICS: PRODUCT LAUNCHES


TABLE 209
STMICROELECTRONICS: DEALS


TABLE 210
HYUNDAI MOBIS: COMPANY OVERVIEW


TABLE 211
HYUNDAI MOBIS: PRODUCTS/SOLUTIONS/SERVICES OFFERED


TABLE 212
HYUNDAI MOBIS: PRODUCT DEVELOPMENTS


TABLE 213
HYUNDAI MOBIS: DEALS


TABLE 214
KAPSCH GROUP: COMPANY OVERVIEW


TABLE 215
KAPSCH GROUP: PRODUCTS/SOLUTIONS/SERVICES OFFERED


TABLE 216
KAPSCH GROUP: PRODUCT LAUNCHES


TABLE 217
KAPSCH GROUP: DEALS


TABLE 218
KAPSCH GROUP: OTHER DEVELOPMENTS


TABLE 219
MARBEN PRODUCTS: COMPANY OVERVIEW


TABLE 220
CAPGEMINI ENGINEERING: COMPANY OVERVIEW


TABLE 221
NOKIA: COMPANY OVERVIEW


TABLE 222
DSPACE GMBH: COMPANY OVERVIEW


TABLE 223
FICOSA INTERNACIONAL SA: COMPANY OVERVIEW


TABLE 224
VECTOR INFORMATIK GMBH: COMPANY OVERVIEW


TABLE 225
BMW AG: COMPANY OVERVIEW


TABLE 226
MERCEDES-BENZ GROUP AG: COMPANY OVERVIEW


TABLE 227
RENAULT GROUP: COMPANY OVERVIEW


TABLE 228
UNEX TECHNOLOGY CORP.: COMPANY OVERVIEW


TABLE 229
MITSUBISHI ELECTRIC CORPORATION: COMPANY OVERVIEW


TABLE 230
FLEX LTD.: COMPANY OVERVIEW


TABLE 231
TATA MOTORS PASSENGER VEHICLES LIMITED: COMPANY OVERVIEW


TABLE 232
HITACHI SOLUTIONS, LTD.: COMPANY OVERVIEW


TABLE 233
NISSAN MOTOR CO., LTD.: COMPANY OVERVIEW


TABLE 234
LEAR CORPORATION: COMPANY OVERVIEW


TABLE 235
INTEL CORPORATION: COMPANY OVERVIEW


TABLE 236
DANLAW, INC.: COMPANY OVERVIEW


TABLE 237
COMMSIGNIA LTD.: COMPANY OVERVIEW


TABLE 238
GENERAL MOTORS: COMPANY OVERVIEW


TABLE 239
FORD MOTOR COMPANY: COMPANY OVERVIEW


LIST OF FIGURES


FIGURE 1
V2X SEGMENTATION AND REGIONAL SNAPSHOT


FIGURE 2
MARKET SCENARIO


FIGURE 3
MARKET, BY COMMUNICATION, 2022–2035


FIGURE 4
MAJOR STRATEGIES ADOPTED BY KEY PLAYERS IN MARKET, 2022–2026


FIGURE 5
DISRUPTIONS INFLUENCING GROWTH OF MARKET


FIGURE 6
HIGH-GROWTH SEGMENTS IN MARKET, 2026–2035


FIGURE 7
ASIA PACIFIC TO BE LARGEST MARKET, IN TERMS OF VALUE, DURING FORECAST PERIOD


FIGURE 8
SHIFT TOWARD CONNECTED VEHICLE TECHNOLOGIES AND INTEGRATED COMMUNICATION SYSTEMS DRIVING MARKET GROWTH


FIGURE 9
ELECTRIFICATION AND CONNECTED POWERTRAIN PLATFORMS CREATING NEW V2X INTEGRATION OPPORTUNITIES


FIGURE 10
SHIFT TOWARDS AUTONOMOUS AND CONNECTED TRANSPORT TO DRIVE MARKET IN PASSENGER CARS


FIGURE 11
GROWING OEM INTEGRATION OF ONBOARD V2X UNITS SUPPORTING CONNECTED VEHICLE SAFETY


FIGURE 12
ADVANCEMENTS IN CELLULAR CONNECTIVITY SUPPORTING REAL-TIME VEHICLE COMMUNICATION


FIGURE 13
MULTI-APPLICATION V2X SYSTEMS TO DRIVE SOFTWARE CONTENT PER V2X SYSTEMS


FIGURE 14
CONNECTED CHARGING INFRASTRUCTURE CREATING OPPORTUNITIES FOR V2X-ENABLED ENERGY COMMUNICATION


FIGURE 15
MARKET: DRIVERS, RESTRAINTS, OPPORTUNITIES, AND CHALLENGES


FIGURE 16
MARKET: SUPPLY CHAIN ANALYSIS


FIGURE 17
MARKET: ECOSYSTEM MAPPING


FIGURE 18
AVERAGE SELLING PRICE OF MARKET, BY V2X COMMUNICATION TYPE, 2024–2026


FIGURE 19
AVERAGE SELLING PRICE OF V2X, BY REGION, 2024–2026


FIGURE 20
TRENDS AND DISRUPTIONS IMPACTING CUSTOMER BUSINESSES


FIGURE 21
INVESTMENT AND FUNDING, 2022–2025


FIGURE 22
BILL OF MATERIALS FOR V2X COMMUNICATION ON BOARD UNIT (USD PER UNIT)


FIGURE 23
MARKET: INCREASING OPERATIONAL BENEFITS


FIGURE 24
V2X TECHNOLOGY AND PRODUCT ROADMAP


FIGURE 25
PUBLICATION TRENDS, 2015–2026


FIGURE 26
INFLUENCE OF STAKEHOLDERS ON BUYING PROCESS FOR TOP APPLICATIONS


FIGURE 27
KEY BUYING CRITERIA FOR TOP APPLICATIONS


FIGURE 28
MARKET, BY OFFERING, 2026 VS. 2035


FIGURE 29
MARKET, BY CHARGING, 2026 VS. 2035


FIGURE 30
MARKET, BY PROPULSION, 2026 VS. 2035


FIGURE 31
MARKET, BY COMMUNICATION, 2026 VS. 2035


FIGURE 32
MARKET, BY VEHICLE TYPE, 2026 VS. 2035


FIGURE 33
MARKET, BY CONNECTIVITY, 2026 VS. 2035


FIGURE 34
MARKET, BY REGION, 2026 VS. 2035 (USD MILLION)


FIGURE 35
ASIA PACIFIC: MARKET SNAPSHOT


FIGURE 36
EUROPE: MARKET SNAPSHOT


FIGURE 37
NORTH AMERICA: MARKET SNAPSHOT


FIGURE 38
REST OF THE WORLD: MARKET SNAPSHOT


FIGURE 39
MARKET SHARE ANALYSIS, 2025


FIGURE 40
MARKET: REVENUE ANALYSIS OF KEY PLAYERS, 2021–2025


FIGURE 41
COMPANY VALUATION OF KEY PLAYERS, 2026 (USD BILLION)


FIGURE 42
FINANCIAL METRICS OF KEY PLAYERS (EV/EBITDA), 2026


FIGURE 43
MARKET: BRAND/PRODUCT COMPARISON


FIGURE 44
MARKET: COMPANY EVALUATION MATRIX (KEY PLAYERS), 2025


FIGURE 45
MARKET: COMPANY FOOTPRINT, 2025


FIGURE 46
MARKET: COMPANY EVALUATION MATRIX (STARTUPS/SMES), 2025


FIGURE 47
QUALCOMM INCORPORATED: COMPANY SNAPSHOT


FIGURE 48
HARMAN INTERNATIONAL: COMPANY SNAPSHOT


FIGURE 49
HUAWEI TECHNOLOGIES CO., LTD.: COMPANY SNAPSHOT


FIGURE 50
NXP SEMICONDUCTORS: COMPANY SNAPSHOT


FIGURE 51
AUMOVIO SE: COMPANY SNAPSHOT


FIGURE 52
ROBERT BOSCH GMBH: COMPANY SNAPSHOT


FIGURE 53
INFINEON TECHNOLOGIES AG: COMPANY SNAPSHOT


FIGURE 54
DENSO CORPORATION: COMPANY SNAPSHOT


FIGURE 55
STMICROELECTRONICS: COMPANY SNAPSHOT


FIGURE 56
HYUNDAI MOBIS: COMPANY SNAPSHOT


FIGURE 57
MARKET: RESEARCH DESIGN


FIGURE 58
RESEARCH DESIGN MODEL


FIGURE 59
KEY INDUSTRY INSIGHTS


FIGURE 60
BREAKDOWN OF PRIMARY INTERVIEWS


FIGURE 61
RESEARCH METHODOLOGY: HYPOTHESIS BUILDING


FIGURE 62
BOTTOM-UP APPROACH


FIGURE 63
TOP-DOWN APPROACH


FIGURE 64
MARKET BREAKDOWN AND DATA TRIANGULATION


FIGURE 65
MARKET GROWTH PROJECTIONS FROM SUPPLY-SIDE DRIVERS AND OPPORTUNITIES


Methodology

Various secondary sources, directories, and databases were used to identify and collect information for an extensive V2X market study. The study involved four main activities in estimating the current size of the V2X market: secondary research, validation through primary research, assumptions, and market analysis. The research study involved various secondary sources, such as company annual reports/presentations, industry association publications, automotive wiring harness magazine articles, directories, technical handbooks, World Economic Outlook, trade websites, technical articles, and databases, which were used to identify and collect information for an extensive study of the market. Primary sources like experts from automotive OEMs, Tier 1 suppliers, and V2X providers were interviewed to obtain and verify critical information and assess prospects and market estimations.

Secondary Research

Secondary sources referred to for this research study included automotive V2X industry organizations; corporate filings such as annual reports, investor presentations, and financial statements; trade and business whitepapers and databases; and articles from recognized associations and government publishing sources. The secondary data was collected and analyzed to arrive at the overall market size, which was further validated by primary research.

Primary Research

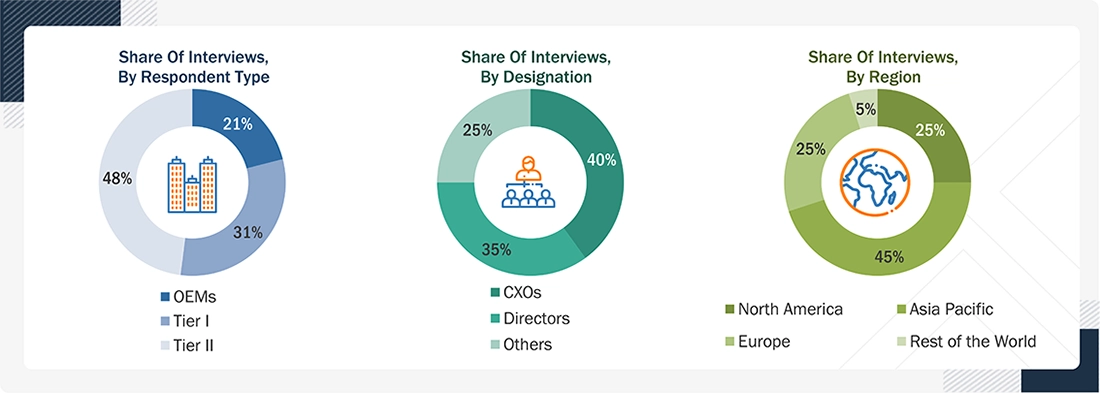
Extensive primary research was conducted after acquiring an understanding of this market scenario through secondary research. Several primary interviews were conducted with market experts from the demand- and supply-side OEMs (in terms of component supply, country-level government associations, and trade associations) and component manufacturers across four major regions, namely, Asia Pacific- 35%, Europe- 25%, North America- 25%, and the Rest of the World-5%. Approximately 60% and 40% of primary interviews were conducted from the demand and supply sides, respectively. Primary data was collected through questionnaires, emails, LinkedIn, and telephonic interviews. In the canvassing of primary data, various departments within organizations, such as sales, operations, and administration, were consulted to provide a holistic viewpoint in our report.

Brief sessions with highly experienced independent consultants were conducted to reinforce findings from primaries after interacting with industry experts. This, along with the in-house subject matter experts’ opinions, led to the findings described in the remainder of this report.

In the primary research process, various primary sources from the supply and demand sides were interviewed to obtain qualitative and quantitative information for the report. The primary sources from the supply side included industry experts, such as Vice Presidents (VPs), marketing directors, technology and innovation directors, and related key executives from various key companies and organizations. The primary sources from the demand side included end users, such as Chief Information Officers (CIOs), consultants, service professionals, technicians and technologists, and managers at public and investor-owned utilities.

Breakdown of Primary Interviews

V2X Market  Size, and Share

To know about the assumptions considered for the study, download the pdf brochure

Market Size Estimation

The V2X market was estimated and validated using both top-down and bottom-up approaches. In the top-down approach, the global market value was derived through revenue analysis of key market players. V2X penetration rates are estimated using secondary research, industry databases, and primary interviews. Country-level market values were allocated to individual segments based on their respective shares, aggregated to derive regional market values, and consolidated to estimate the global market by communication type. The same approach was followed for other segments, including vehicle type, propulsion, connectivity, offering, communication unit, and fitment. In the bottom-up approach, country-level V2X-enabled vehicle volumes were identified using paid databases, vehicle production data, secondary research, and OEM model mapping. Vehicle production volumes are multiplied by the average selling price of V2X communication systems to estimate market size by communication type in terms of volume (thousand units) and value (USD million). Country-level estimates were aggregated to derive regional market values. Both approaches were cross-validated through primary interviews with OEMs, Tier 1 suppliers, V2X module manufacturers, and industry experts to establish the final market estimate.

V2X Market: Top-Down and Bottom-Up Approach

V2X Market Top Down and Bottom Up Approach

Data Triangulation

After arriving at the overall market size using the market size estimation processes as explained above, the market was split into several segments and subsegments. To complete the overall market engineering process and arrive at the exact statistics of each market segment and subsegment, data triangulation and market breakdown procedures were employed, wherever applicable. The data was triangulated by studying various factors and trends from both the demand and supply sides.

Market Definition

According to NXP Semiconductors (Netherlands), V2X technology enables cars to communicate with their surroundings and makes driving safer and more efficient for everyone. V2X is communication technology that helps connect vehicles with infrastructure and thus facilitates the implementation of an intelligent transport system. It allows vehicles to communicate with the moving traffic system in their surrounding environment. It operates at 5.9GHz frequency globally.

Key Stakeholders

  • Automotive Original Equipment Manufacturers (OEMs)
  • Electronic Design Automation (EDA) and Internet Protocol (IP) Core Vendors
  • Navigation Devices and GPS Manufacturers
  • ODM and OEM Technology Solution Providers
  • Regulatory and Transportation Authorities
  • Software Providers
  • V2X Providers
  • Organizations, Forums, Alliances, and Associations
  • State & National Regulatory Authorities
  • V2X Network Providers
     

Report Objectives

  • To segment and forecast the V2X market in terms of value (USD million) and volume (thousand units)
    • By offering (hardware and software)
    • By V2X charging type (V2L, V2H, and V2G)
    • By propulsion (ICE and EV)
    • By V2X communication Type (V2I, V2V+V2I, V2V+V2N, and V2V+V2I+V2N)
    • By region (Asia Pacific, Europe, North America, and Rest of the World)
  • To segment and forecast the market in terms of volume (thousand units)
    • By connectivity [dedicated short-range communications (DSRC) and cellular V2X]
    • By vehicle type (passenger cars and commercial vehicles)
  • To segment the market qualitatively
    • By unit (on-board unit and roadside unit)
    • By fitment (plug and play, retrofit, integrated fitment)
    • By technology (automated driver assistance, intelligent traffic system, emergency vehicle notification, passenger information system, fleet and asset management, parking management system, line of sight, non-line of sight, and backing)
  • To analyze regional markets for growth trends, prospects, and their contribution to the overall market
  • To define, describe, and forecast the size of the V2X market with respect to growth trends and prospects, and determine the contribution of the segments to the total market
  • To provide detailed information regarding the major factors (drivers, challenges, restraints, and opportunities) influencing market growth
  • To strategically analyze markets with respect to individual growth trends, prospects, and contribution to the total market
  • To analyze opportunities for stakeholders and the competitive landscape for market leaders
  • To study the following with respect to the market -
    • Supply chain analysis
    • Ecosystem analysis
    • Pricing analysis
    • Technology analysis
    • HS code
    • Case study analysis
    • Patent analysis
    • Impact of AI
    • Impact of 2026 India-EU FTA
    • Regulatory landscape
    • Key stakeholders and buying criteria
    • Key conferences & events
    • Bill of materials
    • V2X spectrum allocation
    • V2X technology regulatory direction
    • C-ITS & automated driving regulations
  • To strategically profile key players and comprehensively analyze their market share and core competencies
  • To track and analyze competitive developments such as deals (mergers & acquisitions, partnerships, collaborations), product developments, and other activities carried out by key industry participants

Available customizations:

With the given market data, MarketsandMarkets offers customizations in line with company-specific needs.

  • V2X market, by charging, at the country level (for regions covered in the report)
  • V2X market, by propulsion, at the country level (for the countries, an addition of up to 3, in the report)

Company Information

  • Profiling of additional market players (up to 5)


Personalize This Research

  • Triangulate with your Own Data
  • Get Data as per your Format and Definition
  • Gain a Deeper Dive on a Specific Application, Geography, Customer or Competitor
  • Any level of Personalization
Request A Free Customisation

Let Us Help You

  • What are the Known and Unknown Adjacencies Impacting the V2X Market
  • What will your New Revenue Sources be?
  • Who will be your Top Customer; what will make them switch?
  • Defend your Market Share or Win Competitors
  • Get a Scorecard for Target Partners
Customized Workshop Request

Custom Market Research Services

We Will Customise The Research For You, In Case The Report Listed Above Does Not Meet With Your Requirements

Get 10% Free Customisation

TESTIMONIALS

Growth opportunities and latent adjacency in V2X Market

THIS REPORT TELLS YOU

How big the V2X market is, and who leads it.

GROWTHIQ TELLS YOU NEW

Where your company should play next, and who is taking your share.

Get your company's view of this market. Free snapshot.

DMCA.com Protection Status
popup img