Aviation Connectors Market by Application (Landing Gear, Engine Control System, Avionics, Cabin Equipment, Others), Type (PCB, High Power, High Speed, RF Connectors, Fiber Optics), Shape (Circular, Rectangular), & Region - Global Forecast to 2035


 Exclusive indicates content/data unique to MarketsandMarkets and not available with any competitors.
Table of Contents
1 Introduction (Page No. - 16)
1.1 Objectives of the Study
1.2 Market Definition
1.3 Study Scope
1.3.1 Markets Covered
1.3.2 Geographic Scope
1.3.3 Years Considered for the Study
1.4 Currency
1.5 Limitations
1.6 Market Stakeholders
2 Research Methodology (Page No. - 21)
2.1 Introduction
2.2 Research Data
2.2.1 Secondary Data
2.2.1.1 Key Data From Secondary Sources
2.2.2 Primary Data
2.2.2.1 Key Data From Primary Sources
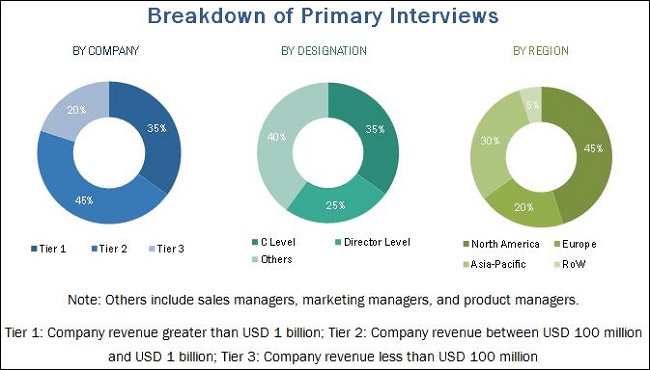
2.2.2.2 Breakdown of Primaries, By Company, Designation, and Region
2.3 Factor Analysis
2.3.1 Introduction
2.3.2 Demand-Side Indicators
2.3.2.1 Demand for Greater Bandwidth, and Reduced Usage of Size, Weight and Power (SWAP)
2.3.3 Supply-Side Indicators
2.3.3.1 Increase in R&D Investment for Better Design and Cost Effectiveness
2.4 Market Size Estimation
2.4.1 Bottom-Up Approach
2.4.2 Top-Down Approach
2.5 Market Breakdown and Data Triangulation
2.6 Research Assumptions
3 Executive Summary (Page No. - 31)
4 Premium Insights (Page No. - 37)
4.1 Attractive Opportunities in the Aviation Connector Market
4.2 Market, By Region
4.3 Market, By End User & Region
4.4 Market, By Application
4.5 Market, By Type
4.6 Market, By Shape
4.7 Market, By Platform
5 Market Overview (Page No. - 42)
5.1 Introduction
5.2 Market Segmentation
5.2.1 Market: By Shape
5.2.2 Market: By Type
5.2.3 Market: By Application
5.2.4 Market: By End User
5.2.5 Market: By Platform
5.3 Market Dynamics
5.3.1 Drivers
5.3.1.1 Growth in the Number of Aircraft Deliveries
5.3.1.2 Shift Towards Electric Architecture and Technology
5.3.2 Restraints
5.3.2.1 Existing Backlogs of Aircraft Deliveries
5.3.3 Opportunities
5.3.3.1 Diverse Applications of Connectors in an Aircraft
5.3.4 Challenges
5.3.4.1 Obtaining Quality Accreditations
6 Industry Trends (Page No. - 52)
6.1 Introduction
6.2 Technological Specifications
6.2.1 Real World Requirements
6.2.2 Interconnect Considerations
6.2.3 Signal Integrity
6.2.4 Size, Weight, and Speed
6.2.5 Mobile, Miniature, and Modern
6.2.6 Commonality and Crossover
6.2.7 Ongoing Upgrades
6.3 Technology Trends
6.3.1 Backplane Connectors
6.3.2 I/O Connectors
6.3.3 Optical Interfaces
6.3.4 High Density Subminiature Connectors
6.4 Technological Advancements
6.4.1 Impact of Technological Advancements on the Aviation Connector Market
6.4.1.1 Industry Consolidation
6.4.1.2 Globalization
6.4.1.3 Relentless Cost Pressures
6.4.1.4 Organizational Productivity
6.4.1.5 Industry Standardization
6.5 Mapping of Top Manufacturers and Latest Innovations in the Aviation Connector Market
6.6 Pricing Analysis on the Basis of Shape
6.7 Patent Registrations (2011-2013)
7 Aviation Connectors Market, By End User (Page No. - 62)
7.1 Introduction
7.2 Commercial
7.3 Business Jets
7.4 Military
7.5 Others
8 Aviation Connector Market, By Type (Page No. - 67)
8.1 Introduction
8.2 PCB (Printed Circuit Board)
8.3 High Power
8.4 High Speed
8.5 RF Connectors
8.6 Fiber Optic
9 Aviation Connectors Market, By Shape (Page No. - 74)
9.1 Introduction
9.2 Circular
9.2.1 Coaxial Connectors
9.3 Rectangular
9.3.1 D Subminiature Connectors
10 Aviation Connectors Market, By Application (Page No. - 78)
10.1 Introduction
10.2 Landing Gear
10.3 Engine Control System
10.4 Avionics
10.5 Cabin Equipment
10.6 Others
11 Aviation Connectors Market, By Platform (Page No. - 84)
11.1 Introduction
11.2 Fixed Wing
11.3 Rotary Wing
12 Regional Analysis (Page No. - 88)
12.1 Introduction
12.2 North America
12.2.1 By Country
12.2.2 By Application
12.2.3 By Shape
12.2.4 By Type
12.2.5 By Platform
12.2.6 By End User
12.2.7 U.S.
12.2.7.1 By End User
12.2.8 Canada
12.2.8.1 By End User
12.3 Europe
12.3.1 By Country
12.3.2 By Application
12.3.3 By Shape
12.3.4 By Type
12.3.5 By Platform
12.3.6 By End User
12.3.7 U.K.
12.3.7.1 By End User
12.3.8 France
12.3.8.1 By End User
12.3.9 Germany
12.3.9.1 By End User
12.3.10 Italy
12.3.10.1 By End User
12.3.11 Rest of Europe
12.3.11.1 By End User
12.4 Asia-Pacific
12.4.1 By Country
12.4.2 By Application
12.4.3 By Shape
12.4.4 By Type
12.4.5 By Platform
12.4.6 By End User
12.4.7 Russia
12.4.7.1 By End User
12.4.8 Japan
12.4.8.1 By End User
12.4.9 China
12.4.9.1 By End User
12.4.10 Rest of APAC
12.4.10.1 By End User
12.5 Rest of the World (RoW)
12.5.1 By Region
12.5.2 By Application
12.5.3 By Shape
12.5.4 By Type
12.5.5 By Platform
12.5.6 By End User
12.5.7 Latin America
12.5.7.1 By End User
12.5.8 Middle East
12.5.8.1 By End User
12.5.9 Africa
12.5.9.1 By End User
13 Competitive Landscape (Page No. - 116)
13.1 Introduction
13.2 Market Share Analysis of Top Players in the Aviation Connector Market
13.3 Regional Mapping of Leading Companies in the Market
13.4 Top Five Mergers & Acquisitions in the Market
13.4.1 New Product Launches
13.4.2 Partnerships, Agreements, and Acquisitions
13.4.3 Others (Events, Recognition, and Certifications)
14 Company Profiles (Page No. - 125)
(Overview, Products and Services, Financials, Strategy & Development)*
14.1 Introduction
14.2 Financial Highlights of Major Players in the Market
14.3 Amphenol Corporation
14.4 TE Connectivity
14.5 Carlisle Companies Inc.
14.6 Esterline Corporation
14.7 Bel Fuse Inc.
14.8 Eaton Corporation
14.9 ITT Corporation
14.10 Smiths Group PLC
14.11 Radiall
14.12 Rosenberger Group
*Details on Overview, Products and Services, Financials, Strategy & Development Might Not Be Captured in Case of Unlisted Companies
15 Appendix (Page No. - 161)
15.1 Discussion Guide
15.2 Knowledge Store: Marketsandmarkets’ Subscription Portal
15.3 Introducing RT: Real-Time Market Intelligence
15.4 Available Customizations
15.5 Related Reports
15.6 Author Details
List of Tables (68 Tables)
Table 1 Innovations in Market
Table 2 Patent Registrations
Table 3 Market Size, By End User, 2014-2022 (USD Million)
Table 4 Commercial Segment, By Region, 2014-2022 (USD Million)
Table 5 Business Jets Segment, By Region, 2014-2022 (USD Million)
Table 6 Military Segment, By Region, 2014-2022 (USD Million)
Table 7 Others Segment, By Region, 2014-2022 (USD Million)
Table 8 Market Size, By Type, 2014-2022 (USD Million)
Table 9 PCB Segment, By Region, 2014-2022 (USD Million)
Table 10 High Power Segment, By Region, 2014-2022 (USD Million)
Table 11 High Speed Segment, By Region, 2014-2022 (USD Million)
Table 12 RF Connectors Segment, By Region, 2014-2022 (USD Million)
Table 13 Fiber Optic Segment, By Region, 2014-2022 (USD Million)
Table 14 Market, By Shape, 2014-2022 (USD Million)
Table 15 Circular Segment, By Region, 2014-2022 (USD Million)
Table 16 Rectangular Segment, By Region, 2014-2022 (USD Million)
Table 17 Market, By Application, 2014-2022 (USD Million)
Table 18 Landing Gear Segment, By Region, 2014-2022 (USD Million)
Table 19 Engine Control System Segment, By Region, 2014-2022 (USD Million)
Table 20 Avionics Segment, By Region, 2014-2022 (USD Million)
Table 21 Cabin Equipment Segment, By Region, 2014-2022 (USD Million)
Table 22 Others Segment, By Region, 2014-2022 (USD Million)
Table 23 Market Size, By Platform, 2014-2022 (USD Million)
Table 24 Fixed Wing Segment, By Region, 2014-2022 (USD Million)
Table 25 Rotary Wing Segment, By Region, 2014-2022 (USD Million)
Table 26 Market Size, By Region, 2014-2022 (USD Million)
Table 27 North America Market Size, By Country, 2014-2022 (USD Million)
Table 28 North America Market Size, By Application, 2014-2022 (USD Million)
Table 29 North America Market Size, By Shape, 2014-2022 (USD Million)
Table 30 North America Market Size, By Type, 2014-2022 (USD Million)
Table 31 North America Market Size, By Platform, 2014-2022 (USD Million)
Table 32 North America Market Size, By End User, 2014-2022 (USD Million)
Table 33 U.S. Market Size, By End User, 2014-2022 (USD Million)
Table 34 Canada Market Size, By End User, 2014-2022 (USD Million)
Table 35 Europe Market Size, By Country, 2014-2022 (USD Million)
Table 36 Europe Market Size, By Application, 2014-2022 (USD Million)
Table 37 Europe Market Size, By Shape, 2014-2022 (USD Million)
Table 38 Europe Market Size, By Type, 2014-2022 (USD Million)
Table 39 Europe Market Size, By Platform, 2014-2022 (USD Million)
Table 40 Europe Market Size, By End User, 2014-2022 (USD Million)
Table 41 U.K. Market Size, By End User, 2014-2022 (USD Million)
Table 42 France Market Size, By End User, 2014-2022 (USD Million)
Table 43 Germany Market Size, By End User, 2014-2022 (USD Million)
Table 44 Italy Market Size, By End User, 2014-2022 (USD Million)
Table 45 Rest of Europe Market Size, By End User, 2014-2022 (USD Million)
Table 46 Asia-Pacific Market Size, By Country, 2014-2022 (USD Million)
Table 47 Asia-Pacific Market Size, By Application, 2014-2022 (USD Million)
Table 48 Asia-Pacific Market Size, By Shape, 2014-2022 (USD Million)
Table 49 Asia-Pacific Market Size, By Type, 2014-2022 (USD Million)
Table 50 Asia-Pacific Market Size, By Platform, 2014-2022 (USD Million)
Table 51 Asia-Pacific Market Size, End User, 2014-2022 (USD Million)
Table 52 Russia Market Size, By End User, 2014-2022 (USD Million)
Table 53 Japan Market Size, By End User, 2014-2022 (USD Million)
Table 54 China Market Size, By End User, 2014-2022 (USD Million)
Table 55 Rest of APAC Market Size, By End User, 2014-2022 (USD Million)
Table 56 Rest of the World Market Size, By Region, 2014-2022 (USD Million)
Table 57 Rest of the World Market Size, By Application, 2014-2022 (USD Million)
Table 58 Rest of the World Market Size, By Shape, 2014-2022 (USD Million)
Table 59 Rest of the World Market Size, By Type, 2014-2022 (USD Million)
Table 60 Rest of the World Market Size, By Platform, 2014-2022 (USD Million)
Table 61 Rest of the World Market Size, By End User, 2014-2022 (USD Million)
Table 62 Latin America Market Size, By End User, 2014-2022 (USD Million)
Table 63 Middle East Market Size, By End User, 2014-2022 (USD Million)
Table 64 Africa Market Size, By End User, 2014-2022 (USD Million)
Table 65 Top Five Mergers & Acquisitions in Aviation Connectors Market
Table 66 New Product Launches, 2013-2017
Table 67 Partnerships, Agreements, and Acquisitions, 2013-2017
Table 68 Events, Awards, and Certifications, 2013-2017
List of Figures (59 Figures)
Figure 1 Research Process Flow
Figure 2 Aviation Connector Market: Research Design
Figure 3 Bottom-Up Approach
Figure 4 Top-Down Approach
Figure 5 Data Triangulation
Figure 6 Assumptions of the Research Study
Figure 7 Aviation Connector Market, By Shape, 2016 & 2022 (USD Billion)
Figure 8 Aviation Connector Market, By Type, 2016 & 2022 (USD Billion)
Figure 9 Aviation Connector Market, By Application, 2016 & 2022 (USD Billion)
Figure 10 Aviation Connector Market, By End User, 2016 & 2022 (USD Billion)
Figure 11 Aviation Connector Market, By Platform, 2016 & 2022 (USD Billion)
Figure 12 Aviation Connector Market in Asia-Pacific Region is Projected to Grow at the Highest CAGR During the Forecast Period
Figure 13 New Product Launches Was the Key Growth Strategy Adopted By the Major Players in the Aviation Connector Market Between 2013 and 2017
Figure 14 Increase in Aircraft Deliveries is Expected to Drive the Aviation Connector Market During the Forecast Period
Figure 15 North America Accounted for the Largest Share of the Aviation Connector Market in 2016
Figure 16 Commercial Segment Led the Aviation Connector Market in 2016
Figure 17 Avionics Application Segment Led the Aviation Connector Market in 2016
Figure 18 Aviation Connector Market, By Type, 2016 & 2022 (USD Million)
Figure 19 The Circular Segment is Projected to Lead the Aviation Connector Market During the Forecast Period
Figure 20 The Fixed Wing Segment is Projected to Grow at the Highest CAGR During Forecast Period
Figure 21 Aviation Connector Market Segmentation
Figure 22 Aviation Connector Market Segmentation: By Shape
Figure 23 Aviation Connector Market: By Type
Figure 24 Aviation Connector Market: Market Dynamics
Figure 25 Aircraft Deliveries Between 2005 and 2015
Figure 26 Order Backlogs of Aircraft Manufacturers (Airbus & Boeing)
Figure 27 Technological Advancements
Figure 28 Aviation Connector Market, By End User, 2016 & 2022 (USD Million)
Figure 29 Fiber Optic Segment is Projected to Grow at the Highest CAGR During the Forecast Period
Figure 30 Circular Segment is Estimated to Grow at the Highest CAGR During the Forecast Period
Figure 31 Cabin Equipment Segment is Projected to Grow at the Highest CAGR During the Forecast Period
Figure 32 Aviation Connector Market, By Platform, 2016 & 2022 (USD Million)
Figure 33 Geographic Snapshot: Aviation Connector Market, 2016 & 2022
Figure 34 North America Aviation Connector Market Snapshot
Figure 35 Europe Aviation Connector Market Snapshot
Figure 36 Asia-Pacific Aviation Connector Market Snapshot
Figure 37 Companies Adopted New Product Launches as the Key Growth Strategy Between 2013 and 2017
Figure 38 Market Shares of Top Players in the Aviation Connector Market, 2016
Figure 39 Key Players in the Aviation Connector Market, By Region
Figure 40 New Product Launches, Partnerships, Acquisitions, and Agreements, and Others Were the Key Growth Strategies Adopted By Companies Between 2013 and 2017
Figure 41 Regional Revenue Mix of Top 5 Market Players
Figure 42 Amphenol Corporation: Company Snapshot
Figure 43 SWOT Analysis: Amphenol Corporation
Figure 44 TE Connectivity: Company Snapshot
Figure 45 SWOT Analysis: TE Connectivity
Figure 46 Carlisle Companies Inc.: Company Snapshot
Figure 47 SWOT Analysis: Carlisle Companies Inc.
Figure 48 Esterline Corporation: Company Snapshot
Figure 49 SWOT Analysis: Esterline Corporation
Figure 50 Bel Fuse Inc.: Company Snapshot
Figure 51 SWOT Analysis: Bel Fuse Inc.
Figure 52 Eaton Corporation: Company Snapshot
Figure 53 SWOT Analysis: Eaton Corporation
Figure 54 ITT Corporation: Company Snapshot
Figure 55 SWOT Analysis: ITT Corporation
Figure 56 Smiths Group PLC: Company Snapshot
Figure 57 SWOT Analysis: Smiths Group PLC
Figure 58 Radiall: Company Snapshot
Figure 59 SWOT Analysis: Radiall
Research Methodology:
The research methodology used to estimate and forecast the aviation connectors market begins with obtaining data on key aviation connectors equipment statistics through secondary sources such as government sources and organizations, for instance, Airports Council International, Market outlook (Boeing, Airbus and Bombardier), International Air Transport Association, Civil Aviation Authority, World Bank database, corporate filings, for instance, annual reports, investor presentations, and financial statements, and trade, business, and professional associations, among others. The bottom-up approach has been employed to arrive at the overall size of the aviation connectors market from the revenues of the key players and their shares in the market. After arriving at the overall market size, the total market was split into several segments and subsegments, which were then verified through primary research by conducting extensive interviews with market experts such as CEOs, VPs, directors, and executives. These data triangulation and market breakdown procedures were employed to complete the aviation connectors market engineering process, and arrive at the exact statistics for all the segments and the subsegments. The breakdown of profiles of primaries is depicted in the below figure:
To know about the assumptions considered for the study, download the pdf brochure
The aviation connectors market comprises product developers and manufacturers such as TE Connectivity (Switzerland), Carlisle Companies Inc. (U.S.), Eaton Corporation (Ireland), Esterline Corporation (U.S.), and Bel Fuse Inc. (U.S.), among others. These companies offer advanced technological systems, products, and services.
Target Audience
- Aviation Connectors Manufacturers
- Aviation Connectors Wholesalers, Retailers, and Distributors
- Aircraft Manufacturers
- Subcomponent Manufacturers
- Raw Material Suppliers
- Airline Operators
- Regulatory Bodies
“This study answers several questions for the stakeholders, primarily which market segments they should focus on during the next two to five years to prioritize their efforts and investments”.
Scope of the Report
This research report categorizes the aviation connectors market into the following segments and subsegments:
-
By End User
- Commercial
- Business Jets
- Military
- Others
-
By Shape
- Circular
- Rectangular
-
By Application
- Landing Gear
- Avionics
- Cabin Equipment
- Engine Control Systems
- Others
-
By Type
- PCB
- Fiber Optic
- High Power
- High Speed
- RF Connectors
- Others
-
By Platform
- Fixed Wing
- Rotary Wing
-
By Region
- North America
- Europe
- Asia-Pacific
- Rest of the World
Available Customizations:
Along with market data, MarketsandMarkets offers customizations as per the specific needs of a company. The following customization options are available for the report:
-
Market Segment by Platform
- By Subsegment
-
Market Segment by Application
- Country-wise break-up


Growth opportunities and latent adjacency in Aviation Connectors Market
We are looking for the country-wise aircraft in the category of 2-10 and 10-20 seat capacity. For this capacity aircraft, classification by engine type—Piston, Turboprop, Turbofan, and Jet is required. We would also be interested to know aircraft manufacturers and price of the aircraft. Thanks & Best Regards
I would like to know the distribution market value for connectors and electromechanical products in Europe for aerospace and defense.