Battery Market for IoT by Type, Rechargeability, End-use Application, and Geography - Global Growth Driver and Industry Forecast to 2036


Battery Market for IoT Market Summary
The Battery Market for IoT was valued at approximately USD 12.5–14.0 billion in 2024 and is projected to reach USD 38.0–42.0 billion by 2036, growing at a CAGR of 10–12% during the forecast period (2025–2036). The market is experiencing robust expansion as the proliferation of connected devices accelerates across industries such as smart homes, healthcare, industrial automation, and smart cities. The growth of the Battery Market for IoT is primarily driven by the exponential rise in IoT deployments, increasing demand for long-lasting and energy-efficient power solutions, and advancements in low-power electronics. Additionally, the integration of artificial intelligence (AI), Internet of Things (IoT), and automation technologies is enabling smarter battery management systems, predictive maintenance, and enhanced energy optimization. As digital transformation continues to reshape industries, the Battery Market for IoT is becoming a critical enabler of seamless connectivity and device reliability.
Key Market Trends & Insights
The Battery Market for IoT is led by North America, supported by advanced technological infrastructure and early adoption of IoT solutions across industries. Asia Pacific is emerging as the fastest-growing region due to rapid industrialization, increasing smart city initiatives, and large-scale electronics manufacturing. Lithium-ion batteries dominate the market owing to their high energy density, long lifecycle, and declining costs. A key trend shaping the Battery Market for IoT is the development of ultra-low-power batteries designed for extended device lifespans in remote and hard-to-access environments. AI-powered battery management systems are enhancing efficiency by optimizing energy consumption and predicting failures. IoT integration is enabling real-time monitoring of battery performance, while automation is improving manufacturing processes and scalability. Additionally, innovations in solid-state batteries and energy harvesting technologies are opening new growth avenues.
Market Size & Forecast
- Base Year Market Size (2024): USD 12.5–14.0 Billion
- Forecast Market Size (2036): USD 38.0–42.0 Billion
- CAGR (2025–2036): 10–12%
- Growth Factors: Rapid IoT adoption, demand for long-lasting batteries, advancements in AI-driven battery management, and increasing smart device penetration
To know about the assumptions considered for the study, Request for Free Sample Report
Battery Market for IoT Market Top 10 key takeaway
- The Battery Market for IoT is expected to triple in size by 2036.
- North America leads due to strong IoT ecosystem and innovation.
- Asia Pacific is the fastest-growing region driven by manufacturing and smart city projects.
- Lithium-ion batteries dominate due to superior performance characteristics.
- AI integration enhances battery efficiency and predictive maintenance.
- IoT-enabled monitoring improves battery lifecycle management.
- Automation boosts production efficiency and reduces costs.
- Emerging technologies like solid-state batteries are gaining traction.
- Industrial IoT is a major contributor to market demand.
- Energy efficiency and sustainability are key focus areas.
Product Insights
The Battery Market for IoT is primarily segmented into lithium-ion, lithium polymer, nickel metal hydride, and emerging solid-state batteries. Among these, lithium-ion batteries hold the largest market share due to their high energy density, lightweight design, and long cycle life, making them ideal for a wide range of IoT devices. Their ability to support compact and portable devices has made them the preferred choice in applications such as wearables, smart sensors, and connected devices.
Lithium polymer batteries are also gaining traction due to their flexible form factor and enhanced safety features, particularly in consumer electronics and healthcare devices. Meanwhile, solid-state batteries represent an emerging category with significant growth potential, offering improved energy density, safety, and longevity compared to traditional battery technologies.
AI integration is playing a transformative role in product innovation within the Battery Market for IoT. Smart batteries equipped with AI-driven management systems can optimize charging cycles, monitor usage patterns, and predict potential failures. These capabilities not only extend battery life but also enhance device performance and reliability. As IoT devices continue to evolve, the demand for advanced battery solutions with integrated intelligence is expected to rise significantly.
Technology / Component Insights
The Battery Market for IoT is driven by a combination of advanced technologies, including battery management systems (BMS), energy harvesting solutions, and low-power communication technologies. Battery management systems are critical components that ensure optimal performance, safety, and longevity of batteries by monitoring parameters such as voltage, temperature, and state of charge.
Artificial intelligence is revolutionizing the Battery Market for IoT by enabling predictive analytics, real-time monitoring, and adaptive energy management. AI algorithms can analyze vast amounts of data generated by IoT devices to optimize battery usage and prevent failures. IoT connectivity further enhances these capabilities by enabling continuous data exchange between devices and cloud platforms.
Cloud computing plays a vital role in storing and analyzing battery performance data, while automation technologies are improving manufacturing processes and reducing production costs. Energy harvesting technologies, such as solar and kinetic energy, are also gaining popularity as they reduce reliance on traditional batteries and enable self-powered IoT devices.
Future innovation trends in the Battery Market for IoT include the development of ultra-low-power chips, integration of edge AI for localized processing, and advancements in nanotechnology to improve battery efficiency and durability. These innovations are expected to drive the next phase of growth in the market.
Application Insights
The Battery Market for IoT serves a wide range of applications, with industrial IoT (IIoT) emerging as the leading segment. Industrial applications require reliable and long-lasting batteries to power sensors, monitoring systems, and automation equipment. The need for predictive maintenance and real-time monitoring is driving the adoption of advanced battery solutions in this sector.
Consumer electronics is another major application area, including smart home devices, wearables, and connected appliances. The increasing demand for portable and energy-efficient devices is fueling the growth of the Battery Market for IoT in this segment. Healthcare applications are also expanding, with IoT-enabled medical devices requiring reliable power sources for continuous monitoring and diagnostics.
Smart cities represent a significant growth opportunity, with IoT devices being deployed for traffic management, energy optimization, and public safety. Agriculture, logistics, and environmental monitoring are additional application areas where the Battery Market for IoT is gaining traction. As IoT adoption continues to expand, the demand for efficient and durable battery solutions is expected to increase.
Regional Insights
North America dominates the Battery Market for IoT, driven by strong technological infrastructure, high adoption of IoT solutions, and significant investments in research and development. The presence of major technology companies and a well-established ecosystem for innovation further supports market growth in the region. Europe follows with steady growth, supported by stringent regulations on energy efficiency and sustainability, as well as increasing adoption of smart technologies.
Asia Pacific is the fastest-growing region in the Battery Market for IoT, fueled by rapid industrialization, expanding electronics manufacturing, and large-scale smart city initiatives. Countries such as China, Japan, and South Korea are leading contributors to market growth in this region. The increasing focus on digital transformation and infrastructure development is further driving demand for IoT battery solutions.
- North America leads due to advanced IoT ecosystem and R&D investments
- Europe benefits from sustainability regulations and smart technology adoption
- Asia Pacific shows highest growth due to industrial expansion and manufacturing
- Government initiatives support smart city and IoT development
- Rising demand for connected devices drives regional growth
Country-Specific Market Trends
In Asia Pacific, China dominates the Battery Market for IoT with a CAGR of 11–13%, driven by large-scale manufacturing, government support for smart cities, and rapid adoption of IoT technologies. Japan follows with a CAGR of 9–10%, focusing on advanced battery technologies and innovation. In North America, the United States leads with a CAGR of 10–11%, supported by strong demand for IoT devices and technological advancements, while Canada and Mexico are experiencing steady growth due to increasing industrial adoption.
In Europe, Germany and France are key markets, with CAGRs of 9–10% and 8–9% respectively, driven by industrial automation and sustainability initiatives. Governments across these regions are promoting energy-efficient technologies and supporting the development of advanced battery solutions, further driving the growth of the Battery Market for IoT.
- China leads with strong manufacturing and smart city initiatives
- Japan emphasizes innovation in advanced battery technologies
- United States drives demand through IoT adoption and R&D
- Germany focuses on industrial automation and energy efficiency
- France supports growth through sustainability initiatives
Key Battery Market for IoT Company Insights
The Battery Market for IoT is highly competitive, with key players focusing on innovation, strategic partnerships, and expansion of product portfolios. Major companies include Panasonic Corporation, Samsung SDI Co., Ltd., LG Energy Solution, Toshiba Corporation, Murata Manufacturing Co., Ltd., Duracell Inc., Energizer Holdings, Inc., Saft Groupe S.A., and VARTA AG.
These companies are investing heavily in research and development to enhance battery performance, improve energy efficiency, and integrate AI-driven battery management systems. AI adoption is enabling smarter and more efficient battery solutions, while IoT integration is enhancing real-time monitoring and predictive maintenance capabilities. Product strategies are focused on developing compact, lightweight, and high-performance batteries tailored for IoT applications.
Strategic collaborations and partnerships are also playing a key role in market growth, enabling companies to leverage complementary technologies and expand their market presence. As competition intensifies, companies are focusing on innovation and differentiation to gain a competitive edge in the Battery Market for IoT.
- Companies are investing in AI-enabled battery management systems
- Focus on high-performance and energy-efficient solutions is increasing
- Strategic partnerships drive innovation and market expansion
- Product development emphasizes compact and lightweight designs
- R&D investments enhance battery longevity and reliability
Recent Developments
In 2025, a leading battery manufacturer introduced an AI-powered battery management system designed specifically for IoT devices, enabling real-time monitoring and predictive maintenance. Another notable development includes a partnership between a technology company and an energy solutions provider to develop next-generation solid-state batteries for IoT applications. Additionally, advancements in energy harvesting technologies are enabling self-powered IoT devices, reducing dependence on traditional batteries and enhancing sustainability.
Market Segmentation
The Battery Market for IoT is segmented based on product, technology/component, application, and region. By product, the market includes lithium-ion, lithium polymer, nickel metal hydride, and solid-state batteries, with lithium-ion dominating due to its superior performance characteristics. In terms of technology, the market encompasses battery management systems, AI, IoT connectivity, and energy harvesting solutions, which collectively enhance battery efficiency and reliability.
Applications of the Battery Market for IoT span industrial IoT, consumer electronics, healthcare, smart cities, agriculture, and logistics, reflecting the widespread adoption of IoT technologies. Regionally, the market is divided into North America, Europe, Asia Pacific, and the rest of the world, each exhibiting unique growth dynamics driven by technological adoption and industrial development.
- Product segmentation includes lithium-ion, polymer, and solid-state batteries
- Technology segmentation highlights AI, IoT, and energy management systems
- Applications cover industrial, consumer, healthcare, and smart city sectors
- Regional segmentation reflects diverse growth patterns
- Advanced technologies drive market expansion
Conclusion
The Battery Market for IoT is set for significant growth through 2036, driven by the rapid expansion of connected devices and the increasing need for efficient and reliable power solutions. The integration of AI, IoT, and automation technologies is transforming battery systems into intelligent energy solutions capable of optimizing performance and predicting failures. As industries continue to embrace digital transformation, the importance of advanced battery technologies will only increase.
With strong growth potential and ongoing innovation, the Battery Market for IoT presents substantial opportunities for businesses to enhance their competitive position and drive long-term value. Companies that invest in advanced technologies and sustainable solutions will be well-positioned to capitalize on the evolving market landscape.
FAQs
What is the current size of the Battery Market for IoT?
The market was valued at approximately USD 12.5–14.0 billion in 2024.
What is the expected growth rate of the Battery Market for IoT?
The market is expected to grow at a CAGR of 10–12% from 2025 to 2036.
What are the key drivers of the Battery Market for IoT?
Key drivers include rapid IoT adoption, demand for long-lasting batteries, and advancements in AI and energy management technologies.
Which region leads the Battery Market for IoT?
North America currently holds the largest market share.
Who are the key players in the Battery Market for IoT?
Major companies include Panasonic, Samsung SDI, LG Energy Solution, Toshiba, and Duracell.
-
To speak to our analyst for a discussion on the above findings, click Speak to Analyst
 Exclusive indicates content/data unique to MarketsandMarkets and not available with any competitors.
TABLE OF CONTENTS
1 INTRODUCTION
1.1 STUDY OBJECTIVES
1.2 MARKET DEFINITION
1.3 MARKET SCOPE
1.3.1 MARKETS COVERED
1.3.2 YEARS CONSIDERED
1.4 CURRENCY
1.5 LIMITATIONS
1.6 STAKEHOLDERS
2 RESEARCH METHODOLOGY
2.1 RESEARCH DATA
2.1.1 SECONDARY DATA
2.1.1.1 Secondary Sources
2.1.2 PRIMARY DATA
2.1.2.1 Primary Sources
2.2 MARKET SIZE ESTIMATION
2.2.1 BOTTOM-UP
2.2.2 TOP-DOWN
2.3 DATA TRIANGULATION
2.4 RESEARCH ASSUMPTIONS
3 EXECUTIVE SUMMARY
4 PREMIUM INSIGHTS
5 INTERNET OF THINGS MARKET - START-UP SCENARIO
5.1 START-UP COMPANY ANALYSIS BY
5.1.1 GLOBAL FOOTPRINT
5.1.2 REVENUE
5.1.3 MARKET RANKING/SHARE INTERVAL
5.1.4 VENTURE CAPITAL AND FUNDING SCENARIO
6 MARKET OVERVIEW AND INDUSTRY TRENDS
6.1 INTRODUCTION
6.2 MARKET DYNAMICS
6.2.1 DRIVERS
6.2.2 RESTRAINTS
6.2.3 OPPORTUNITIES
6.2.4 CHALLENGES
6.3 USE CASES
6.3.1 SMART RETAIL
6.3.2 CONNECTED HEALTH
6.3.3 BUILDING AND HOME AUTOMATION
6.3.4 SMART LOGISTICS
6.3.5 SMART MOBILITY AND TRANSPORTATION
6.3.6 SMART GRID AND UTILITIES
6.3.7 SMART MANUFACTURING
6.3.8 SMART HOME
6.3.9 OTHERS
6.4 REGULATORY FRAMEWORK (FOR IOT BATTERY)
6.4.1 GENERAL
6.4.2 PRESENT STATUS
6.4.3 STANDARDIZATION NEEDS AND OUTLOOK
6.4.4 CHALLENGES AND FUTURE STANDARDIZATION NEEDS
6.5 IMPACT OF OTHER DISRUPTIVE TECHNOLOGIES
6.5.1 ARTIFICIAL INTELLIGENCE (AI)
6.5.2 5G
6.5.3 SMART TRANSPORTATION
6.5.4 SMART ENERGY
6.6 IOT CHARACTERISTICS
6.7 VALUE CHAIN ANALYSIS
6.8 PRICE TRENDS ANALYSIS
6.9 TRENDS IN BATTERY-LESS IOT TECHNOLOGY
6.9.1 AMBIENT ENERGY HARVESTING
6.9.1.1 Piezoelectric
6.9.1.2 Thermoelectric (PV)
6.9.1.3 Kinetic
6.9.1.4 Photoelectric
6.9.2 BATTERY-FREE BLUETOOTH TAGS
6.1 EMERGING BATTERY TECHNOLOGY: ZINC-AIR BATTERIES
6.11 IMPACT OF COVID-19 ON BATTERY MARKET FOR IOT
7 BATTERY MARKET FOR IOT, BY TYPE (USD MILLION AND MILLION UNITS)
7.1 INTRODUCTION
7.2 CHEMICAL BATTERIES
7.2.1 LITHIUM BATTERIES
7.2.2 ALKALINE BATTERIES
7.2.3 OTHERS
7.3 THIN-FILM BATTERIES
7.4 PRINTED BATTERIES
7.5 SOLID-STATE CHIP BATTERIES
8 BATTERY MARKET FOR IOT, BY RECHARGEABILITY (USD MILLION)
8.1 PRIMARY BATTERIES
8.2 SECONDARY BATTERIES
9 BATTERY MARKET FOR IOT, BY END-USE APPLICATION (USD MILLION AND MILLION UNITS)
9.1 WEARABLE DEVICES
9.1.1 ACTIVITY MONITORS
9.1.2 SMART WATCHES
9.1.3 SMART GLASSES
9.1.4 BODY-WORN CAMERAS
9.1.5 HEARABLES
9.2 CONSUMER ELECTRONICS
9.3 HEALTHCARE
9.3.1 FITNESS AND HEART RATE MONITORS
9.3.2 BLOOD PRESSURE MONITORS
9.3.3 BLOOD GLUCOSE METERS
9.3.4 FALL DETECTORS
9.3.5 OTHERS
9.4 HOME AUTOMATION
9.4.1 SMART LOCKS
9.4.2 SECURITY CAMERAS
9.4.3 SMART METERS
9.4.4 WIRELESS ALARMS AND THEFT DETECTION SYSTEMS
9.4.5 OCCUPANCY SENSORS
9.4.6 SMOKE DETECTORS
9.4.7 GARAGE DOOR SENSORS
9.4.8 WINDOW SENSORS
9.4.9 WATER LEAK DETECTION SENSORS
9.5 RETAIL
9.5.1 CONTACTLESS POINT OF SALES (POS)
9.5.2 WIRELESS BEACONS
9.5.3 SMART TAGS
9.6 BFSI
9.6.1 MOBILE POINT OF SALES (MPOS)
9.7 AEROSPACE AND DEFENSE
9.7.1 SMART BEACONS
9.7.2 DRONES/ UNMANNED AERIAL VEHICLES (UAV)
9.7.3 SMART BAGGAGE TAGS
9.8 INDUSTRIAL
9.9 AGRICULTURE
9.9.1 AGRICULTURE DRONES
9.9.2 AGRICULTURE ROBOTS
9.9.3 SOIL MOISTURE SENSORS
9.9.4 LIVE STOCK RFID TAGS
9.10 SMART PACKAGING
10 BATTERY MARKET FOR IOT, BY GEOGRAPHY (USD MILLION)
10.1 INTRODUCTION
10.2 NORTH AMERICA
10.2.1 US
10.2.2 CANADA
10.3 EUROPE
10.3.1 UK
10.3.2 GERMANY
10.3.3 FRANCE
10.3.4 REST OF EUROPE
10.4 ASIA PACIFIC
10.4.1 CHINA
10.4.2 JAPAN
10.4.3 SOUTH KOREA
10.4.4 INDIA
10.4.5 REST OF APAC
10.5 REST OF THE WORLD
10.5.1 MIDDLE EAST & AFRICA (MEA)
10.5.2 LATIN AMERICA
11 COMPETITIVE LANDSCAPE
11.1 OVERVIEW
11.2 KEY PLAYERS IN BATTERY MARKET FOR IOT
11.3 COMPETITIVE BENCHMARKING AND LANDSCAPE
11.3.1 NEW PRODUCT LAUNCHED AND DEVELOPMENTS
11.3.2 PARTNERSHIPS, COLLABORATIONS, AGREEMENTS, AND ACQUISITIONS
11.4 COMPETITIVE LEADERSHIP MAPPING
11.4.1 VISIONARY LEADERS
11.4.2 INNOVATORS
11.4.3 DYNAMIC DIFFERENTIATORS
11.4.4 EMERGING COMPANIES
12 COMPANY PROFILES
12.1 KEY PLAYERS
(Business Overview, Products Offered, Recent Developments, SWOT Analysis, and MnM View)*
12.1.1 DURACELL
12.1.2 ENERGIZER
12.1.3 PANASONIC
12.1.4 LG CHEM
12.1.5 SAMSUNG SDI
12.1.6 STMICROELECTRONICS
12.1.7 CYMBET
12.1.8 ULTRALIFE
12.1.9 IMPRINT ENERGY
12.1.10 ILIKA
12.1.11 BLUE SPARK TECHNOLOGIES
12.1.12 ENFUCELL
12.1.13 BRIGHTVOLT
12.1.14 SAFT
12.1.15 POWER PAPER
12.1.16 JENAX
12.2 RIGHT TO WIN
12.3 OTHER KEY PLAYERS
12.3.1 FRONT EDGE TECHNOLOGY
12.3.2 ROCKET ELECTRIC
12.3.3 GUANGZHOU FULLRIVER BATTERY NEW TECHNOLOGY
12.3.4 ITEN
*Details on Business Overview, Products Offered, Recent Developments, SWOT Analysis, and MnM View might not be captured in case of unlisted companies.
13 APPENDIX
13.1 KNOWLEDGE STORE
13.2 RELATED REPORTS
LIST OF TABLES (62 TABLES)
TABLE 1 BATTERY MARKET FOR IOT, BY TYPE, 2018–2025, (USD MILLION)
TABLE 2 MARKET FOR IOT, BY TYPE, 2018–2025, (MILLION UNITS)
TABLE 3 MARKET FOR IOT, BY RECHARGEABILITY, 2018–2025, (USD MILLION)
TABLE 4 MARKET FOR IOT, BY END-USE APPLICATION, 2018–2025, (USD MILLION)
TABLE 5 MARKET FOR IOT, BY END-USE APPLICATION, 2018–2025, (MILLION UNITS)
TABLE 6 MARKET FOR IOT IN WEARABLE DEVICES, BY DEVICE TYPE, 2018–2025, (MILLION UNITS)
TABLE 7 MARKET FOR IOT IN WEARABLE DEVICES, BY DEVICE TYPE, 2018–2025 (USD MILLION)
TABLE 8 MARKET FOR IOT IN WEARABLE DEVICES, BY BATTERY TYPE, 2018–2025 (MILLION UNITS)
TABLE 9 MARKET FOR IOT IN WEARABLE DEVICES, BY BATTERY TYPE, 2018–2025 (USD MILLION)
TABLE 10 MARKET FOR IOT FOR WEARABLE DEVICES, BY RECHARGEABILITY, 2018–2025, (USD MILLION)
TABLE 11 BATTERY MARKET FOR IOT FOR WEARABLE DEVICES, BY REGION, 2018–2025, (USD MILLION)
TABLE 12 MARKET FOR IOT FOR CONSUMER ELECTRONICS, BY REGION, 2018–2025, (USD THOUSAND)
TABLE 13 MARKET FOR CONSUMER ELECTRONICS, BY TYPE, 2018–2025 (THOUSAND UNITS)
TABLE 14 MARKET FOR CONSUMER ELECTRONICS, BY TYPE, 2018–2025 (USD THOUSAND)
TABLE 15 MARKET FOR IOT FOR CONSUMER ELECTRONICS, BY RECHARGEABILITY, 2018–2025, (USD THOUSAND)
TABLE 16 MARKET FOR IOT IN HEALTHCARE, BY DEVICE TYPE, 2018–2025, (MILLION UNITS)
TABLE 17 MARKET FOR IOT IN HEALTHCARE, BY DEVICE TYPE, 2018–2025, (USD MILLION)
TABLE 18 MARKET FOR IOT IN HEALTHCARE, BY BATTERY TYPE, 2018–2025, (MILLION UNITS)
TABLE 19 MARKET FOR IOT IN HEALTHCARE, BY BATTERY TYPE, 2018–2025, (USD MILLION)
TABLE 20 MARKET FOR IOT IN HEALTHCARE, BY RECHARGEABILITY, 2018–2025, (USD MILLION)
TABLE 21 MARKET FOR IOT FOR HEALTHCARE, BY REGION, 2018–2025, (USD MILLION)
TABLE 22 MARKET FOR IOT IN HOME AUTOMATION, BY DEVICE TYPE, 2018–2025, (MILLION UNITS)
TABLE 23 BATTERY MARKET FOR IOT IN HOME AUTOMATION, BY DEVICE TYPE, 2018–2025, (USD MILLION)
TABLE 24 MARKET FOR IOT IN HOME AUTOMATION, BY BATTERY TYPE, 2018–2025, (USD MILLION)
TABLE 25 MARKET FOR IOT IN HOME AUTOMATION, BY RECHARGEABILITY, 2018–2025, (USD MILLION)
TABLE 26 MARKET FOR IOT IN HOME AUTOMATION, BY BATTERY TYPE, 2018–2025, (MILLION UNITS)
TABLE 27 MARKET FOR IOT FOR HOME AUTOMATION, BY REGION, 2018–2025, (USD MILLION)
TABLE 28 MARKET FOR IOT IN RETAIL, BY DEVICE TYPE, 2018–2025, (MILLION UNITS)
TABLE 29 MARKET FOR IOT IN RETAIL, BY DEVICE TYPE, 2018–2025, (USD MILLION)
TABLE 30 MARKET FOR IOT IN RETAIL, BY BATTERY TYPE, 2018–2025, (MILLION UNITS)
TABLE 31 MARKET FOR IOT IN RETAIL, BY BATTERY TYPE, 2018–2025, (USD MILLION)
TABLE 32 MARKET FOR IOT IN HOME AUTOMATION, BY RECHARGEABILITY, 2018–2025, (USD MILLION)
TABLE 33 MARKET FOR IOT FOR RETAIL, BY REGION, 2018–2025, (USD MILLION)
TABLE 34 MARKET FOR IOT IN BFSI, BY DEVICE TYPE, 2018–2025
TABLE 35 BATTERY MARKET FOR IOT FOR BFSI, BY REGION, 2018–2025, (USD MILLION)
TABLE 36 MARKET FOR IOT IN BFSI, BY BATTERY TYPE, 2018–2025
TABLE 37 MARKET FOR IOT IN AEROSPACE AND DEFENSE, BY DEVICE TYPE, 2018–2025, (MILLION UNITS)
TABLE 38 MARKET FOR IOT IN AEROSPACE AND DEFENSE, BY DEVICE TYPE, 2018–2025, (USD MILLION)
TABLE 39 MARKET FOR IOT IN AEROSPACE AND DEFENSE, BY BATTERY TYPE, 2018–2025, (MILLION UNITS)
TABLE 40 MARKET FOR IOT IN AEROSPACE & DEFENSE, BY BATTERY TYPE, 2018–2025
TABLE 41 MARKET FOR IOT IN AEROSPACE & DEFENSE, BY RECHARGEABILITY, 2018–2025
TABLE 42 BATTERY MARKET FOR IOT FOR AEROSPACE AND DEFENSE, BY REGION, 2018–2025, (USD MILLION)
TABLE 43 MARKET FOR IOT IN INDUSTRIAL, BY DEVICE TYPE, 2018–2025
TABLE 44 MARKET FOR IOT FOR INDUSTRIAL, BY REGION, 2018–2025, (USD MILLION)
TABLE 45 MARKET FOR IOT IN INDUSTRIAL, BY BATTERY TYPE, 2018–2025
TABLE 46 MARKET FOR IOT IN AGRICULTURE, BY DEVICE TYPE, 2018–2025, (MILLION UNITS)
TABLE 47 MARKET FOR IOT IN AGRICULTURE, BY DEVICE TYPE, 2018–2025, (USD MILLION)
TABLE 48 MARKET FOR IOT IN AGRICULTURE, BY BATTERY TYPE, 2018–2025, (MILLION UNITS)
TABLE 49 MARKET FOR IOT FOR AGRICULTURE, BY REGION, 2018–2025, (USD MILLION)
TABLE 50 BATTERY MARKET FOR IOT IN AGRICULTURE, BY BATTERY TYPE, 2018–2025
TABLE 51 MARKET FOR IOT IN AGRICULTURE, BY RECHARGEABILITY, 2018–2025
TABLE 52 BATTERY MARKET FOR SMART PACKAGING, BY TYPE, 2018–2025 (MILLION UNITS)
TABLE 53 BATTERY MARKET FOR SMART PACKAGING, BY TYPE, 2018–2025 (USD MILLION)
TABLE 54 MARKET FOR IOT FOR SMART PACKAGING, BY REGION, 2018–2025, (USD MILLION)
TABLE 55 MARKET FOR IOT IN SMART PACKAGING, BY RECHARGEABILITY, 2018–2025
TABLE 56 BATTERY MARKET FOR IOT, BY REGION, 2018–2025, (USD MILLION)
TABLE 57 MARKET OF IOT IN NORTH AMERICA, BY COUNTRY, 2018–2025, (USD MILLION)
TABLE 58 MARKET OF IOT IN EUROPE, BY COUNTRY, 2018–2025, (USD MILLION)
TABLE 59 MARKET OF IOT IN APAC, BY COUNTRY, 2018–2025, (USD MILLION)
TABLE 60 MARKET OF IOT IN ROW, BY REGION, 2018–2025, (USD MILLION)
TABLE 61 NEW PRODUCT LAUNCHES AND DEVELOPMENTS
TABLE 62 PARTNERSHIPS, COLLABORATIONS, AGREEMENTS, AND ACQUISITIONS
LIST OF FIGURES (41 FIGURES)
FIGURE 1 BATTERY MARKET FOR IOT - SEGMENTATION
FIGURE 2 BATTERY MARKET FOR IOT: RESEARCH DESIGN
FIGURE 3 SECONDARY SOURCES
FIGURE 4 PRIMARY SOURCES
FIGURE 5 BATTERY MARKET FOR IOT: RESEARCH DESIGN
FIGURE 6 BOTTOM-UP APPROACH
FIGURE 7 TOP-DOWN APPROACH
FIGURE 8 DATA TRIANGULATION
FIGURE 9 BATTERY MARKET FOR IOT: RESEARCH DESIGN
FIGURE 10 MICRO-BATTERY SEGMENT TO GROW AT HIGHEST CAGR FROM 2020 TO 2025
FIGURE 11 MARKET FOR IOT IN APAC TO GROW AT HIGHEST CAGR FROM 2020 TO 2025
FIGURE 12 RISING NEED FOR THIN AND FLEXIBLE BATTERIES IN IOT AND MEDICAL DEVICES DRIVE MARKET GROWTH
FIGURE 13 SECONDARY BATTERY SEGMENT TO CONTINUE TO ACCOUNT FOR LARGEST SIZE OF MARKET FOR IOT DURING FORECAST PERIOD
FIGURE 14 HOME AUTOMATION SEGMENT IS EXPECTED TO HOLD LARGEST SIZE OF MARKET FOR IOT, IN TERMS OF VOLUME, FROM 2020 TO 2025
FIGURE 15 BATTERY MARKET: DRIVERS, RESTRAINTS, OPPORTUNITIES, AND CHALLENGES
FIGURE 16 BATTERY MARKET FOR IOT
FIGURE 17 LITHIUM PRICE TREND
FIGURE 18 LITHIUM BATTERIES SEGMENT ACCOUNTED FOR A LARGEST SIZE OF MARKET FOR IOT FROM 2020 TO 2025
FIGURE 19 SECONDARY BATTERIES SEGMENT TO LEAD MARKET FOR IOT FROM 2020 TO 2025
FIGURE 20 MARKET FOR IOT IN AEROSPACE AND DEFENSE PROJECTED TO GROW AT THE HIGHEST CAGR FROM 2020 TO 2025
FIGURE 21 BLOOD PRESSURE MONITORS SEGMENT EXPECTED TO ACCOUNT FOR LARGEST SHARE OF MARKET (IN TERMS OF UNITS SHIPPED) IN 2020
FIGURE 22 BATTERY MARKET IN APAC IS EXPECTED TO GROW AT THE HIGHEST CAGR FROM 2020 TO 2025
FIGURE 23 NORTH AMERICA SNAPSHOT
FIGURE 24 EUROPE SNAPSHOT
FIGURE 25 APAC SNAPSHOT
FIGURE 26 COMPETITIVE LEADERSHIP MAPPING
FIGURE 27 DURACELL: COMPANY SNAPSHOT
FIGURE 28 ENERGIZER: COMPANY SNAPSHOT
FIGURE 29 PANASONIC CORPORATION: COMPANY SNAPSHOT
FIGURE 30 LG CHEM: COMPANY SNAPSHOT
FIGURE 31 SAMSUNG SDI: COMPANY SNAPSHOT
FIGURE 32 STMICROELECTRONICS: COMPANY SNAPSHOT
FIGURE 33 CYMBET: COMPANY SNAPSHOT
FIGURE 34 ULTRALIFE: COMPANY SNAPSHOT
FIGURE 35 IMPRINT ENERGY: COMPANY SNAPSHOT
FIGURE 36 ILIKA: COMPANY SNAPSHOT
FIGURE 37 BLUE SPARK TECHNOLOGIES: COMPANY SNAPSHOT
FIGURE 38 ENFUCELL: COMPANY SNAPSHOT
FIGURE 39 BRIGHTVOLT: COMPANY SNAPSHOT
FIGURE 40 SAFT: COMPANY SNAPSHOT
FIGURE 41 POWER PAPER: COMPANY SNAPSHOT
The study involved the estimation of the current size of the battery market for IoT. Exhaustive secondary research was conducted to collect information on the market, its peer markets, and its parent market. This was followed by the validation of these findings, assumptions, and sizing with the industry experts identified across the value chain through primary research. Both, top-down and bottom-up approaches were employed to estimate the overall size of the market. This was followed by market breakdown and data triangulation procedures, which were used to estimate the size of the market based on different segments and subsegments.
Secondary Research
In the secondary research process, various secondary sources were referred to for the identification and collection of relevant information for this study on the battery market for IoT. Secondary sources included annual reports, press releases, and the investor presentations of companies; white papers; journals and certified publications; and articles by recognized authors, websites, directories, and databases. Secondary research was conducted to obtain the key information regarding the supply chain and the value chain of the industry, the total pool of key players, market segmentation according to industry trends (to the bottom-most level), geographic markets, and key developments from market- and technology-oriented perspectives. Secondary data was collected and analyzed to arrive at the overall size of the battery market for IoT, which was further validated by primary research.
Primary Research
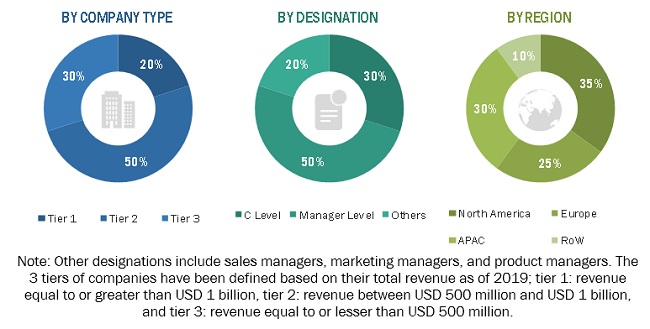
In the primary research process, various primary sources from both supply and demand sides were interviewed to obtain qualitative and quantitative information relevant to this report. Several primary interviews were conducted with the market experts from both demand (the manufacturers of batteries for IoT used in different industries) and supply sides. The primary data was collected through questionnaires, emails, and telephonic interviews. Primary sources included industry experts such as chief executive officers (CEOs), vice presidents (VPs), marketing directors, technology and innovation directors, and related executives from various key companies and organizations operating in the battery market for IoT.
To know about the assumptions considered for the study, download the pdf brochure
Market Size Estimation
Top-down and bottom-up approaches were implemented to estimate and validate the total size of the battery market for IoT. These methods were used extensively to estimate the size of the market based on various segments and subsegments. The research methodology used to estimate the market size included the following steps:
- Key players in the industry were identified through extensive secondary research.
- The industry’s supply chain was identified, and the market size, in terms of value, was determined through primary and secondary research processes.
- All percentage shares, splits, and breakdowns were determined using secondary sources and verified through primary sources.
Data Triangulation
After arriving at the overall size of the battery market for IoT—using the market size estimation processes as explained above—the market was split into several segments and subsegments. Data triangulation and market breakdown procedures were employed, wherever applicable, to complete the overall market engineering process and arrive at the exact statistics of each market segment and subsegment. The data was triangulated by studying various factors and trends from the demand and supply sides across different applications.
Study Objectives
- To describe and forecast the battery market for IoT, in terms of value and volume, based on type, rechargeability, and end-use application
- To describe and forecast the market size for 4 major regions—North America, Europe, Asia Pacific (APAC), and the Rest of the World (RoW)
- To provide detailed information regarding the major factors such as drivers, restraints, opportunities, and challenges influencing the growth of the market
- To analyze opportunities in the battery market for IoT for stakeholders and provide a detailed competitive landscape of the market for the leading players
- To strategically profile the key players operating in the market and comprehensively analyze their core competencies
- To map the competitive intelligence based on the company profiles, as well as key growth strategies adopted and game-changing developments such as product developments, collaborations, and acquisitions undertaken in the market


Growth opportunities and latent adjacency in Battery Market