Beverage Stabilizers Market by Type (Xanthan Gum, Carrageenan, Gum Arabic, and CMC), Function (Stabilization, Texturization, and Viscosification), Application (Fruit Drinks, Dairy Products, and Soft Drinks), and Region - Global Forecast to 2023


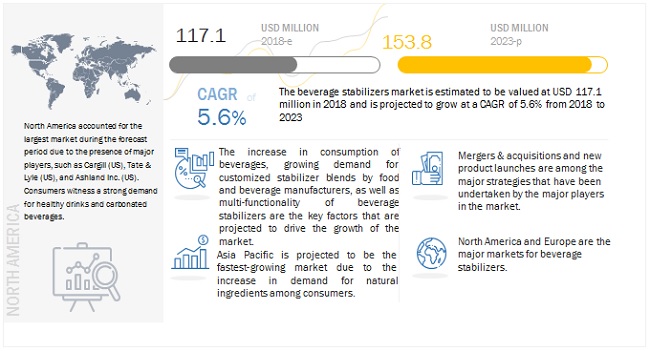
[138 Pages Report] The beverage stabilizers market is estimated to reach USD 117.1 million in 2018 and is projected to reach a value of USD 153.8 million by 2023, recording a CAGR of 5.6%. The growth of the beverage stabilizers market is attributed to the rise in demand for healthier and natural food ingredients in the food industry. Key factors encouraging the market growth include the rise in beverage consumption, the multi-functionality of beverage stabilizers, and the growth in the use of natural ingredients in foods due to the increase in consumer awareness about healthy diets.

To know about the assumptions considered for the study, Request for Free Sample Report
On the basis of application, the beverage stabilizers market is segmented into fruit drinks, dairy products, soft drinks, alcoholic beverages, and other applications, such as tea & coffee, and sports & energy drinks. The fruit drinks segment is estimated to account for the largest share in 2018. The demand for beverage stabilizers in fruit drinks is increasing due to the rise in the consumption of beverages. Beverage stabilizers are used to thicken water and add body, texture, and mouthfeel to beverages, such as juices, table syrups, particularly low-calorie syrups, and alcoholic beverages. These factors are projected to drive the growth of this segment.
The beverage stabilizers segment, by type, is segmented into xanthan gum, carrageenan, gum arabic, carboxymethyl cellulose, and others, which include pectin, guar gum, and locust bean gum. Xanthan gum accounts for the largest market due to the increase in demand for gluten-free products. Xanthum gum serves as an effective alternative to gluten through its improved binding characteristics that help drive its demand globally. Xanthan gum offers several advantages, such as texture enhancement, stabilization, shelf life extension, and water retention, due to which it is used by beverage producers for various applications.

To know about the assumptions considered for the study, download the pdf brochure
By function, the market for beverage stabilizers is segmented into stabilization, texturization, viscosification, and others, which includes emulsification, thickening, and anti-crystallization. The stabilization segment is projected to dominate the market during the forecast period. The dominance of this segment is attributed to the increase in consumption of nutritional beverages with reduced calorie levels that require beverage stabilizers & systems. The function of beverage stabilizers, such as hydrocolloids, is to stabilize the emulsion, prevent separation, and, in the case of wine and other alcoholic beverages, control ice crystal formation.
North America is projected to account for the largest market share during the forecast period. The increase in health-consciousness and attention to the ingredients in food products and medicines has led to high demand for natural food ingredients. This, in turn, has led to a change in the purchasing patterns of manufacturers in the foodservice industry.
With the recent consolidations in the beverage stabilizers industry, there has been a rise in the competition among major players in the beverage stabilizers market. This growth was primarily supplemented by the rise in population and increase in demand for food & beverage products
Key participants in the market are manufacturers, beverage stabilizers manufacturers, distributors & suppliers, associations & industry bodies, and end users.
Cargill (US), Tate & Lyle (UK), DowDuPont (US), Ashland (US), Palsgaard (Denmark), Glanbia Nutritionals (US), Kerry Group (Ireland), Advanced Food Systems (US), Chemelco International (Netherlands), and Nexira (France) are the leading players in this market.
This report is Targeted at the existing stakeholders in the industry, which include the following:
- Food & beverage suppliers and manufacturers
- Food & beverage importers and exporters
- Food & beverage traders and distributors
- Government and research organizations
- Associations and industry bodies [World Health Organization (WHO), ICBA (International Council of Beverage Associations), American Beverage Association (ABA), and Global Food & Beverage Association (GFBA)]
“The study answers several questions for stakeholders, primarily which market segments to focus on in the next two to five years for prioritizing efforts and investments.”
Scope of the report
|
Report Metric |
Details |
|
Market size available for years |
2016-2023 |
|
Base year considered |
2017 |
|
Forecast period |
2018 – 2023 |
|
Forecast units |
Value (USD Million) , Volume (KT) |
|
Segments covered |
By Type, Function, Application, and Region |
|
Geographies covered |
North America, Europe, Asia Pacific, and RoW |
|
Companies covered |
Cargill (US), Tate & Lyle (UK), DowDuPont (US), Ashland (US), Palsgaard (Denmark), Glanbia Nutritionals (US), Kerry Group (Ireland), Advanced Food Systems (US), Chemelco International (Netherlands), and Nexira (France) |
This research report categorizes the beverage stabilizers market based on application, function, type, and region. It provides information on the market size for various segments and subsegments in the beverage stabilizers market between 2018 and 2023.
Application
- Fruit drinks
- Dairy products
- Soft drinks
- Alcoholic Beverages
- Others (tea & coffee and sports & energy drinks)
Function
- Stabilization
- Texturization
- Viscosification
- Other functions (emulsification, thickening, and anti-crystallization)
Type
- Xanthan Gum
- Carrageenan
- Gum Arabic
- Carboxymethyl Cellulose
- Other types ( pectin, guar gum, and locust bean gum)
Region
-
North America
- US
- Canada
- Mexico
-
Europe
- Germany
- France
- Italy
- Rest of Europe (Switzerland, Ireland, and Belgium)
-
Asia Pacific
- China
- India
- Japan
- Rest of Asia Pacific (New Zealand, Thailand, Malaysia, and Indonesia)
-
RoW
- South America
- Middle East & Africa
Frequently Asked Questions (FAQ):
What is the market size of beverage stabilizers, and what is the market potential in the coming years?
The beverage stabilizers market is estimated to reach USD 117.1 million in 2018 and is projected to reach a value of USD 153.8 million by 2023, recording a CAGR of 5.6%. The growth of the beverage stabilizers market is driven by the rise in demand for healthier and natural food ingredients from the food industry.
What are some of the key application areas for beverage stabilizers? Which among them accounted for the largest share?
The market for beverage stabilizers has been segmented into fruit drinks, dairy, soft drinks, alcoholic beverages, and others. The fruit drinks segment is projected to account for the largest share due to the growing demand for health-based food products and drinks among consumers.
Who are the key players operating in the beverage stabilizers market?
The key players operating in the market include Cargill (US), Tate & Lyle (UK), DowDuPont (US), Ashland (US), Palsgaard (Denmark), Glanbia Nutritionals (US), Kerry Group (Ireland), Advanced Food Systems (US), Chemelco International (Netherlands), and Nexira (France).
What are some of the potentially high-growth markets for beverage stabilizers?
Asia Pacific and Europe are the high-growth markets for beverage stabilizers as the demand for low-fat, low-sugar, and high fiber foods have been growing in these two regions. The presence of major manufacturers in this region, such as Kerry Group and Chemelco, has added to the growth of the market in Europe.
What are some of the key factors that could hinder the growth of the market?
International bodies, such as the National Food Safety and Quality Service (SENASA), Canadian Food Inspection Agency (CFIA), US Food and Drug Administration (FDA), World Health Organization (WHO), and Committee on the Environment, Public Health and Food Safety (EU), are associated with food safety regulations. These organizations have stringent regulations that could hamper the growth of the market. .
To speak to our analyst for a discussion on the above findings, click Speak to Analyst
 Exclusive indicates content/data unique to MarketsandMarkets and not available with any competitors.
Table of Contents
1 Introduction (Page No. - 14)
1.1 Objectives of the Study
1.2 Market Definition
1.3 Study Scope
1.4 Periodization Considered for the Study
1.5 Currency Considered
1.6 Unit Considered
1.7 Stakeholders
2 Research Methodology (Page No. - 18)
2.1 Research Data
2.1.1 Secondary Data
2.1.2 Primary Data
2.1.2.1 Breakdown of Primary Interviews
2.2 Market Size Estimation
2.3 Data Triangulation
2.4 Research Assumptions
2.5 Research Limitations
3 Executive Summary (Page No. - 25)
4 Premium Insights (Page No. - 29)
4.1 Attractive Opportunities in the Beverage Stabilizers Market
4.2 Market Size For Beverage Stabilizers, By Region
4.3 Market For Beverage Stabilizers, By Type
4.4 Market For Beverage Stabilizers, By Application
4.5 Market For Beverage Stabilizers, By Function & Region, 2017
5 Market Overview (Page No. - 33)
5.1 Introduction
5.2 Market Dynamics
5.2.1 Drivers
5.2.1.1 Increasing Consumption of Beverages
5.2.1.2 Growing Demand for Customized Stabilizer Blends By Food & Beverage Manufacturers
5.2.1.3 Multifunctionality of Beverage Stabilizers Leads to Their Wide Applications
5.2.1.4 Increased Health Consciousness Among Consumers Drives the Natural Stabilizers Market
5.2.2 Restraints
5.2.2.1 Stringent International Quality Standards and Regulations
5.2.3 Opportunities
5.2.3.1 The Emerging Markets Illustrate Great Potential for Food Stabilizers
5.2.3.2 Increase in Investments for Research & Development to Develop New Products for the Market
5.2.3.3 Emergence of New Technologies to Boost the Beverage Industry
5.2.4 Challenges
5.2.4.1 Fluctuating Prices of Raw Materials
5.2.4.2 Demand for Clean Label Products From Consumers
5.3 Supply Chain Analysis
6 Beverage Stabilizers Market: Regulatory Framework (Page No. - 45)
6.1 Introduction
6.2 North America (US)
6.3 Europe
6.4 Asia Pacific (India)
6.5 RoW (South Africa)
7 Beverage Stabilizers Market, By Type (Page No. - 48)
7.1 Introduction
7.2 Xanthan Gum
7.3 Carrageenan
7.4 Gum Arabic
7.5 Carboxymethyl Cellulose (CMC)
7.6 Others
8 Beverage Stabilizers Market, By Function (Page No. - 58)
8.1 Introduction
8.2 Stabilization
8.3 Viscosification
8.4 Texturization
8.5 Other Functions
9 Beverage Stabilizers Market, By Application (Page No. - 64)
9.1 Introduction
9.2 Fruit Drinks
9.3 Dairy Products
9.4 Soft Drinks
9.5 Alcoholic Beverages
9.6 Others
10 Beverage Stabilizers Market, By Region (Page No. - 73)
10.1 Introduction
10.2 North America
10.3 Europe
10.4 Asia Pacific
10.5 Rest of the World (RoW)
11 Competitive Landscape (Page No. - 94)
11.1 Overview
11.2 Expansions & Investments
11.3 Acquisitions
11.4 New Product Developments
11.5 Agreements & Joint Ventures
12 Company Profiles (Page No. - 99)
(Business Overview, Products Offered, Recent Developments, SWOT Analysis & MnM View)*
12.1 Dowdupont
12.2 Ingredion Incorporated
12.3 Cargill
12.4 Palsgaard A/S
12.5 CP Kelco
12.6 Archer Daniels Midland Company (ADM)
12.7 BASF
12.8 Kerry Group
12.9 Glanbia Nutritionals
12.10 Ashland
12.11 Nexira
12.12 Tate & Lyle PLC
12.13 W.R. Grace & Co.
12.14 Advanced Food Systems Inc.
12.15 Chemelco International Bv
*Details on Business Overview, Products Offered, Recent Developments, SWOT Analysis & MnM View Might Not Be Captured in Case of Unlisted Companies.
#The Companies Listed are A Representative Sample of the Market’s Ecosystem and in No Particular Order
13 Appendix (Page No. - 130)
13.1 Discussion Guide
13.2 Knowledge Store: Marketsandmarkets’ Subscription Portal
13.3 Available Customizations
13.4 Related Reports
13.5 Author Details
List of Tables (71 Tables)
Table 1 US Dollar Exchange Rate Considered for Study, 2014–2017
Table 2 Applications and Functions of Various Stabilizers
Table 3 Snapshot: Summary/Definition of Food Additives (Singapore)
Table 4 Top Five GDP Per Capita (Ppp) for Emerging Economies in Asia Pacific, 2013
Table 5 List of Permitted Stabilizers in Beverages
Table 6 Beverage Stabilizers: an Overview of Their Basic Properties
Table 7 Market Size For Beverage Stabilizers, By Type, 2016–2023 (USD Million)
Table 8 Market Size For Beverage Stabilizers, By Function, 2016–2023 (KT)
Table 9 Xanthan Gum Market Size, By Region, 2016–2023 (USD Million)
Table 10 Xanthan Gum Market Size, By Region, 2016–2023 (KT)
Table 11 Carrageenan Market Size, By Region, 2016–2023 (USD Million)
Table 12 Carrageenan Market Size, By Region, 2016–2023 (KT)
Table 13 Gum Arabic Market Size, By Region, 2016–2023 (USD Million)
Table 14 Gum Arabic Market Size, By Region, 2016–2023 (KT)
Table 15 Carboxymethyl Cellulose (CMC) Market Size, By Region, 2016–2023 (USD Million)
Table 16 Carboxymethyl Cellulose (CMC) Market Size, By Region, 2016–2023 (KT)
Table 17 Others Beverage Stabilizers Market Size, By Region, 2016–2023 (USD Million)
Table 18 Other Beverage Stabilizers Market Size, By Region, 2016–2023 (KT)
Table 19 Market Size For Beverage Stabilizers, By Function, 2016–2023 (USD Million)
Table 20 Market Size For Beverage Stabilizers, By Function, 2016–2023 (KT)
Table 21 Stabilization : Market Size For Beverage Stabilizers, By Region, 2016–2023 (USD Million)
Table 22 Viscosification: Market Size For Beverage Stabilizers, By Region, 2016–2023 (USD Million)
Table 23 Texturization: Market Size For Beverage Stabilizers, By Region, 2016–2023 (USD Million)
Table 24 Other Functions: Market Size for Beverage Stabilizers, By Region, 2016–2023 (USD Million)
Table 25 Market Size For Beverage Stabilizers, By Application, 2016–2023 (USD Million)
Table 26 Market Size For Beverage Stabilizers, By Application, 2016–2023 (KT)
Table 27 Fruit Drinks: Beverage Stabilizers Market Size, By Region, 2016–2023 (USD Million)
Table 28 Fruit Drinks: Market Size For Beverage Stabilizers, By Region, 2016–2023 (KT)
Table 29 Dairy Products: Market Size for Beverage Stabilizers, By Region, 2016–2023 (USD Million)
Table 30 Dairy Products: Market Size For Beverage Stabilizers, By Region, 2016–2023 (KT)
Table 31 Soft Drinks: Market Size for Beverage Stabilizers, By Region, 2016–2023 (USD Million)
Table 32 Soft Drinks: Market Size For Beverage Stabilizers, By Region, 2016–2023 (KT)
Table 33 Alcoholic Beverages: Market Size for Beverage Stabilizers, By Region, 2016–2023 (USD Million)
Table 34 Alcoholic Beverages: Market Size For Beverage Stabilizers, By Region, 2016–2023 (KT)
Table 35 Others: Beverage Stabilizers Market Size, By Region, 2016–2023 (USD Million)
Table 36 Others: Market Size For Beverage Stabilizers, By Region, 2016–2023 (KT)
Table 37 Market Size For Beverage Stabilizers, By Region, 2016–2023 (USD Million)
Table 38 Market Size For Beverage Stabilizers, By Region, 2016–2023 (KT)
Table 39 North America: Beverage Stabilizers Market Size, By Country, 2016–2023 (USD Million)
Table 40 North America: Market Size For Beverage Stabilizers, By Country, 2016–2023 (KT)
Table 41 North America: Market Size For Beverage Stabilizers, By Type, 2016–2023 (USD Million)
Table 42 North America: Market Size For Beverage Stabilizers, By Type, 2016–2023 (KT)
Table 43 North America: Market Size For Beverage Stabilizers, By Application, 2016–2023 (USD Million)
Table 44 North America: Market Size For Beverage Stabilizers, By Application, 2016–2023 (KT)
Table 45 North America: Market Size For Beverage Stabilizers, By Function, 2016–2023 (USD Million)
Table 46 Europe: Beverage Stabilizers Market Size, By Country, 2016–2023 (USD Million)
Table 47 Europe: Market Size For Beverage Stabilizers, By Country, 2016–2023 (KT)
Table 48 Europe: Market Size For Beverage Stabilizers, By Type, 2016–2023 (USD Million)
Table 49 Europe: Market Size For Beverage Stabilizers, By Type, 2016–2023 (KT)
Table 50 Europe: Market Size For Beverage Stabilizers, By Application, 2016–2023 (USD Million)
Table 51 Europe: Market Size For Beverage Stabilizers, By Application, 2016–2023 (KT)
Table 52 Europe: Market Size For Beverage Stabilizers, By Function, 2016–2023 (USD Million)
Table 53 Asia Pacific: Beverage Stabilizers Market Size, By Country/Region, 2016–2023 (USD Million)
Table 54 Asia Pacific: Market Size For Beverage Stabilizers, By Country/Region, 2016–2023 (KT)
Table 55 Asia Pacific: Market Size For Beverage Stabilizers, By Type, 2016–2023 (USD Million)
Table 56 Asia Pacific: Market Size For Beverage Stabilizers, By Type, 2016–2023 (KT)
Table 57 Asia Pacific: Market Size For Beverage Stabilizers, By Application, 2016–2023 (USD Million)
Table 58 Asia Pacific: Market Size For Beverage Stabilizers, By Application, 2016–2023 (KT)
Table 59 Asia Pacific: Market Size For Beverage Stabilizers, By Function, 2016–2023 (USD Million)
Table 60 RoW: Beverage Stabilizers Market Size, By Country, 2016–2023 (USD Million)
Table 61 RoW: Market Size For Beverage Stabilizers, By Country, 2016–2023 (KT)
Table 62 RoW: Market Size For Beverage Stabilizers, By Type, 2016–2023 (USD Million)
Table 63 RoW: Market Size For Beverage Stabilizers, By Type, 2016–2023 (KT)
Table 64 RoW: Market Size For Beverage Stabilizers, By Application, 2016–2023 (USD Million)
Table 65 RoW: Market Size For Beverage Stabilizers, By Application, 2016–2023 (KT)
Table 66 RoW: Market Size For Beverage Stabilizers, By Function, 2016–2023 (USD Million)
Table 67 Beverage Stabilizers Market Ranking, 2017
Table 68 Expansions & Investments, 2013–2017
Table 69 Acquisitions, 2015–2017
Table 70 New Product Developments, 2015–2017
Table 71 Agreements & Joint Ventures, 2013–2015
List of Figures (39 Figures)
Figure 1 Market Segmentation
Figure 2 Regional Segmentation
Figure 3 Research Design
Figure 4 Breakdown of Primary Interviews: By Company Type, Designation, and Region
Figure 5 Market Size Estimation Methodology: Bottom-Up Approach
Figure 6 Market Size Estimation Methodology: Top-Down Approach
Figure 7 Data Triangulation Methodology
Figure 8 Fruit Drinks Segment to Dominate the Global Market, By Application, 2018 vs 2023 (USD Million)
Figure 9 Xanthan Gum Segment to Dominate the Global Market, By Type, 2018 vs 2023 (USD Million)
Figure 10 Stabilization Segment to Dominate the Beverage Stabilizers Market, By Function, 2018 vs 2023 (USD Million)
Figure 11 North America Was the Largest Regional Beverage Stabilizers Market (2017)
Figure 12 Benefits Associated With Beverage Stabilizers Fuel Its Market Demand
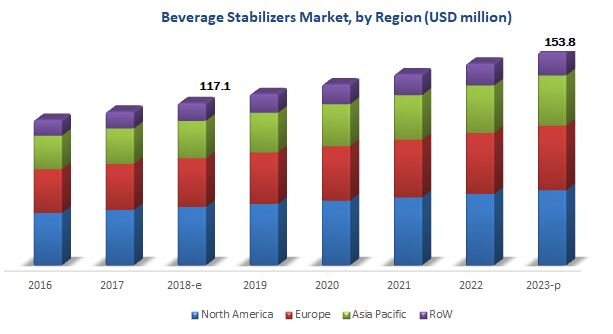
Figure 13 Market Size For Beverage Stabilizers, By Region, 2018 vs 2023 (USD Million)
Figure 14 Xanthan Gum is to Be the Most Used Beverage Stabilizer Through 2023
Figure 15 Fruit Drinks to Grow at the Highest Rate Between 2018 & 2023
Figure 16 Stabilization Accounted for the Largest Share Across All Functions in 2017
Figure 17 Beverage Stabilizers Market: Drivers, Restraints, Opportunities, and Challenges
Figure 18 Top Markets for Alcohol Consumption (Volume), 2013
Figure 19 The Most Innovative Beverage Sectors in Europe, 2014
Figure 20 Seaweed Production From 2010 to 2014
Figure 21 Beverage Stabilizers Market, By Type, 2018 vs 2023 (USD Million)
Figure 22 Stabilization Segment is Estimated to Dominate the Market in Terms of Value in 2018
Figure 23 Fruit Drinks Segment Dominated the Market From 2018 to 2023 (USD Million)
Figure 24 North America: Market Snapshot For Beverage Stabilizers
Figure 25 Europe: Market Snapshot For Beverage Stabilizers
Figure 26 Asia Pacific: Market Snapshot For Beverage Stabilizers
Figure 27 Expansions & Investments Have Fueled Growth & Innovation
Figure 28 Expansions & Investments: the Key Strategy, 2013–April 2018
Figure 29 Annual Developments in the Beverage Stabilizers Market, 2013–April 2018
Figure 30 Dowdupont: Company Snapshot
Figure 31 Ingredion Incorporated: Company Snapshot
Figure 32 Cargill: Company Snapshot
Figure 33 Archer Daniels Midland Company: Company Snapshot
Figure 34 BASF: Company Snapshot
Figure 35 Kerry Group: Company Snapshot
Figure 36 Glanbia Nutritionals: Company Snapshot
Figure 37 Ashland: Company Snapshot
Figure 38 Tate & Lyle PLC: Company Snapshot
Figure 39 W.R. Grace & Co.: Company Snapshot
This report includes estimations of the market size in terms of value (USD million) and volume (KT). The top-down and bottom-up approaches have been used to estimate and validate the size of the beverage stabilizers market and to estimate the size of various other dependent submarkets in the overall market. The key players in the market have been identified through secondary research; some of these sources are press releases, paid databases such as Factiva and Bloomberg, annual reports, and financial journals, ICBA (International Council of Beverage Associations), Food and Agricultural Organization (FAO), American Beverage Association (ABA), and Global Food & Beverage Association (GFBA); their market share in respective regions have also been determined through primary and secondary research processes. All percentage shares, splits, and breakdowns have been determined using secondary sources and verified through primary sources. The figure below shows the breakdown of profiles of industry experts that participated in primary discussions.
To know about the assumptions considered for the study, download the pdf brochure
The beverage stabilizers market is estimated at USD 117.1 million in 2018, and is projected to grow at a CAGR of 5.6% to reach a value of USD 153.8 million by 2023. Beverage stabilizers impart textural properties, physical functionalities, or physical stability to the products. They primarily stabilize oil and water emulsions. Beverage stabilizers are essential food additives that have been used by food & beverage manufacturers to maintain the end-product stability, texture, shape, and color.
The worldwide demand for beverage stabilizers is on the rise, particularly in the fruit drinks industry. The demand is governed by the performance quality and functionality of the products. Increasing demand for beverage stabilizers is one of the factors supporting market development and significant innovation.
The global market is segmented on the basis of application into fruit drinks, dairy products, soft drinks, alcoholic beverages, and others (which include tea & coffee and sports & energy drinks). The fruit drinks dominated the beverage stabilizers market; this segment accounted for the largest share in 2017. The increasing range of applications of stabilizers in the beverage industry is expected to fuel their demand for beverage stabilizers during the review forecast period. The dominance of this segment can be attributed to the increasing R&D investments from food ingredients companies and ongoing research for vaccinations.
The market is segmented on the basis of function into stabilization, texturization, viscosification, and others such as emulsification, thickening, and anti-crystallization. Beverage stabilizers prevent sedimentation, degradation, and turbidity during beverage processing and provide stability to beverages.
On the basis of the type, the global market is segmented into xanthan gum, carrageenan, gum arabic, carboxymethyl cellulose (CMC), and others include pectin, guar gum, and locust bean gum. Xanthan gum is used as a stabilizer, thickener, suspending agent, and emulsifier. It is widely used as an additive in gluten-free products, owing to its better binding characteristics in comparison to other food additives such as guar gum and locust bean gum.
The market is also segmented on the basis of the region into North America, Europe, Asia Pacific, and Rest of the World (RoW).
Europe and North America were the dominant regions in the market in 2017, as North America has several national institutes that support consumption of natural products that support the growth of this market in the North American region. However, Asia Pacific is projected to be the fastest-growing market during the forecast period, due to increased awareness and government funding and research for and on proteomics and increasing R&D investments in the region.
For More details on this research, Request Free Sample Report
The key drivers for the market’s growth are the rise in beverage consumption, the multi-functionality of beverage stabilizers, and the increase in the use of natural ingredients in foods, due to growth in consumer awareness about healthy diets. However, adherence to international quality standards and regulations for beverage additives such as stabilizers and the fluctuation of raw material prices act as restraints for the market’s growth.
Companies such as Cargill (US), Tate & Lyle (UK), DowDuPont (US), Ashland (US), Palsgaard (Denmark), Glanbia Nutritionals (US), Kerry Group (Ireland), Advanced Food Systems (US), Chemelco International (Netherlands), and Nexira (France) acquired leading market positions through the provision of a broad portfolio, catering to the varied requirements of the market, along with a focus on the diverse end-user segments. They are also focused on innovation and are geographically diversified.
Available Customizations
With the given market data, MarketsandMarkets offers customizations according to the company’s specific needs.
The following customization options are available for the report:
Segment Analysis
- Product Matrix, which gives a detailed comparison of the product portfolio of each company
Regional Analysis
- Further breakdown of the Asia Pacific beverage stabilizers market, by country
- Further breakdown of the Europe beverage stabilizers market, by country
- Further breakdown of the North America beverage stabilizers market, by country
- Further breakdown of the South American beverage stabilizers market, by country
- Further breakdown of the Middle Eastern & African beverage stabilizers market, by country
Company Information
- Detailed analysis and profiling of additional market players (up to five)


Growth opportunities and latent adjacency in Beverage Stabilizers Market