Blower Market by Product Type (Positive Displacement Blowers, Centrifugal Blowers, High-speed Turbo Blowers, Regenerative Blowers), Pressure (Up to 15 psi, 15-20 psi, Above 20 psi), Distribution Channel, End-Use Industry, & Region - Global Forecast to 2027
[229 Pages Report] The blower market size is estimated to be USD 3.5 billion in 2022 and is projected to reach USD 4.3 billion by 2027; it is projected to grow at a CAGR of 4.3% during the forecast period. The key drivers for the blower market increasing investment in industrial automation, increasing investment in water & wastewater treatment, and advancement in blower technology.
To know about the assumptions considered for the study, Request for Free Sample Report
Blower Market Dynamics
Driver: Increasing investments in industrial automation
Blowers are equipment or devices that increase the velocity of air or gas when passed through equipped impellers. They are mainly used for flow of air/gas required for fermentation, pneumatic conveying, exhausting, aspirating, aerating, cooling, ventilating, heating, etc. Blowers are used for a wide range of applications in industries such as cement, steel, mining, power, chemicals & petrochemicals, pulp & paper, food & beverage, pharmaceuticals, and water & wastewater treatment. 70% of all manufacturers use compressed air systems.
Rapidly increasing industrialization and manufacturing activities offer immense potential for the growth of the blower market due to increasing investments and capacity expansions. According to the United Nations Conference on Trade and Development (UNCTAD)’s World Investment Report 2021, global greenfield project investments in manufacturing industries amounted to USD 237 billion, out of which the developing economies accounted for USD 129 billion in 2020. Several emerging economies in Asia Pacific and Africa have boosted their industrial and economic developments. For instance, investments worth USD 101 billion were announced for manufacturing projects in Asia in 2020. In addition, government initiatives to promote industrial automation and emphasis on industrial automation for optimum utilization of resources are also driving the demand for blowers.
According to the International Energy Agency’s World Energy Investment Report 2021, the annual global energy investment is expected to reach USD 1.9 trillion in 2021, up nearly 10% from 2020 and bringing overall investment volume back to pre-crisis levels. The composition of these investments has evolved from traditional fuel production to power and end-user industries. New oil refineries are being constructed in Russia, China, Brunei, India, Saudi Arabia, and the US, while new power generation projects are being undertaken in Asia Pacific, Africa, and the Middle East. For instance, a total investment of USD 30 billion was made in coke and refined petroleum projects in 2020. Additionally, capacity expansion and construction of new chemical plants are taking place on a global scale in major economies such as China, India, South Korea, and Russia, among others. Subsequently, the chemical and petrochemical industries require blowers for processing and operating mechanisms
Restraint: High total cost of ownership
A blower’s lifecycle cost typically takes three factors into account: initial investment, lifetime maintenance costs, and lifetime energy costs. Power or energy consumption accounts for nearly 80–85% of a blower’s 10-year life span cost. Approximately 80% of the total cost of ownership is associated with energy expenses and the rest to maintenance and purchase price.
In the water & wastewater treatment industry, energy consumption and cost are the key drivers behind the development of more efficient aeration blower systems. These systems can account for as much as 70% of the total energy consumption of a wastewater treatment plant. Technological advancements in aeration blowers are providing new alternatives for lowering energy consumption. However, these alternatives also require deeper comprehension of the overall system and variations in operating conditions in order to increase return on investment and reduce the total cost of ownership. If the blower technology is used incorrectly, the expected cost benefit is unlikely to be achieved. Some of the major factors impacting the choice of blowers in water & wastewater treatment include daily and seasonal swings in oxygen demand, fouling and aging of diffusers, air flow control and turndown capabilities, total blower efficiency and energy consumption over time, mode of operation, blower accessories, and plant set up.
Opportunities: Increasing adoption of energy-efficient blowers
With the adoption of the Paris Agreement in 2015, the world needs to harness low-carbon energy sources to control greenhouse gas (GHG) emissions and limit the increase of global mean surface temperature to below 2°C relative to pre-industrial levels by the end of the century. With a growing focus on the reduction of energy costs and rising greenhouse gas emissions, attention has shifted toward the use of energy-efficient air solutions.
An air system is one of the key industry equipment that must follow this energy policy. According to the US Department of Energy (DOE), 50% of industrial plant air systems harbor opportunities for large energy savings with relatively low project costs. To achieve energy savings, air systems require proper maintenance and high-level monitoring. This results in an enhanced life cycle of pneumatic devices and ensures higher reliability of air systems. Applications that require low-pressure compressed air between 0.3–1.5 bar (4–22 psi) can be made more energy-efficient by replacing an air compressor with an air blower. Approximately 7% of energy is wasted when the air is compressed above the actual demand.
Energy consumption is the biggest operational cost for a blower. Modern blowers can achieve long-term savings and ensure a cleaner environment. Environment-friendly blowers need less fuel and make less noise. Also, modern generation blowers have a heat recovery feature, which helps recover up to 94% of the heat generated by compressors. This recovered energy can be used for pre-heating of the feedwater or air. This is a major advancement for power generation industries. High-speed turbo blowers are known for their highly efficient operation, resulting in low energy consumption and total cost of ownership. Modern compressed air systems also recommend using IE4-compliant motors as they help reduce electricity consumption. All these factors have created better growth opportunities for the blower market.
Furthermore, up to 70% of the energy consumption in a wastewater treatment plant is used for aeration. Additionally, five to ten times the purchase price of a blower is commonly spent on the energy consumption of the units. Several manufacturers are developing blowers with variable speed drives to lower energy consumption. For instance, Atlas Copco offers blowers with variable speed drives, which lower energy consumption by 30% on average compared to other technologies.
Challenges: Availability of low-quality and cheap products in the gray market and pricing pressure on manufacturers
The blower market is highly fragmented, with many local and international players. Product quality is a primary parameter for differentiation in this market. The organized sector mainly targets industrial buyers and maintains higher product quality by following various industrial standards of the product. At the same time, the unorganized sector offers cheaper alternatives. The local manufacturers in most regions in the country target the unorganized sector and compete strongly with global suppliers in the respective markets. The leading market players are currently facing stiff competition from the new players from the unorganized market, supplying cheap and low-quality products. These gray market players overpower the big players in terms of price competitiveness and local distribution network, which is a major challenge for the players operating in the blower market
Market Trends
To know about the assumptions considered for the study, download the pdf brochure
High Speed Turbo blower segment, by product type, is expected to be the fastest growing market during the forecast period
By product type, the blower market has been segmented into positive displacement, centrifugal, high-speed turbo blower, and regenerative. High-speed turbo blower is expected to be the fastest growing market during the forecast period. The market for the high-speed turbo blower segment is driven by the higher efficiency and the potential to reach high velocity for several operations.
By Pressure, the segment up to 15 psi is expected to be the largest and fastest growing market during the forecast period
By pressure, the blower market has been segmented into up to 15 psi, 15-20 psi, and above 20 psi. up to 15 psi is expected to be the fastest and largest segment during the forecast period. The market for the up to 15 psi segment is driven by the demand for blowers in applications such as aeration, gas treatment, dust collection, soot removal, and pneumatic transfer.
Food & beverage segment, by end-use industry, is expected to be the second largest market during the forecast period
By end-use industry, the blower market has been segmented into cement, steel, mining, power, chemical & petrochemicals, pulp & paper, food & beverage, pharmaceutical, water & wastewater treatment, and others. Food & beverage segment is expected to be the second largest segment during the forecast period.
“Asia Pacific: The largest and fastest blower market”
Asia Pacific is expected to dominate the blower market between 2022–2027, followed by North America. The blower market growth in Asia Pacific and North America is expected to be backed by the increasing investment in the wastewater treatment plant, chemical, and mining projects. The growing domestic manufacturing sector, including the food & beverage industry, will also drive the demand for blowers in these regions.
Key Market Players
The blower market is dominated by a few major players that have a wide regional presence. The major players in the blower market are Atlas Copco (Sweden), Ingersoll Rand (US), Kaeser Kompressoren (Germany), Aerzen (Germany), and Xylem (US). Between 2018 and 2022, the companies adopted growth strategies such as deals to capture a larger share of the blower market.
Get online access to the report on the World's First Market Intelligence Cloud
- Easy to Download Historical Data & Forecast Numbers
- Company Analysis Dashboard for high growth potential opportunities
- Research Analyst Access for customization & queries
- Competitor Analysis with Interactive dashboard
- Latest News, Updates & Trend analysis
Request Sample Scope of the Report
Get online access to the report on the World's First Market Intelligence Cloud
- Easy to Download Historical Data & Forecast Numbers
- Company Analysis Dashboard for high growth potential opportunities
- Research Analyst Access for customization & queries
- Competitor Analysis with Interactive dashboard
- Latest News, Updates & Trend analysis
Report Metric |
Details |
Market size available for years |
2020–2027 |
Base year considered |
2021 |
Forecast period |
2022–2027 |
Forecast units |
Value (USD Billion) |
Segments covered |
Blower market by product type, pressure, end-use industry, distribution channel, and region |
Geographies covered |
Asia Pacific, North America, Europe, Middle East & Africa, and South America |
Companies covered |
Ingersoll Rand (US), Atlas Copco (Sweden), Aerzen Machine (Germany), Xylem (US), Kaeser Kompressoren (Germany), Shandong Zhagqiu Blower (China), Everest Blower, MANVAC (China), REITZ Group (Germany), KAY International (India), Everest Blowers (India), Atlantic Blower (US), Savio SRL (Italy), Sofaco (Germany), New York blower company (US), Howden Group (UK), Ebara Corporation (Japan), DICHENG (China), and PILLER Blowers & Compressors (Germany) |
This research report categorizes the blower market by product type, pressure, end-use industry, distribution channel, and region
On the basis of product type:
- Positive Displacement Blowers
- Centrifugal Blowers
- High-speed Turbo Blowers
- Regenerative Blowers
On the basis of pressure:
- Up to 15 psi
- 15–20 psi
- Above 20 psi
On the basis of the end-use industry:
- Cement
- Steel
- Mining
- Power
- Chemicals & Petrochemicals
- Pulp & Paper
- Food & Beverage
- Pharmaceuticals
- Water & Wastewater Treatment
- Others
On the basis of the distribution channel:
- Online
- Offline
On the basis of region:
- Asia Pacific
- Europe
- North America
- Middle East & Africa
- South America
Recent Developments
- In July 2022, Atlas Copco acquired Bireme Group, a company specialized in the treatment of compressed air and gas. Bireme Group is a privately owned company with a sales network in Southeast Asia. The company specializes in the treatment of compressed air and gas for a broad spectrum of industries, ranging from electronics, food and beverage, chemical refineries, and hospitals.
- In June 2021, Aerzen expanded its product portfolio with the addition of the new AT 60 size to its Aerzen Turbo G5plus series. These blowers are suitable for applications in municipal or industrial wastewater treatment plants. Aerzen Turbo AT 60-0.9S is designed for volume flows from 900–2,640m3/h, and assembly capacities up to 50 kW.
- In February 2021, Ingersoll Rand completed the acquisition of Tuthill Vacuum and Blower Systems, a division of Tuthill Corporation, for USD 184 million. MD Pneumatics and Kinney Vacuum Pumps are leaders in the design and manufacture of positive displacement blowers, mechanical vacuum pumps, vacuum boosters, and engineered systems. Tuthill Vacuum and Blower Systems had approximately 160 employees and annual revenue of approximately USD 60 million. The employees and brands of the former Tuthill Vacuum and Blower Systems joined the Ingersoll Rand Industrial Technologies and Services (IT&S) segment.
- In January 2020, Xylem launched a new multi-disciplinary center for water, wastewater, and energy technologies at the company’s regional headquarters in Singapore. The Xylem Technology Hub Singapore (XTHS) represents the company’s continued investment in sustainable water technologies, and research at the new center will focus on developing breakthrough technologies in water distribution and water & wastewater treatment.
Frequently Asked Questions (FAQ):
What is the current size of the blower market?
The current market size of the blower market is USD 3.5 billion in 2022.
What are the major drivers for the blower market?
The growth of the blower market can be attributed to increasing investment in industrial automation, increasing investment in water & wastewater treatment, and advancements in blower technology
Which is the fastest-growing region during the forecasted period in the blower market?
Asia Pacific is expected to dominate the blower market between 2022–2027, followed by North America. The blower market growth in Asia Pacific and North America is expected to be backed by the increasing investment in the wastewater treatment plant, chemical, and mining projects. The growing domestic manufacturing sector, including the food & beverage industry, will also drive the demand for blowers in these regions
Which is the fastest-growing segment, by product type during the forecasted period in the blower market?
The High-speed turbo blower is expected to be the fastest growing market during the forecast period. The market for the high-speed turbo blower segment is driven by the higher efficiency and the potential to reach high velocity for several operations .
To speak to our analyst for a discussion on the above findings, click Speak to Analyst
TABLE OF CONTENTS
1 INTRODUCTION (Page No. - 20)
1.1 STUDY OBJECTIVES
1.2 MARKET DEFINITION
1.3 INCLUSIONS AND EXCLUSIONS
1.3.1 BLOWER MARKET, BY PRODUCT TYPE: INCLUSIONS & EXCLUSIONS
1.3.2 MARKET, BY PRESSURE: INCLUSIONS & EXCLUSIONS
1.3.3 MARKET, BY DISTRIBUTION CHANNEL
1.3.4 MARKET, BY END-USE INDUSTRY: INCLUSIONS & EXCLUSIONS
1.4 MARKET SCOPE
1.4.1 MARKET: SEGMENTATION
1.4.2 YEARS CONSIDERED
1.5 UNIT CONSIDERED
1.6 CURRENCY CONSIDERED
1.7 LIMITATIONS
1.8 STAKEHOLDERS
2 RESEARCH METHODOLOGY (Page No. - 27)
2.1 RESEARCH DATA
FIGURE 1 BLOWER MARKET: RESEARCH DESIGN
2.1.1 SECONDARY AND PRIMARY RESEARCH
2.1.2 SECONDARY DATA
2.1.2.1 List of key secondary sources
2.1.2.2 Secondary sources
2.1.3 PRIMARY DATA
2.1.3.1 Primary interviews with experts
2.1.3.2 Breakdown of primaries
2.1.3.3 Key data from primary sources
2.1.3.4 Key industry insights
2.2 SCOPE
2.3 FACTOR ANALYSIS
FIGURE 2 KEY METRICS CONSIDERED FOR ASSESSING SUPPLY OF BLOWERS
FIGURE 3 MARKET SIZE ESTIMATION METHODOLOGY: APPROACH 1 – SUPPLY-SIDE ANALYSIS: REVENUES GENERATED BY COMPANIES FROM SALES OF BLOWERS
FIGURE 4 MARKET SIZE ESTIMATION METHODOLOGY: APPROACH 1 – SUPPLY SIDE: ILLUSTRATION OF REVENUE ESTIMATIONS FOR ONE COMPANY IN BLOWER MARKET
2.3.1 SUPPLY-SIDE CALCULATION
2.3.2 ASSUMPTIONS FOR SUPPLY SIDE
FIGURE 5 MAIN METRICS CONSIDERED WHILE ASSESSING DEMAND FOR BLOWERS
FIGURE 6 MARKET SIZE ESTIMATION METHODOLOGY: APPROACH 2 – DEMAND-SIDE ANALYSIS: DEMAND FOR BLOWERS, BY TYPE
2.3.3 ASSUMPTIONS FOR DEMAND SIDE
2.3.4 CALCULATION FOR DEMAND SIDE
2.4 MARKET SIZE ESTIMATION
2.4.1 BOTTOM-UP APPROACH
2.4.1.1 Approach to obtain market size using bottom-up analysis
FIGURE 7 MARKET SIZE ESTIMATION METHODOLOGY: BOTTOM-UP APPROACH
2.4.2 TOP-DOWN APPROACH
2.4.2.1 Approach to obtain market size using top-down analysis
FIGURE 8 MARKET SIZE ESTIMATION METHODOLOGY: TOP-DOWN APPROACH
2.4.3 FORECAST
2.5 MARKET BREAKDOWN AND DATA TRIANGULATION
FIGURE 9 DATA TRIANGULATION
2.6 RESEARCH ASSUMPTIONS
2.6.1 ASSUMPTIONS
2.6.2 LIMITATIONS
2.7 RISK ASSESSMENT
3 EXECUTIVE SUMMARY (Page No. - 44)
TABLE 1 BLOWER MARKET SNAPSHOT
FIGURE 10 POSITIVE DISPLACEMENT SEGMENT TO HOLD LARGEST SHARE OF MARKET DURING FORECAST PERIOD
FIGURE 11 UP TO 15 PSI SEGMENT TO ACCOUNT FOR LARGEST SHARE OF MARKET IN 2027
FIGURE 12 ONLINE SEGMENT TO REGISTER HIGHER GROWTH RATE IN MARKET DURING FORECAST PERIOD
FIGURE 13 WATER & WASTEWATER TREATMENT SEGMENT TO DOMINATE MARKET DURING FORECAST PERIOD
4 PREMIUM INSIGHTS (Page No. - 48)
4.1 ATTRACTIVE OPPORTUNITIES FOR PLAYERS IN BLOWER MARKET
FIGURE 14 FOCUS ON IMPROVING WATER & WASTEWATER TREATMENT PLANT EFFICIENCY TO DRIVE MARKET FOR BLOWERS DURING 2022–2027
4.2 MARKET, BY PRODUCT TYPE
FIGURE 15 POSITIVE DISPLACEMENT SEGMENT TO ACCOUNT FOR LARGEST MARKET SHARE IN 2027
4.3 MARKET, BY PRESSURE
FIGURE 16 UP TO 15 PSI SEGMENT TO ACCOUNT FOR LARGEST MARKET SHARE IN 2027
4.4 MARKET, BY DISTRIBUTION CHANNEL
FIGURE 17 OFFLINE SEGMENT TO ACCOUNT FOR LARGER MARKET SHARE IN 2027
4.5 MARKET, BY END-USE INDUSTRY
FIGURE 18 WATER & WASTEWATER TREATMENT SEGMENT TO DOMINATE MARKET IN 2027
5 MARKET OVERVIEW (Page No. - 51)
5.1 INTRODUCTION
5.2 MARKET DYNAMICS
FIGURE 19 BLOWER MARKET: DRIVERS, RESTRAINTS, OPPORTUNITIES, AND CHALLENGES
5.2.1 DRIVERS
5.2.1.1 Increasing investments in industrial automation
TABLE 2 INDUSTRIAL USES OF BLOWERS
FIGURE 20 INDEX OF GLOBAL INDUSTRIAL PRODUCTION, 2015–2021
5.2.1.2 Increasing investments in water & wastewater treatment
5.2.1.3 Advancements in blower technology
5.2.2 RESTRAINTS
5.2.2.1 Increased financial losses, equipment downtime, and unnecessary capacity additions associated with air leaks
5.2.2.2 High total cost of ownership
5.2.3 OPPORTUNITIES
5.2.3.1 Increasing adoption of energy-efficient blowers
5.2.3.2 Rising demand for oil-free and Class 0-certified blowers
TABLE 3 ISO 8573-1:2010 COMPRESSED AIR CONTAMINANTS AND PURITY CLASSES
5.2.4 CHALLENGES
5.2.4.1 Availability of low-quality and cheap products in gray market and pricing pressure on manufacturers
5.2.4.2 Reducing noise pollution and enabling quieter operations
5.3 TRENDS/DISRUPTIONS IMPACTING CUSTOMER BUSINESS
5.3.1 REVENUE SHIFTS AND NEW REVENUE POCKETS FOR BLOWER PROVIDERS
FIGURE 21 REVENUE SHIFT FOR BLOWER PROVIDERS
5.4 MARKET MAP
FIGURE 22 MARKET MAP: MARKET
TABLE 4 MARKET: ROLE IN ECOSYSTEM
5.5 VALUE CHAIN ANALYSIS
FIGURE 23 VALUE CHAIN ANALYSIS: MARKET
5.5.1 RAW MATERIAL PROVIDERS/SUPPLIERS
FIGURE 24 GLOBAL IRON ORE PRICE TREND, 2021–2022
5.5.2 COMPONENT MANUFACTURERS
5.5.3 BLOWER MANUFACTURERS/ASSEMBLERS
5.5.4 DISTRIBUTORS (BUYERS)/END-USERS
5.5.5 POST-SALES SERVICE PROVIDERS
5.6 TRADE DATA
FIGURE 25 IMPORT AND EXPORT SCENARIO FOR HS CODE: 8414, 2016–2021 (USD BILLION)
TABLE 5 TRADE DATA FOR HS CODE: 8414, 2016–2021 (USD BILLION)
5.7 KEY CONFERENCES & EVENTS, 2022–2023
TABLE 6 BLOWER MARKET: LIST OF CONFERENCES & EVENTS
5.8 TARIFFS, CODES, AND REGULATIONS
5.8.1 TARIFFS RELATED TO BLOWERS
TABLE 7 IMPORT TARIFFS FOR HS 8414 IN 2019
5.8.2 CODES AND REGULATIONS RELATED TO BLOWERS
TABLE 8 BLOWERS: CODES AND REGULATIONS
5.8.3 REGULATORY BODIES, GOVERNMENT AGENCIES, AND OTHER ORGANIZATIONS
TABLE 9 GLOBAL: LIST OF REGULATORY BODIES, GOVERNMENT AGENCIES, AND OTHER ORGANIZATIONS
TABLE 10 NORTH AMERICA: LIST OF REGULATORY BODIES, GOVERNMENT AGENCIES, AND OTHER ORGANIZATIONS
TABLE 11 EUROPE: LIST OF REGULATORY BODIES, GOVERNMENT AGENCIES, AND OTHER ORGANIZATIONS
TABLE 12 ASIA PACIFIC: LIST OF REGULATORY BODIES, GOVERNMENT AGENCIES, AND OTHER ORGANIZATIONS
TABLE 13 REST OF WORLD: LIST OF REGULATORY BODIES, GOVERNMENT AGENCIES, AND OTHER ORGANIZATIONS
5.9 PATENT ANALYSIS
TABLE 14 BLOWERS: INNOVATIONS AND PATENT REGISTRATIONS, APRIL 2015–MAY 2022
5.10 PORTER’S FIVE FORCES ANALYSIS
FIGURE 26 MARKET: PORTER’S FIVE FORCES ANALYSIS
TABLE 15 MARKET: PORTER’S FIVE FORCES ANALYSIS
5.10.1 THREAT OF SUBSTITUTES
5.10.2 BARGAINING POWER OF SUPPLIERS
5.10.3 BARGAINING POWER OF BUYERS
5.10.4 THREAT OF NEW ENTRANTS
5.10.5 INTENSITY OF COMPETITIVE RIVALRY
5.11 KEY STAKEHOLDERS & BUYING CRITERIA
5.11.1 KEY STAKEHOLDERS IN BUYING PROCESS
FIGURE 27 INFLUENCE OF STAKEHOLDERS IN BUYING PROCESS, BY END-USE INDUSTRY
TABLE 16 INFLUENCE OF STAKEHOLDERS IN BUYING PROCESS, BY END-USE INDUSTRY (%)
5.11.2 BUYING CRITERIA
FIGURE 28 KEY BUYING CRITERIA FOR END-USE INDUSTRY
TABLE 17 KEY BUYING CRITERIA, BY END-USE INDUSTRY
5.12 AVERAGE SELLING PRICE TREND
FIGURE 29 AVERAGE SELLING PRICES OF DIFFERENT TYPES OF BLOWERS OFFERED BY KEY PLAYERS
TABLE 18 AVERAGE SELLING PRICES OF KEY PLAYERS FOR DIFFERENT TYPES OF BLOWERS (USD)
5.13 CASE STUDY ANALYSIS
5.13.1 SANDOZ’S WASTEWATER TREATMENT PLANT IN NAVI MUMBAI REDUCED ENERGY CONSUMPTION BY UP TO 17% BY USING SCREW BLOWERS
5.13.1.1 Problem statement
5.13.1.2 Solution
5.13.2 BLOWERS FOR DRYING OF NECKS OF BOTTLES FOR INKJET CODING AND DRYING OF BEVERAGE CANS
5.13.2.1 Problem statement
5.13.2.2 Solution
5.14 TECHNOLOGY ANALYSIS
6 BLOWER MARKET, BY PRODUCT TYPE (Page No. - 86)
6.1 INTRODUCTION
FIGURE 30 POSITIVE DISPLACEMENT BLOWERS SEGMENT ACCOUNTED FOR LARGEST MARKET SHARE IN 2021
TABLE 19 MARKET, BY PRODUCT TYPE, 2020–2027 (USD MILLION)
6.2 POSITIVE DISPLACEMENT BLOWERS
TABLE 20 POSITIVE DISPLACEMENT BLOWERS: MARKET, BY REGION, 2020–2027 (USD MILLION)
6.2.1 STRAIGHT BI-LOBE BLOWERS
6.2.1.1 Work well at heights and in high ambient temperatures
6.2.2 STRAIGHT TRI-LOBE BLOWERS
6.2.2.1 Provide high efficiency and produce less noise
6.2.3 TWISTED TRI-LOBE BLOWERS
6.2.3.1 Reduced pulsation and longer lifetime attributes
6.2.4 HELICAL SCREW BLOWERS
6.2.4.1 Can provide high pressure at constant volume
6.2.5 BLOWER PACKAGES
6.2.5.1 Compact design and versatile
6.3 CENTRIFUGAL BLOWERS
TABLE 21 CENTRIFUGAL BLOWERS: MARKET, BY REGION, 2020–2027 (USD MILLION)
6.3.1 FORWARD CURVED CENTRIFUGAL BLOWERS
6.3.1.1 Low capital cost requirements and simple design
6.3.2 BACKWARD INCLINED CENTRIFUGAL BLOWERS
6.3.2.1 Suitable for high-efficiency and high-pressure applications
6.3.3 RADIAL CENTRIFUGAL BLOWERS
6.3.3.1 Require low maintenance and have rugged construction
6.3.4 INLINE CENTRIFUGAL BLOWERS
6.3.4.1 Key features include versatility and compact design
6.3.5 PLUG CENTRIFUGAL BLOWERS
6.3.5.1 Can be customized
6.4 HIGH-SPEED TURBO BLOWERS
TABLE 22 HIGH-SPEED TURBO BLOWERS: MARKET, BY REGION, 2020–2027 (USD MILLION)
6.4.1 INTEGRALLY GEARED
6.4.1.1 Need low capital cost and are simple in design
6.4.2 MAGNETIC BEARING
6.4.2.1 Offer advantages of increased reliability and low maintenance cost
6.4.3 AIRFOIL BEARING
6.4.3.1 High efficiency and reduced complexity
6.5 REGENERATIVE BLOWERS
6.5.1 HAVE SMALL FOOTPRINT
TABLE 23 REGENERATIVE BLOWERS: MARKET, BY REGION, 2020–2027 (USD MILLION)
7 BLOWER MARKET, BY PRESSURE (Page No. - 95)
7.1 INTRODUCTION
FIGURE 31 UP TO 15 PSI SEGMENT ACCOUNTED FOR LARGEST MARKET SHARE IN 2021
TABLE 24 MARKET, BY PRESSURE, 2020–2027 (USD MILLION)
7.2 UP TO 15 PSI
7.2.1 SUITABLE FOR HIGH-FLOW-VOLUME APPLICATIONS
TABLE 25 UP TO 15 PSI: MARKET, BY REGION, 2020–2027 (USD MILLION)
7.3 15–20 PSI
7.3.1 USED IN APPLICATIONS REQUIRING MEDIUM AIR FLOW WITH MEDIUM RESISTANCE
TABLE 26 15–20 PSI: MARKET, BY REGION, 2020–2027 (USD MILLION)
7.4 ABOVE 20 PSI
7.4.1 DESIGNED FOR CONTINUOUS-DUTY INDUSTRIAL APPLICATIONS THAT REQUIRE HIGH STATIC PRESSURE AND LOW AIRFLOW
TABLE 27 ABOVE 20 PSI: MARKET, BY REGION, 2020–2027 (USD MILLION)
8 BLOWER MARKET, BY DISTRIBUTION CHANNEL (Page No. - 99)
8.1 INTRODUCTION
FIGURE 32 OFFLINE SEGMENT ACCOUNTED FOR LARGER MARKET SHARE IN 2021
TABLE 28 MARKET, BY DISTRIBUTION CHANNEL, 2020–2027 (USD MILLION)
8.2 OFFLINE
TABLE 29 OFFLINE: MARKET, BY REGION, 2020–2027 (USD MILLION)
8.2.1 DIRECT
8.2.1.1 Eliminates intermediaries involved in distribution and helps reduce advertising costs
8.2.2 INDIRECT
8.2.2.1 Facilitates better product reach
8.3 ONLINE
8.3.1 OFFERS FEASIBILITY AND CONVENIENCE
TABLE 30 ONLINE: MARKET, BY REGION, 2020–2027 (USD MILLION)
9 BLOWER MARKET, BY END-USE INDUSTRY (Page No. - 103)
9.1 INTRODUCTION
FIGURE 33 WATER & WASTEWATER TREATMENT INDUSTRY ACCOUNTED FOR LARGEST MARKET SHARE IN 2021
TABLE 31 MARKET, BY END-USE INDUSTRY, 2020–2027 (USD MILLION)
9.2 CEMENT
9.2.1 BLOWERS USED FOR PNEUMATIC CONVEYING, AERATION, DRYING, AND COMBUSTION APPLICATIONS
TABLE 32 CEMENT: MARKET, BY REGION, 2020–2027 (USD MILLION)
9.3 STEEL
9.3.1 BLOWERS USED FOR DUST, FUME, AND POLLUTION CONTROL, PROCESS HEATING, AND PNEUMATIC CONVEYING APPLICATIONS
TABLE 33 STEEL: MARKET, BY REGION, 2020–2027 (USD MILLION)
9.4 MINING
9.4.1 BLOWERS USED FOR AGITATION, LEACHING, CLEANING, MATERIAL HANDLING, AND VENTILATION
TABLE 34 MINING: MARKET, BY REGION, 2020–2027 (USD MILLION)
9.5 POWER
9.5.1 FLUE GAS DESULFURIZATION, VENTILATION, AND PNEUMATIC CONVEYING—KEY APPLICATIONS OF BLOWERS IN POWER INDUSTRY
TABLE 35 POWER: MARKET, BY REGION, 2020–2027 (USD MILLION)
9.6 CHEMICALS & PETROCHEMICALS
9.6.1 BLOWERS USED FOR PROCESS AIR APPLICATIONS
TABLE 36 CHEMICALS & PETROCHEMICALS: MARKET, BY REGION, 2020–2027 (USD MILLION)
9.7 PULP & PAPER
9.7.1 USE OF BLOWERS FOR DRYING, HEAT RECOVERY, DE-DUSTING, AND VENTILATION
TABLE 37 PULP & PAPER: MARKET, BY REGION, 2020–2027 (USD MILLION)
9.8 FOOD & BEVERAGE
9.8.1 OIL-FREE BLOWERS USED TO MAINTAIN AIR QUALITY
TABLE 38 FOOD & BEVERAGE: MARKET, BY REGION, 2020–2027 (USD MILLION)
9.9 PHARMACEUTICALS
9.9.1 USES BLOWERS TO ENSURE AIR PURITY
TABLE 39 PHARMACEUTICALS: MARKET, BY REGION, 2020–2027 (USD MILLION)
9.1 WATER & WASTEWATER TREATMENT
9.10.1 REQUIRE BLOWERS THAT CAN HANDLE VARIABLE AIR FLOW
TABLE 40 RECOMMENDED BLOWER TYPES FOR WATER & WASTEWATER TREATMENT APPLICATIONS
TABLE 41 WATER & WASTEWATER TREATMENT: MARKET, BY REGION, 2020–2027 (USD MILLION)
9.11 OTHERS
TABLE 42 OTHERS: MARKET, BY REGION, 2020–2027 (USD MILLION)
10 BLOWER MARKET, BY REGION (Page No. - 113)
10.1 INTRODUCTION
FIGURE 34 MARKET SHARE, BY REGION, 2021 (%)
FIGURE 35 MARKET IN ASIA PACIFIC TO REGISTER HIGHEST CAGR FROM 2022 TO 2027
TABLE 43 MARKET, BY REGION, 2020–2027 (USD MILLION)
TABLE 44 MARKET, BY REGION, 2020–2027 (THOUSAND UNITS)
10.2 NORTH AMERICA
FIGURE 36 NORTH AMERICA: MARKET SNAPSHOT
10.2.1 BY PRODUCT TYPE
TABLE 45 NORTH AMERICA: MARKET, BY PRODUCT TYPE, 2020–2027 (USD MILLION)
10.2.2 BY PRESSURE
TABLE 46 NORTH AMERICA: MARKET, BY PRESSURE, 2020–2027 (USD MILLION)
10.2.3 BY END-USE INDUSTRY
TABLE 47 NORTH AMERICA: MARKET, BY END-USE INDUSTRY, 2020–2027 (USD MILLION)
10.2.4 BY DISTRIBUTION CHANNEL
TABLE 48 NORTH AMERICA: MARKET, BY DISTRIBUTION CHANNEL, 2020–2027 (USD MILLION)
10.2.5 BY COUNTRY
TABLE 49 NORTH AMERICA: MARKET, BY COUNTRY, 2020–2027 (USD MILLION)
10.2.5.1 US
10.2.5.1.1 Surge in demand for food & beverages, petroleum, and chemical products to drive market growth
TABLE 50 US: MARKET, BY END-USE INDUSTRY, 2020–2027 (USD MILLION)
10.2.5.2 Canada
10.2.5.2.1 Increasing focus on oil & gas and water treatment plants to boost demand for blowers
TABLE 51 CANADA: MARKET, BY END-USE INDUSTRY, 2020–2027 (USD MILLION)
10.2.5.3 Mexico
10.2.5.3.1 Increasing investments in oil & gas and automotive industries to foster market expansion
TABLE 52 MEXICO: MARKET, BY END-USE INDUSTRY, 2020–2027 (USD MILLION)
10.3 ASIA PACIFIC
FIGURE 37 ASIA PACIFIC: MARKET SNAPSHOT
10.3.1 BY PRODUCT TYPE
TABLE 53 ASIA PACIFIC: MARKET, BY PRODUCT TYPE, 2020–2027 (USD MILLION)
10.3.2 BY PRESSURE
TABLE 54 ASIA PACIFIC: MARKET, BY PRESSURE, 2020–2027 (USD MILLION)
10.3.3 BY DISTRIBUTION CHANNEL
TABLE 55 ASIA PACIFIC: MARKET, BY DISTRIBUTION CHANNEL, 2020–2027 (USD MILLION)
10.3.4 BY END-USE INDUSTRY
TABLE 56 ASIA PACIFIC: MARKET, BY END-USE INDUSTRY, 2020–2027 (USD MILLION)
10.3.5 BY COUNTRY
TABLE 57 ASIA PACIFIC: MARKET, BY COUNTRY, 2020–2027(USD MILLION)
10.3.5.1 China
10.3.5.1.1 Increasing investments in power and wastewater treatment plants to drive blower market
TABLE 58 CHINA: MARKET, BY END-USER INDUSTRY, 2020–2027 (USD MILLION)
10.3.5.2 Australia
10.3.5.2.1 Industry-friendly government policies for lithium mining and increasing investments in hydrogen production to drive market
TABLE 59 AUSTRALIA: MARKET, BY END-USE INDUSTRY, 2020–2027 (USD MILLION)
10.3.5.3 India
10.3.5.3.1 Growth of chemicals, healthcare, and pharmaceuticals industries to fuel market growth
TABLE 60 INDIA: MARKET, BY END-USE INDUSTRY, 2020–2027 (USD MILLION)
10.3.5.4 Japan
10.3.5.4.1 Increasing investments in food & beverages sector, sustained growth of manufacturing industry to drive market
TABLE 61 JAPAN: MARKET, BY END-USE INDUSTRY, 2020–2027 (USD MILLION)
10.3.5.5 South Korea
10.3.5.5.1 Growth of steel, chemicals, and construction industries in South Korea to foster market expansion
TABLE 62 SOUTH KOREA: MARKET, BY END-USE INDUSTRY, 2020–2027 (USD MILLION)
10.3.5.6 Rest of Asia Pacific
TABLE 63 REST OF ASIA PACIFIC: MARKET, BY END-USE INDUSTRY, 2020–2027(USD MILLION)
10.4 EUROPE
10.4.1 BY PRODUCT TYPE
TABLE 64 EUROPE: MARKET, BY PRODUCT TYPE, 2020–2027 (USD MILLION)
10.4.2 BY PRESSURE
TABLE 65 EUROPE: MARKET, BY PRESSURE, 2020–2027 (USD MILLION)
10.4.3 BY END-USE INDUSTRY
TABLE 66 EUROPE: MARKET, BY END-USE INDUSTRY, 2020–2027 (USD MILLION)
10.4.4 BY DISTRIBUTION CHANNEL
TABLE 67 EUROPE: MARKET, BY DISTRIBUTION CHANNEL, 2020–2027 (USD MILLION)
10.4.5 BY COUNTRY
TABLE 68 EUROPE: MARKET, BY COUNTRY, 2020–2027 (USD MILLION)
10.4.6 UK
10.4.6.1 Expanding LNG market to increase deployment of blowers
TABLE 69 UK: MARKET, BY END-USE INDUSTRY, 2020–2027 (USD MILLION)
10.4.7 GERMANY
10.4.7.1 Growth of water & wastewater and chemicals industries are prominent drivers market growth
TABLE 70 GERMANY: MARKET, BY END-USE INDUSTRY, 2020–2027 (USD MILLION)
10.4.8 ITALY
10.4.8.1 Rising demand from crude steel and water treatment plants to augment market growth
TABLE 71 ITALY: MARKET, BY END-USE INDUSTRY, 2020–2027 (USD MILLION)
10.4.9 FRANCE
10.4.9.1 Rising demand for carbon fiber in chemicals industry to increase deployment of blowers
TABLE 72 FRANCE: MARKET, BY END-USE INDUSTRY, 2020–2027 (USD MILLION)
10.4.10 REST OF EUROPE
TABLE 73 REST OF EUROPE: MARKET, BY END-USE INDUSTRY, 2020–2027 (USD MILLION)
10.5 MIDDLE EAST & AFRICA
10.5.1 BY PRODUCT TYPE
TABLE 74 MIDDLE EAST & AFRICA: MARKET, BY PRODUCT TYPE, 2020–2027 (USD MILLION)
10.5.2 BY PRESSURE
TABLE 75 MIDDLE EAST & AFRICA: MARKET, BY PRESSURE, 2020–2027 (USD MILLION)
10.5.3 BY END-USE INDUSTRY
TABLE 76 MIDDLE EAST & AFRICA: MARKET, BY END-USE INDUSTRY, 2020–2027 (USD MILLION)
10.5.4 BY DISTRIBUTION CHANNEL
TABLE 77 MIDDLE EAST & AFRICA: MARKET, BY DISTRIBUTION CHANNEL, 2020–2027 (USD MILLION)
10.5.5 BY COUNTRY
TABLE 78 MIDDLE EAST & AFRICA: MARKET, BY COUNTRY, 2020–2027 (USD MILLION)
10.5.6 SAUDI ARABIA
10.5.6.1 Rise in crude oil production to drive market
TABLE 79 SAUDI ARABIA: MARKET, BY END-USE INDUSTRY, 2020–2027 (USD MILLION)
10.5.7 UAE
10.5.7.1 Rising demand from oilfields and water treatment plants to foster market growth
TABLE 80 UAE: MARKET, BY END-USE INDUSTRY, 2020–2027 (USD MILLION)
10.5.8 SOUTH AFRICA
10.5.8.1 Mining activities to spur demand for blowers
TABLE 81 SOUTH AFRICA: MARKET, BY END-USE INDUSTRY, 2020–2027 (USD MILLION)
10.5.9 REST OF MIDDLE EAST & AFRICA
TABLE 82 REST OF MIDDLE EAST & AFRICA: MARKET, BY END-USE INDUSTRY, 2020–2027 (USD MILLION)
10.6 SOUTH AMERICA
10.6.1 BY PRODUCT TYPE
TABLE 83 SOUTH AMERICA: MARKET, BY PRODUCT TYPE, 2020–2027 (USD MILLION)
10.6.2 BY PRESSURE
TABLE 84 SOUTH AMERICA: MARKET, BY PRESSURE, 2020–2027 (USD MILLION)
10.6.3 BY END-USE INDUSTRY
TABLE 85 SOUTH AMERICA: MARKET, BY END-USE INDUSTRY, 2020–2027 (USD MILLION)
10.6.4 BY DISTRIBUTION CHANNEL
TABLE 86 SOUTH AMERICA: MARKET, BY DISTRIBUTION CHANNEL, 2020–2027 (USD MILLION)
10.6.5 BY COUNTRY
TABLE 87 SOUTH AMERICA: MARKET, BY COUNTRY, 2020–2027 (USD MILLION)
10.6.5.1 Brazil
10.6.5.1.1 Increasing investment in oil & gas and power generation industries to propel demand for blower
TABLE 88 BRAZIL: MARKET, BY END-USE INDUSTRY, 2020–2027 (USD MILLION)
10.6.5.2 Argentina
10.6.5.2.1 Favorable government policies and investments in industrial development to support market growth
TABLE 89 ARGENTINA: MARKET, BY END-USE INDUSTRY, 2020–2027 (USD MILLION)
10.6.5.3 Rest of South America
TABLE 90 REST OF SOUTH AMERICA: MARKET, BY END-USE INDUSTRY, 2020–2027 (USD MILLION)
11 COMPETITIVE LANDSCAPE (Page No. - 154)
11.1 KEY PLAYERS STRATEGIES
TABLE 91 OVERVIEW OF KEY STRATEGIES ADOPTED BY TOP PLAYERS, 2018–2022
11.2 MARKET SHARE ANALYSIS OF TOP FIVE PLAYERS
TABLE 92 MARKET: DEGREE OF COMPETITION
FIGURE 38 MARKET SHARE ANALYSIS, 2021
11.3 REVENUE ANALYSIS OF TOP 5 MARKET PLAYERS
FIGURE 39 TOP PLAYERS IN MARKET FROM 2017 TO 2021
11.4 COMPANY EVALUATION QUADRANT
11.4.1 STARS
11.4.2 PERVASIVE
11.4.3 EMERGING LEADERS
11.4.4 PARTICIPANTS
FIGURE 40 BLOWER MARKET: COMPANY EVALUATION QUADRANT, 2021
11.5 START-UP/SME EVALUATION QUADRANT, 2021
11.5.1 PROGRESSIVE COMPANIES
11.5.2 RESPONSIVE COMPANIES
11.5.3 DYNAMIC COMPANIES
11.5.4 STARTING BLOCKS
FIGURE 41 MARKET: START-UP/SME EVALUATION QUADRANT, 2021
11.5.5 COMPETITIVE BENCHMARKING
TABLE 93 MARKET: DETAILED LIST OF KEY STARTUPS/SMES
TABLE 94 MARKET: COMPETITIVE BENCHMARKING OF KEY STARTUPS/SMES
11.6 BLOWER MARKET: COMPANY FOOTPRINT
TABLE 95 PRODUCT TYPE: COMPANY FOOTPRINT
TABLE 96 PRESSURE: COMPANY FOOTPRINT
TABLE 97 END-USE INDUSTRY: COMPANY FOOTPRINT
TABLE 98 REGION: COMPANY FOOTPRINT
TABLE 99 COMPANY FOOTPRINT
11.7 COMPETITIVE SCENARIOS AND TRENDS
TABLE 100 MARKET: PRODUCT LAUNCHES, JANUARY 2018–MARCH 2022
TABLE 101 MARKET: DEALS, JANUARY 2018–MARCH 2022
12 COMPANY PROFILES
12.1 KEY PLAYERS
(Business and Financial Overview, Products offered, Recent Developments, MnM View)*
12.1.1 ATLAS COPCO
TABLE 102 ATLAS COPCO: BUSINESS OVERVIEW
FIGURE 42 ATLAS COPCO: COMPANY SNAPSHOT, 2021
TABLE 103 ATLAS COPCO: PRODUCTS OFFERED
TABLE 104 ATLAS COPCO: PRODUCT LAUNCHES
TABLE 105 ATLAS COPCO: DEALS
TABLE 106 ATLAS COPCO: OTHERS
12.1.2 INGERSOLL RAND
TABLE 107 INGERSOLL RAND: BUSINESS OVERVIEW
FIGURE 43 INGERSOLL RAND: COMPANY SNAPSHOT, 2021
TABLE 108 INGERSOLL RAND: PRODUCTS OFFERED
TABLE 109 INGERSOLL RAND: PRODUCT LAUNCHES
TABLE 110 INGERSOLL RAND: DEALS
12.1.3 KAESER KOMPRESSOREN
TABLE 111 KAESER KOMPRESSOREN: BUSINESS OVERVIEW
TABLE 112 KAESER KOMPRESSOREN: PRODUCTS OFFERED
TABLE 113 KAESER KOMPRESSOREN: PRODUCT LAUNCHES
12.1.4 AERZEN
TABLE 114 AERZEN: BUSINESS OVERVIEW
TABLE 115 AERZEN: PRODUCTS OFFERED
TABLE 116 AERZEN: PRODUCT LAUNCHES
12.1.5 XYLEM
TABLE 117 XYLEM: BUSINESS OVERVIEW
FIGURE 44 XYLEM: COMPANY SNAPSHOT, 2021
TABLE 118 XYLEM: PRODUCTS OFFERED
TABLE 119 XYLEM: PRODUCT LAUNCHES
TABLE 120 XYLEM: OTHERS
12.1.6 SHANDONG ZHANGQIU BLOWER CO. LTD
TABLE 121 SHANDONG ZHANGQIU BLOWER: BUSINESS OVERVIEW
FIGURE 45 SHANDONG ZHANGQIU BLOWER: COMPANY SNAPSHOT, 2021
TABLE 122 SHANDONG ZHANGQIU BLOWER: PRODUCTS OFFERED
12.1.7 MANVAC
TABLE 123 MANVAC: BUSINESS OVERVIEW
TABLE 124 MANVAC: PRODUCTS OFFERED
TABLE 125 MANVAC: PRODUCT LAUNCHES
12.1.8 REITZ GROUP
TABLE 126 REITZ GROUP: BUSINESS OVERVIEW
TABLE 127 REITZ GROUP: PRODUCTS OFFERED
12.1.9 EVEREST BLOWERS
TABLE 128 EVEREST BLOWERS: BUSINESS OVERVIEW
TABLE 129 EVEREST BLOWERS: PRODUCTS OFFERED
TABLE 130 EVEREST BLOWERS: OTHERS
12.1.10 MITSUBISHI HEAVY INDUSTRIES
TABLE 131 MITSUBISHI HEAVY INDUSTRIES: BUSINESS OVERVIEW
FIGURE 46 MITSUBISHI HEAVY INDUSTRIES: COMPANY SNAPSHOT, 2021
TABLE 132 MITSUBISHI HEAVY INDUSTRIES: PRODUCTS OFFERED
12.1.11 SOFASCO
TABLE 133 SOFASCO: BUSINESS OVERVIEW
TABLE 134 SOFASCO: PRODUCTS OFFERED
12.1.12 PILLER BLOWERS & COMPRESSORS
TABLE 135 PILLER BLOWERS & COMPRESSORS: BUSINESS OVERVIEW
TABLE 136 PILLER BLOWERS & COMPRESSORS: PRODUCTS OFFERED
12.1.13 ATLANTIC BLOWERS
TABLE 137 ATLANTIC BLOWERS: BUSINESS OVERVIEW
TABLE 138 ATLANTIC BLOWERS: PRODUCTS OFFERED
12.1.14 HOWDEN GROUP
TABLE 139 HOWDEN GROUP: BUSINESS OVERVIEW
TABLE 140 HOWDEN GROUP: PRODUCTS OFFERED
12.1.15 DICHENG
TABLE 141 DICHENG: BUSINESS OVERVIEW
TABLE 142 DICHENG: PRODUCTS OFFERED
12.1.16 KAY INTERNATIONAL
TABLE 143 KAY INTERNATIONAL: BUSINESS OVERVIEW
TABLE 144 KAY INTERNATIONAL: PRODUCTS OFFERED
12.2 OTHER PLAYERS
12.2.1 SAVIO S.R.L
12.2.2 SHANDONG HUADONG BLOWER CO., LTD
12.2.3 THE NEW YORK BLOWER COMPANY
12.2.4 EBARA CORPORATION
*Details on Business and Financial Overview, Products offered, Recent Developments, MnM View might not be captured in case of unlisted companies.
13 APPENDIX (Page No. - 220)
13.1 INSIGHTS FROM INDUSTRY EXPERTS
13.2 DISCUSSION GUIDE
13.3 KNOWLEDGESTORE: MARKETSANDMARKETS’ SUBSCRIPTION PORTAL
13.4 CUSTOMIZATION OPTIONS
13.5 RELATED REPORTS
13.6 AUTHOR DETAILS
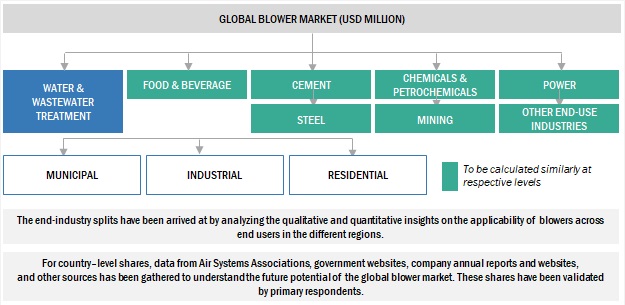
The study involved major activities in estimating the current size of the global blower market. Exhaustive secondary research was done to collect information on the peer and parent markets. The next step was to validate these findings, assumptions, and sizing with industry experts across the value chain through primary research. Both top-down and bottom-up approaches were employed to estimate the complete market size. Thereafter, market breakdown and data triangulation were used to estimate the market size of the segments and subsegments.
Secondary Research
This research study on the blower market involved the use of extensive secondary sources, directories, and databases, such as Hoovers, Bloomberg, Businessweek, Factiva, International Energy Agency, and BP Statistical Review of World Energy, to identify and collect information useful for a technical, market-oriented, and commercial study of the global blower market. The other secondary sources included annual reports, press releases & investor presentations of companies, white papers, certified publications, articles by recognized authors, manufacturer associations, trade directories, and databases.
Primary Research
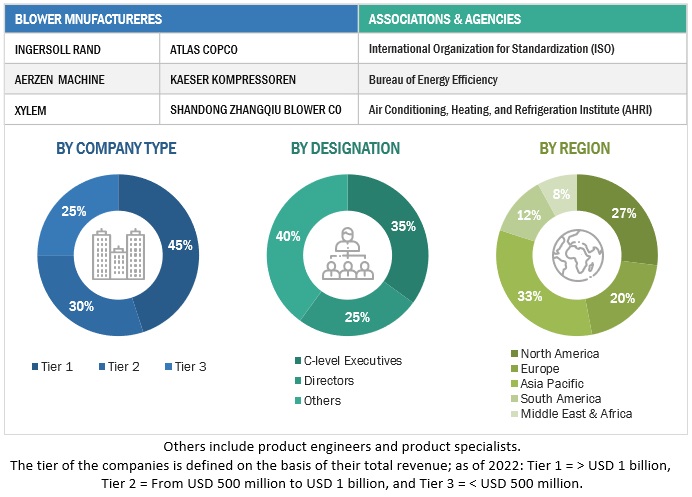
The blower market comprises several stakeholders such as blower manufacturers, manufacturing technology providers, and technical support providers in the supply chain. The demand side of this market is characterized by the rising demand for blowers in the end-use industry such as water & wastewater treatment, food & beverage, power, and steel among others. The supply side is characterized by rising demand for contracts from the industrial sector, and mergers & acquisitions among big players. Various primary sources from both the supply and demand sides of the market were interviewed to obtain qualitative and quantitative information. Following is the breakdown of primary respondents:
To know about the assumptions considered for the study, download the pdf brochure
Market Size Estimation
Both top-down and bottom-up approaches were used to estimate and validate the total size of the global blower market. These methods were also used extensively to estimate the size of various subsegments in the market. The research methodology used to estimate the market size includes the following:
- The key players in the industry and market have been identified through extensive secondary research, and their market share in the respective regions have been determined through both primary and secondary research.
- The industry’s value chain and market size, in terms of value, have been determined through primary and secondary research processes.
- All percentage shares, splits, and breakdowns have been determined using secondary sources and verified through primary sources.
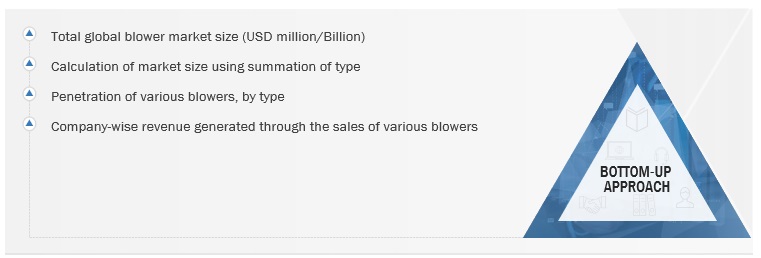
Global Blower Market Size: Bottom-Up Approach
To know about the assumptions considered for the study, Request for Free Sample Report
Data Triangulation
After arriving at the overall market size from the estimation process explained above, the total market has been split into several segments and subsegments. To complete the overall market engineering process and arrive at the exact statistics for all the segments and subsegments, the data triangulation and market breakdown processes have been employed, wherever applicable. The data has been triangulated by studying various factors and trends from both the demand- and supply sides. Along with this, the market has been validated using both the top-down and bottom-up approaches.
Objectives of the Study
- To define, describe, analyze, and forecast the size of the global blower market, by product type, pressure, distribution channel, end-use industry, and in terms of value and volume
- To provide detailed information on the major drivers, restraints, opportunities, and industry-specific challenges influencing the growth of the market
- To provide detailed information on market map, value chain, case studies, technologies, market ecosystem, tariff and regulatory landscape, Porter’s five forces, and trends/disruptions impacting customers’ businesses that are specific to the market
- To analyze market opportunities for stakeholders in the blower market and draw a competitive landscape for the market players
- To benchmark players within the market using the company evaluation matrix, which analyzes market players on various parameters within the broad categories of business excellence and strength of product portfolio
- To compare key market players with respect to the market share, product specifications, and end users
- To strategically analyze micromarkets with regard to individual growth trends, prospects, and contributions to the total market
- To strategically profile the key players and comprehensively analyze their market shares and core competencies
- To track and analyze competitive developments in the blower market, such as expansions, product launches, and acquisitions
Available Customizations:
With the given market data, MarketsandMarkets offers customizations according to the company’s specific needs. The following customization options are available for the report:
Product Analysis
- Product Matrix, which provides a detailed comparison of the product portfolio of each company
Company Information
- Detailed analyses and profiling of additional market players
Growth opportunities and latent adjacency in Blower Market