Blue Hydrogen Market by Technology (Steam Methane Reforming (SMR), Gas Partial Oxidation (POX), Auto Thermal Reforming (ATR)), End User (Petroleum Refineries, Chemical Industry, Power Generation Facilities) and Region - Forecast to 2030
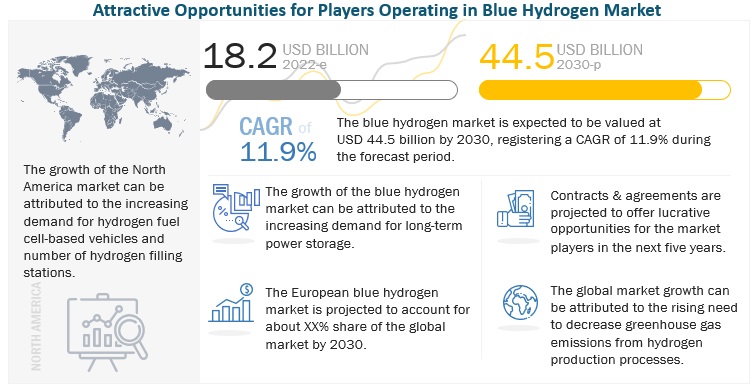
[152 Pages Report] The global blue hydrogen market is expected to grow from USD 18.2 billion in 2022 to USD 44.5 billion by 2030, at a CAGR of 11.9% during the forecast period. The factors driving the market growth are increasing hydrogen demand in petroleum refineries and transportation and power generation applications.
To know about the assumptions considered for the study, Request for Free Sample Report
Blue Hydrogen Market Dynamics
Driver: Increasing applications of hydrogen in fuel cell electric vehicles (FCEVs)
Hydrogen has long been recognized as a possible low-carbon transportation fuel, but incorporating it into the mix of transportation fuels has been a challenge. It has an advantage over fossil fuels, which are depleting and, thereby, becoming expensive day by day. Hydrogen is in enormous demand for use in fuel cell electric vehicles and rockets in the aerospace industry. In the transportation sector, fuel cell costs and refueling stations determine how competitive hydrogen fuel cell automobiles are but lowering the supplied price of hydrogen is a top concern for truck manufacturers. There are few low-carbon fuel options for ships and aircraft, which presents a chance for hydrogen-based fuels. Hydrogen fuel cells are widely used globally in lightweight vehicles such as bicycles, cars, buses, trains, material handling equipment, boats, ships, commercial aircraft, auxiliary power units (APUs) of aircraft, marine vessels, and specialty vehicles such as forklifts. The concurrent construction of supportive infrastructure should complement the deployment of fuel cell vehicles. More than 540 hydrogen refueling stations were operational in 2020, an increase of more than 15% over 2019. With nearly 140 stations, Japan maintained its dominance, followed by Germany (90) and China (85).
Restraint: Loss of energy during hydrogen production
Hydrogen is a synthetic energy carrier. Electrical energy is converted to hydrogen by water electrolysis. However, high-grade electrical energy is also used to compress, liquefy, transport, transfer, or store the medium in addition to creating hydrogen. Hydrogen must be produced using energy. The energy input and the energy content of the synthetic gas should ideally match. Energy is transformed during the process of creating hydrogen using any method, including electrolysis and reforming. Electrical energy or the chemical energy of hydrocarbons are both turned into hydrogen's chemical energy. Unfortunately, the production of hydrogen always involves energy losses.
Every stage of the value chain for producing hydrogen results in energy loss. The energy required for electrolysis is lost by about 30% during manufacture. During the conversion to other forms, another 10 to 25% is lost. Energy input is needed to deliver green hydrogen, either in the form of fuel for vehicles or energy from pipes. Utilizing hydrogen in fuel cells results in more energy loss.
Opportunities: Rising focus on achieving net zero emission target by 2050
Under the scenario of net zero emissions, hydrogen production experiences an unprecedented revolution. In 2030, when the world's output of H2 hits 200 Mt, low-carbon technologies will produce 70% of it. The production of hydrogen will have increased to 500 Mt H2 by 2050, largely because of low-carbon technologies. To attain net zero emissions by 2050, the energy system will need to be modified using several technologies. The main pillars for decarbonizing the global energy system are projected to be energy efficiency, behavioral modification, electricity, renewable energy, Carbon capture utilization and storage (CCUS), and hydrogen.
In the net zero emissions scenario, strong hydrogen demand growth and the adoption of cleaner technologies for its production will allow hydrogen and hydrogen-based fuels to preclude up to 60 Gt of CO2 emissions in 2021–2050, or 6.5% of all cumulative emissions reductions. Hydrogen fuel is crucial for reducing greenhouse emissions in hard-to-decarbonize industries, including heavy industries (especially steel and chemical), heavy-duty road transport, shipping, and aviation, where direct electrification is challenging.
Challenges: Integration of hydrogen into natural gas networks
Integrating hydrogen into gas networks can promote the initial implementation of low-carbon hydrogen and lead to cost reductions for low-carbon hydrogen-generating technologies by acting as a temporary fix until specialized hydrogen transport systems are established. Although several pilot projects have been started recently, there are still many technological and legal obstacles to blending. Integrating hydrogen can be difficult due to the hydrogen purity requirements of some end users, especially industrial clients. Additionally, subsequent modifications to the gas’s physical properties may impact specific processes, such as metering. Hydrogen blending will necessitate closer cooperation between nearby gas markets to prevent interoperability problems brought on by the changing quality of gas.
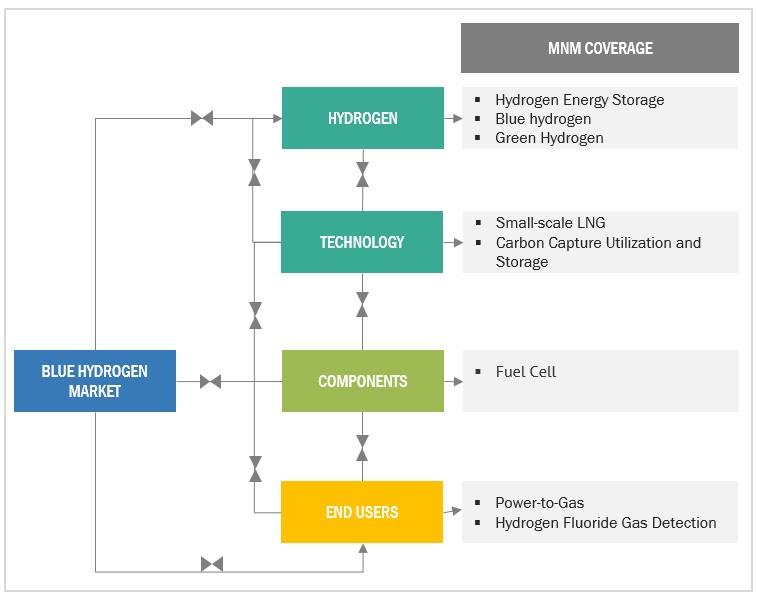
Market Map:
To know about the assumptions considered for the study, download the pdf brochure
SMR is expected to be the largest segment of the blue hydrogen market, by technology, during the forecast period
The SMR segment is expected to dominate the blue hydrogen market, by technology, and is also expected to grow the fastest during the forecast period. The demand for SMR is increasing due to the rise in government initiatives to shift toward clean energy sources in North America.
Petroleum refinery is expected to be the largest and fastest-growing segment, by end user, during the forecast period
The market, by end user, is segmented into petroleum refinery, chemical industry, power generation, and others. The petroleum refinery segment is expected to dominate the blue hydrogen market in terms of market share and CAGR, followed by the chemical industry segment in terms of market share.
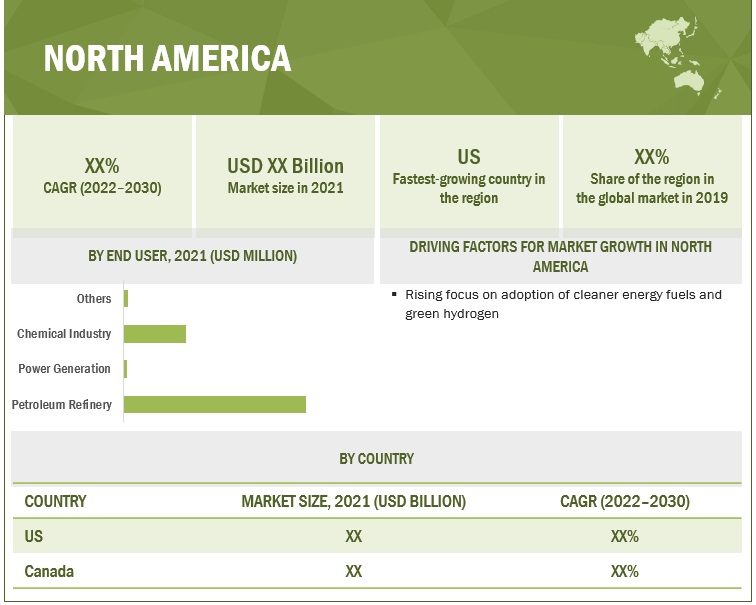
North America is expected to dominate the global blue hydrogen market
North America is estimated to be the largest market for blue hydrogen, followed by Europe. The European region is projected to be the fastest-growing market during the forecast period. The growth of the European blue hydrogen market is expected to be driven by the increasing demand for fuel cell-based electric vehicles and a shift toward a hydrogen-based economy.
Key Market Players
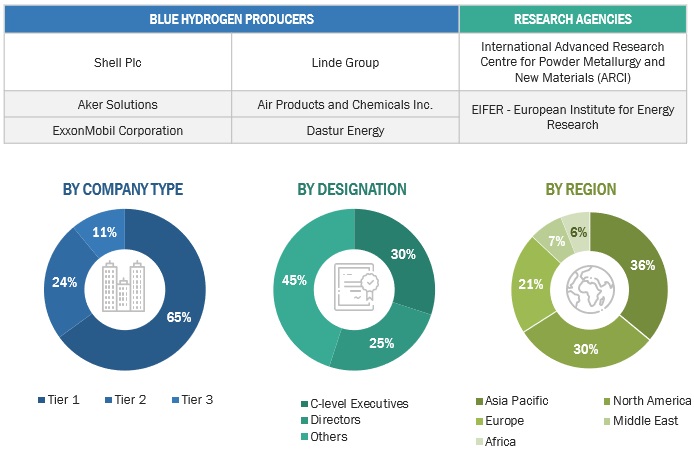
The major players in the blue hydrogen market are Shell Plc (US), Linde plc (Ireland), ExxonMobil Corporation (US), Air Liquide (France), and Air Products Inc. (US). Between 2018 and 2021, the blue hydrogen companies adopted growth strategies such as contracts & agreements, investments & expansions, partnerships, collaborations, and alliances & joint ventures to capture the largest share of the market.
Scope of the Report
|
Report Metrics |
Details |
| Market size available for years | 2020–2030 |
| Base year considered | 2021 |
| Forecast period | 2022–2030 |
| Forecast units | Value (USD Million/USD Billion); Volume (Thousand Metric Tons) |
| Segments covered | Technology, End User, Region |
| Geographies covered | North America, Europe, Asia Pacific, and RoW |
| Companies covered | Shell plc (UK), Linde plc (Ireland), Air Products and Chemicals, Inc. (US), Aker Solutions (Norway), ExxonMobil Corporation (US), Dastur Energy (US), Topsoe (Denmark), Equinor ASA (Norway), Uniper SE (Germany), Petrofac Limited (US), BP p.l.c. (UK), Eni (Italy), Technip Energies N.V. (France), Johnson Matthey (UK), ENGIE Group (France), thyssenkrupp AG (Germany), Xebec Adsorption Inc. (Canada), INEOS (US), Aquaterra Energy Limited. (UK), and The State Atomic Energy Corporation ROSATOM (Russia). |
This research report categorizes the blue hydrogen market by technology, end user, and region.
Based on technology, the market has been segmented as follows:
- Steam Methane Reforming (SMR)
- Gas Partial Oxidation (POX)
- Auto Thermal Reforming (ATR)
Based on end user, the market has been segmented as follows:
- Petroleum Refineries
- Chemical Industry
- Power Generation Facilities
- Others
Based on region, the market has been segmented as follows:
- Europe
- Asia Pacific
- North America
- RoW
Recent Developments
- In March 2022, Air Products Inc. has announced the construction and operation of the new liquid hydrogen production plant in Casa Grande, Arizona. It will be a zero-carbon liquid hydrogen facility and will be operational by 2023.
- In January 2022, Linde plc has signed an agreement with Yara to construct and deliver a 24 MW hydrogen plant.
Frequently Asked Questions (FAQ):
What was the market size of the blue hydrogen market in 2021?
The market size of the global blue hydrogen market was USD 16.9 Billion in 2021.
What are the major drivers for the blue hydrogen market?
The factors driving the growth of the blue hydrogen market are the increasing demand for hydrogen in the industrial sector and transportation and power generation applications.
Which is expected to be the fastest-growing regional market during the forecasted period?
Europe is expected to grow at the highest CAGR during the forecast period, driven mainly by the increasing number of green hydrogen projects and government initiatives for its implementation in the residential and commercial sectors.
Which is projected to be the fastest-growing segment, by technology, during the forecasted period?
The STR segment is estimated to hold the largest market share and grow at the highest rate during the forecast period. .
To speak to our analyst for a discussion on the above findings, click Speak to Analyst

TABLE OF CONTENTS
1 INTRODUCTION (Page No. - 16)
1.1 STUDY OBJECTIVES
1.2 MARKET DEFINITION AND SCOPE
1.2.1 INCLUSIONS AND EXCLUSIONS
1.3 MARKET SCOPE
1.3.1 MARKETS COVERED
1.3.2 REGIONAL SCOPE
1.3.3 YEARS CONSIDERED
1.4 CURRENCY CONSIDERED
1.5 LIMITATIONS
1.6 STAKEHOLDERS
2 RESEARCH METHODOLOGY (Page No. - 20)
2.1 RESEARCH DATA
2.2 DATA TRIANGULATION
2.2.1 SECONDARY DATA
2.2.1.1 Key data from secondary sources
2.2.2 PRIMARY DATA
2.2.2.1 Key data from primary sources
2.2.2.2 Breakdown of primaries
2.3 MARKET SIZE ESTIMATION
2.3.1 BOTTOM-UP APPROACH
2.3.2 TOP-DOWN APPROACH
2.3.3 DEMAND-SIDE METRICS
2.3.3.1 Assumptions
2.3.4 SUPPLY-SIDE ANALYSIS
2.3.4.1 Assumptions and calculations
2.3.5 FORECAST
3 EXECUTIVE SUMMARY (Page No. - 30)
4 PREMIUM INSIGHTS (Page No. - 33)
4.1 ATTRACTIVE OPPORTUNITIES FOR PLAYERS IN BLUE HYDROGEN MARKET
4.2 BLUE HYDROGEN MARKET, BY REGION
4.3 MARKET IN NORTH AMERICA, BY END-USER AND COUNTRY
4.4 MARKET, BY TECHNOLOGY
4.5 MARKET, BY END-USER
5 MARKET OVERVIEW (Page No. - 37)
5.1 INTRODUCTION
5.2 MARKET DYNAMICS
5.2.1 DRIVERS
5.2.1.1 Increasing regulations concerning GHG emissions
5.2.1.2 Rising applications of hydrogen in FCEVs
5.2.2 RESTRAINTS
5.2.2.1 Energy loss during hydrogen production
5.2.3 OPPORTUNITIES
5.2.3.1 Increasing number of government initiatives concerning development of hydrogen-based economies
5.2.3.2 Rising focus of governments on achieving net zero emission targets by 2050
5.2.4 CHALLENGES
5.2.4.1 Integration of hydrogen into natural gas networks
5.3 TRENDS/DISRUPTIONS IMPACTING CUSTOMER BUSINESS
5.3.1 REVENUE SHIFT AND NEW REVENUE POCKETS FOR CUSTOMERS
5.4 TRADE ANALYSIS
5.4.1 EXPORT SCENARIO
5.4.2 IMPORT SCENARIO
5.5 PRICING ANALYSIS
5.5.1 INDICATIVE PRICING ANALYSIS, BY TECHNOLOGY
5.6 TECHNOLOGY ANALYSIS
5.7 KEY CONFERENCES AND EVENTS, 2022–2023
5.8 SUPPLY CHAIN ANALYSIS
5.9 MARKET MAP/ECOSYSTEM
5.10 INNOVATIONS AND PATENT REGISTRATIONS
5.10.1 LIST OF MAJOR PATENTS
5.11 TARIFFS AND REGULATORY FRAMEWORK
5.11.1 REGULATORY BODIES, GOVERNMENT AGENCIES, AND OTHER ORGANIZATIONS
5.11.2 BLUE HYDROGEN MARKET: REGULATORY FRAMEWORK
5.12 PORTER’S FIVE FORCES ANALYSIS
5.12.1 THREAT OF NEW ENTRANTS
5.12.2 BARGAINING POWER OF SUPPLIERS
5.12.3 BARGAINING POWER OF BUYERS
5.12.4 THREAT OF SUBSTITUTES
5.12.5 INTENSITY OF COMPETITIVE RIVALRY
5.13 KEY STAKEHOLDERS AND BUYING CRITERIA
5.13.1 KEY STAKEHOLDERS IN BUYING PROCESS
5.13.2 BUYING CRITERIA
6 BLUE HYDROGEN MARKET, BY TECHNOLOGY (Page No. - 58)
6.1 INTRODUCTION
6.2 STEAM METHANE REFORMING
6.2.1 RISING ADOPTION OF SMR TECHNOLOGY IN CHEMICAL INDUSTRY AND PETROLEUM REFINERY
6.3 AUTO THERMAL REFORMING
6.3.1 INCREASING DEMAND FOR SYNTHESIS GASES, ESPECIALLY IN POWER GENERATION
6.4 GAS PARTIAL OXIDATION
6.4.1 GROWING USE OF GAS PARTIAL OXIDATION TECHNOLOGY IN ENERGY TRANSITION INDUSTRY
7 HYDROGEN GENERATION MARKET, BY END-USER (Page No. - 61)
7.1 INTRODUCTION
7.2 PETROLEUM REFINERY
7.2.1 GROWING DEMAND FOR HYDROGEN TO REDUCE SULFUR CONTENTS AND OTHER CONTAMINANTS
7.3 CHEMICAL INDUSTRY
7.3.1 RISING DEMAND FOR AMMONIA USED IN FERTILIZERS AND POWER GENERATION
7.4 POWER GENERATION
7.4.1 INCREASING INSTALLATIONS OF HYDROGEN FUEL CELLS
7.5 OTHERS
8 GEOGRAPHIC ANALYSIS (Page No. - 66)
8.1 INTRODUCTION
8.2 NORTH AMERICA
8.2.1 BY END-USER
8.2.2 BY COUNTRY
8.2.2.1 US
8.2.2.1.1 Rising demand for hydrogen in petroleum refineries and fertilizer production
8.2.2.2 Canada
8.2.2.2.1 Growing focus on developing sustainable hydrogen economy
8.3 EUROPE
8.3.1 BY END-USER
8.3.2 BY COUNTRY
8.3.2.1 UK
8.3.2.1.1 Increasing focus on reducing natural gas imports
8.3.2.2 France
8.3.2.2.1 Rising investments in renewable energy generation
8.3.2.3 Netherlands
8.3.2.3.1 Dependence on fossil fuels and growing ammonia consumption
8.3.2.4 Norway
8.3.2.4.1 Significant presence of gas fields to provide lucrative growth opportunities
8.3.2.5 Rest of Europe
8.4 ASIA PACIFIC
8.4.1 BY END-USER
8.4.2 BY COUNTRY
8.4.2.1 Japan
8.4.2.1.1 Increasing demand for hydrogen fuel cell-based vehicles
8.4.2.2 China
8.4.2.2.1 Rising hydrogen demand for ammonia production
8.4.2.3 India
8.4.2.3.1 Growing demand for hydrogen to increase refining capacities
8.4.2.4 Australia
8.4.2.4.1 Surging investments in hydrogen generation projects
8.4.2.5 South Korea
8.4.2.5.1 Implementation of mandates to decarbonize energy sector
8.4.2.6 New Zealand
8.4.2.6.1 Upcoming projects, coupled with government initiatives to drive demand
8.4.2.7 Rest of Asia Pacific
8.5 ROW
8.5.1 BY END-USER
8.5.2 BY COUNTRY
8.5.2.1 UAE
8.5.2.1.1 Increasing use of hydrogen fuel for electricity generation
8.5.2.2 Saudi Arabia
8.5.2.2.1 Rising export of ammonia in gulf region
8.5.2.3 Oman
8.5.2.3.1 Surging foreign investments in ammonia production
8.5.2.4 Botswana
8.5.2.4.1 Growing demand for refined petroleum products
8.5.2.5 Brazil
8.5.2.5.1 Increasing demand for clean hydrogen in transportation sector
9 COMPETITIVE LANDSCAPE (Page No. - 89)
9.1 OVERVIEW
9.2 SHARE ANALYSIS OF KEY PLAYERS, 2021
9.3 MARKET EVALUATION FRAMEWORK
9.4 SEGMENTAL REVENUE ANALYSIS OF TOP MARKET PLAYERS, 2017–2021
9.5 RECENT DEVELOPMENTS
9.5.1 DEALS
9.5.2 OTHERS
9.6 COMPETITIVE LEADERSHIP MAPPING
9.6.1 STARS
9.6.2 EMERGING LEADERS
9.6.3 PERVASIVE PLAYERS
9.6.4 PARTICIPANTS
10 COMPANY PROFILES (Page No. - 101)
10.1 KEY COMPANIES
10.1.1 DASTUR ENERGY
10.1.1.1 Business overview
10.1.1.2 Products/Services offered
10.1.1.3 Recent developments
10.1.1.4 MnM view
10.1.1.4.1 Right to win
10.1.1.4.2 Strategic choices made
10.1.1.4.3 Weaknesses and competitive threats
10.1.2 SHELL PLC
10.1.2.1 Business overview
10.1.2.2 Products/Services offered
10.1.2.3 Recent developments
10.1.2.4 MnM view
10.1.2.4.1 Right to win
10.1.2.4.2 Strategic choices made
10.1.2.4.3 Weaknesses and competitive threats
10.1.3 LINDE PLC
10.1.3.1 Business overview
10.1.3.2 Products/Services offered
10.1.3.3 Recent developments
10.1.3.4 MnM view
10.1.3.4.1 Right to win
10.1.3.4.2 Strategic choices made
10.1.3.4.3 Weaknesses and competitive threats
10.1.4 AIR PRODUCTS AND CHEMICALS INC.
10.1.4.1 Business overview
10.1.4.2 Products/Services offered
10.1.4.3 Recent developments
10.1.4.4 MnM view
10.1.4.4.1 Right to win
10.1.4.4.2 Strategic choices made
10.1.4.4.3 Weaknesses and competitive threats
10.1.5 AKER SOLUTIONS
10.1.5.1 Business overview
10.1.5.2 Products/Services offered
10.1.5.3 Recent developments
10.1.5.4 MnM view
10.1.5.4.1 Right to win
10.1.5.4.2 Strategic choices made
10.1.5.4.3 Weaknesses and competitive threats
10.1.6 EXXON MOBIL CORPORATION
10.1.6.1 Business overview
10.1.6.2 Products/Services offered
10.1.6.3 Recent developments
10.1.7 EQUINOR ASA
10.1.7.1 Business overview
10.1.7.2 Products/Services offered
10.1.7.3 Recent developments
10.1.8 UNIPER SE
10.1.8.1 Business overview
10.1.8.2 Products/Services offered
10.1.8.3 Recent developments
10.1.9 TOPSOE
10.1.9.1 Business overview
10.1.9.2 Products/Services offered
10.1.9.3 Recent developments
10.1.10 AQUATERRA ENERGY LIMITED
10.1.10.1 Business overview
10.1.10.2 Products/Services offered
10.1.11 PETROFAC LIMITED
10.1.11.1 Business overview
10.1.11.2 Products/Services offered
10.1.12 BP P.L.C.
10.1.12.1 Business overview
10.1.12.2 Products/Services offered
10.1.12.3 Recent developments
10.1.13 ENI
10.1.13.1 Business overview
10.1.13.2 Products/Services offered
10.1.13.3 Recent developments
10.1.14 JOHNSON MATTHEY
10.1.14.1 Business overview
10.1.14.2 Products/Services offered
10.1.14.3 Recent developments
10.1.15 TECHNIP ENERGIES N.V.
10.1.15.1 Business overview
10.1.15.2 Products/Services offered
10.1.15.3 Recent developments
10.2 OTHER PLAYERS
10.2.1 ENGIE
10.2.2 THYSSENKRUPP AG
10.2.3 INEOS
10.2.4 THE STATE ATOMIC ENERGY CORPORATION
10.2.5 XEBEC ADSORPTION INC.
11 APPENDIX (Page No. - 145)
11.1 INSIGHTS OF INDUSTRY EXPERTS
11.2 DISCUSSION GUIDE
11.3 KNOWLEDGESTORE: MARKETSANDMARKETS’ SUBSCRIPTION PORTAL
11.4 CUSTOMIZATION OPTIONS
11.5 RELATED REPORTS
11.6 AUTHOR DETAILS
LIST OF TABLES (98 Tables)
TABLE 1 BLUE HYDROGEN MARKET: SNAPSHOT
TABLE 2 POLICIES IMPLEMENTED BY MAJOR ECONOMIES TO BOOST HYDROGEN DEMAND
TABLE 3 EXPORT SCENARIO FOR HS CODE: 280410, BY COUNTRY, 2019–2021 (USD)
TABLE 4 IMPORT SCENARIO FOR HS CODE: 280410, BY COUNTRY, 2019–2021 (USD)
TABLE 5 MARKET: DETAILED LIST OF CONFERENCES AND EVENTS
TABLE 6 BLUE HYDROGEN MARKET: ECOSYSTEM
TABLE 7 MARKET: INNOVATIONS AND PATENT REGISTRATIONS
TABLE 8 NORTH AMERICA: LIST OF REGULATORY BODIES, GOVERNMENT AGENCIES, AND OTHER ORGANIZATIONS
TABLE 9 EUROPE: LIST OF REGULATORY BODIES, GOVERNMENT AGENCIES, AND OTHER ORGANIZATIONS
TABLE 10 ASIA PACIFIC: LIST OF REGULATORY BODIES, GOVERNMENT AGENCIES, AND OTHER ORGANIZATIONS
TABLE 11 REGULATORY FRAMEWORK: MARKET, BY REGION
TABLE 12 MARKET: PORTER’S FIVE FORCES ANALYSIS
TABLE 13 INFLUENCE OF STAKEHOLDERS ON BUYING PROCESS, BY END-USER
TABLE 14 KEY BUYING CRITERIA, BY END-USER
TABLE 15 BLUE HYDROGEN MARKET, BY TECHNOLOGY, 2020–2030 (USD MILLION)
TABLE 16 MARKET, BY TECHNOLOGY, 2020–2030 (THOUSAND METRIC TONS)
TABLE 17 MARKET, BY END-USER, 2020–2030 (USD MILLION)
TABLE 18 MARKET, BY END-USER, 2020–2030 (THOUSAND METRIC TONS)
TABLE 19 PETROLEUM REFINERY: BLUE HYDROGEN MARKET, BY REGION, 2020–2030 (USD MILLION)
TABLE 20 CHEMICAL INDUSTRY: MARKET, BY REGION, 2020–2030 (USD MILLION)
TABLE 21 POWER GENERATION: MARKET, BY REGION, 2020–2030 (USD MILLION)
TABLE 22 OTHERS: MARKET, BY REGION, 2020–2030 (USD MILLION)
TABLE 23 BLUE HYDROGEN MARKET, BY REGION, 2020–2030 (THOUSAND METRIC TONS)
TABLE 24 MARKET, BY REGION, 2020–2030 (USD MILLION)
TABLE 25 NORTH AMERICA: MARKET, BY END-USER, 2020–2030 (USD MILLION)
TABLE 26 NORTH AMERICA: MARKET, BY COUNTRY, 2020–2030 (THOUSAND METRIC TONS)
TABLE 27 NORTH AMERICA: MARKET, BY COUNTRY, 2020–2030 (USD MILLION)
TABLE 28 US: MARKET, BY END-USER, 2020–2030 (USD MILLION)
TABLE 29 CANADA: MARKET, BY END-USER, 2020–2030 (USD MILLION)
TABLE 30 EUROPE: BLUE HYDROGEN MARKET, BY END-USER, 2020–2030 (USD MILLION)
TABLE 31 EUROPE: MARKET, BY COUNTRY, 2020–2030 (THOUSAND METRIC TONS)
TABLE 32 EUROPE: MARKET, BY COUNTRY, 2020–2030 (USD MILLION)
TABLE 33 UK: MARKET, BY END-USER, 2020–2030 (USD MILLION)
TABLE 34 FRANCE: MARKET, BY END-USER, 2020–2030 (USD MILLION)
TABLE 35 NETHERLANDS: MARKET, BY END-USER, 2020–2030 (USD MILLION)
TABLE 36 NORWAY: MARKET, BY END-USER, 2020–2030 (USD MILLION)
TABLE 37 REST OF EUROPE: MARKET, BY END-USER, 2020–2030 (USD MILLION)
TABLE 38 ASIA PACIFIC: BLUE HYDROGEN MARKET, BY END-USER, 2020–2030 (USD MILLION)
TABLE 39 ASIA PACIFIC: MARKET, BY COUNTRY, 2020–2030 (THOUSAND METRIC TONS)
TABLE 40 ASIA PACIFIC: MARKET, BY COUNTRY, 2020–2030 (USD MILLION)
TABLE 41 JAPAN: MARKET, BY END-USER, 2020–2030 (USD MILLION)
TABLE 42 CHINA: MARKET, BY END-USER, 2020–2030 (USD MILLION)
TABLE 43 INDIA: MARKET, BY END-USER, 2020–2030 (USD MILLION)
TABLE 44 AUSTRALIA: MARKET, BY END-USER, 2020–2030 (USD MILLION)
TABLE 45 SOUTH KOREA: MARKET, BY END-USER, 2020–2030 (USD MILLION)
TABLE 46 NEW ZEALAND: MARKET, BY END-USER, 2020–2030 (USD MILLION)
TABLE 47 REST OF ASIA PACIFIC: MARKET, BY END-USER, 2020–2030 (USD MILLION)
TABLE 48 ROW: MARKET, BY END-USER, 2020–2030 (USD MILLION)
TABLE 49 ROW: MARKET, BY COUNTRY, 2020–2030 (THOUSAND METRIC TONS)
TABLE 50 ROW: MARKET, BY COUNTRY, 2020–2030 (USD MILLION)
TABLE 51 UAE: MARKET, BY END-USER, 2020–2030 (USD MILLION)
TABLE 52 SAUDI ARABIA: BLUE HYDROGEN MARKET, BY END-USER, 2020–2030 (USD MILLION)
TABLE 53 OMAN: MARKET, BY END-USER, 2020–2030 (USD MILLION)
TABLE 54 BOTSWANA: MARKET, BY END-USER, 2020–2030 (USD MILLION)
TABLE 55 BRAZIL: BLUE HYDROGEN MARKET, BY END-USER, 2020–2030 (USD MILLION)
TABLE 56 KEY DEVELOPMENTS IN BLUE HYDROGEN MARKET, 2017 TO 2022
TABLE 57 MARKET: DEGREE OF COMPETITION
TABLE 58 MARKET EVALUATION FRAMEWORK, 2017–2021
TABLE 59 MARKET: DEALS, APRIL 2019–JUNE 2022
TABLE 60 MARKET: NEW PRODUCT LAUNCHES, NOVEMBER 2020–
TABLE 61 95
TABLE 62 MARKET: OTHERS, SEPTEMBER 2021–AUGUST 2022
TABLE 63 COMPANY TECHNOLOGY FOOTPRINT
TABLE 64 COMPANY END-USER FOOTPRINT
TABLE 65 COMPANY REGION FOOTPRINT
TABLE 66 DASTUR ENERGY: BUSINESS OVERVIEW
TABLE 67 DASTUR ENERGY: DEALS
TABLE 68 SHELL PLC: BUSINESS OVERVIEW
TABLE 69 SHELL PLC: DEALS
TABLE 70 SHELL PLC: NEW PRODUCT LAUNCHES
TABLE 71 SHELL PLC: OTHERS
TABLE 72 LINDE PLC: BUSINESS OVERVIEW
TABLE 73 LINDE PLC: OTHERS
TABLE 74 AIR PRODUCTS AND CHEMICALS INC.: BUSINESS OVERVIEW
TABLE 75 AIR PRODUCTS AND CHEMICALS, INC.: DEALS
TABLE 76 AIR PRODUCTS AND CHEMICALS, INC.: OTHERS
TABLE 77 AKER SOLUTIONS: BUSINESS OVERVIEW
TABLE 78 AKER SOLUTIONS: DEALS
TABLE 79 EXXON MOBIL CORPORATION: BUSINESS OVERVIEW
TABLE 80 EXXON MOBIL CORPORATION: DEALS
TABLE 81 EQUINOR ASA: BUSINESS OVERVIEW
TABLE 82 EQUINOR ASA: DEALS
TABLE 83 UNIPER SE: BUSINESS OVERVIEW
TABLE 84 UNIPER SE: DEALS
TABLE 85 TOPSOE: BUSINESS OVERVIEW
TABLE 86 TOPSOE: DEALS
TABLE 87 AQUATERRA ENERGY LIMITED: BUSINESS OVERVIEW
TABLE 88 PETROFAC LIMITED: BUSINESS OVERVIEW
TABLE 89 BP P.L.C: BUSINESS OVERVIEW
TABLE 90 BP P.L.C.: DEALS
TABLE 91 ENI: BUSINESS OVERVIEW
TABLE 92 ENI: DEALS
TABLE 93 JOHNSON MATTHEY: BUSINESS OVERVIEW
TABLE 94 JOHNSON MATTHEY: PRODUCT LAUNCHES
TABLE 95 JOHNSON MATTHEY: DEALS
TABLE 96 TECHNIP ENERGIES N.V.: BUSINESS OVERVIEW
TABLE 97 TECHNIP ENERGIES N.V.: PRODUCT LAUNCHES
TABLE 98 TECHNIP ENERGIES N.V.: DEALS
LIST OF FIGURES (48 Figures)
FIGURE 1 BLUE HYDROGEN MARKET: RESEARCH DESIGN
FIGURE 2 DATA TRIANGULATION METHODOLOGY
FIGURE 3 BREAKDOWN OF PRIMARIES: BY COMPANY, DESIGNATION, AND REGION
FIGURE 4 MARKET: BOTTOM-UP APPROACH
FIGURE 5 MARKET: TOP-DOWN APPROACH
FIGURE 6 MARKET: DEMAND-SIDE ANALYSIS
FIGURE 7 KEY METRICS CONSIDERED FOR ASSESSING SUPPLY OF BLUE HYDROGEN SOLUTIONS
FIGURE 8 MARKET: SUPPLY-SIDE ANALYSIS
FIGURE 9 COMPANY REVENUE ANALYSIS, 2021
FIGURE 10 NORTH AMERICA HELD LARGEST SHARE OF MARKET IN 2021
FIGURE 11 STEAM METHANE REFORMING TECHNOLOGY TO LEAD MARKET, BY TECHNOLOGY, DURING FORECAST PERIOD
FIGURE 12 PETROLEUM REFINERY SEGMENT TO CONTINUE TO HOLD LARGEST MARKET SHARE, BY END-USER, DURING FORECAST PERIOD
FIGURE 13 GROWING NEED TO REDUCE GREENHOUSE GAS EMISSIONS FROM HYDROGEN PRODUCTION PROCESSES
FIGURE 14 BLUE HYDROGEN MARKET IN EUROPE TO EXHIBIT HIGHEST CAGR DURING FORECAST PERIOD
FIGURE 15 PETROLEUM REFINERY AND CANADA DOMINATED NORTH AMERICAN MARKET IN 2021
FIGURE 16 STEAM METHANE REFORMING ACCOUNTED FOR LARGEST MARKET SHARE IN 2021
FIGURE 17 PETROLEUM REFINERY SEGMENT HELD LARGEST MARKET SHARE IN 2021
FIGURE 18 BLUE HYDROGEN MARKET: MARKET DYNAMICS
FIGURE 19 GLOBAL GREENHOUSE GAS EMISSIONS, BY SECTOR, 2021
FIGURE 20 FUEL CELL ELECTRIC VEHICLE STOCK, BY REGION, 2017–2021
FIGURE 21 CUMULATIVE EMISSION REDUCTION, BY MITIGATION MEASURE IN NET ZERO EMISSION, 2021–2030
FIGURE 22 INTEGRATION OF LOW-CARBON HYDROGEN INTO GAS NETWORKS, 2018–2021
FIGURE 23 REVENUE SHIFT FOR HYDROGEN ENERGY STORAGE PROVIDERS
FIGURE 24 REVENUE SHIFT FOR HYDROGEN ENERGY STORAGE PROVIDERS
FIGURE 25 MARKET: SUPPLY CHAIN ANALYSIS
FIGURE 26 MARKET: PORTER’S FIVE FORCES ANALYSIS
FIGURE 27 INFLUENCE OF STAKEHOLDERS ON BUYING PROCESS, BY END-USER
FIGURE 28 BUYING CRITERIA FOR TOP THREE END-USERS
FIGURE 29 MARKET, BY TECHNOLOGY, 2021
FIGURE 30 MARKET, BY END-USER, 2021
FIGURE 31 EUROPEAN MARKET TO EXHIBIT HIGHEST GROWTH DURING FORECAST PERIOD
FIGURE 32 MARKET SHARE, BY REGION, 2021 (VALUE)
FIGURE 33 NORTH AMERICA: BLUE HYDROGEN MARKET SNAPSHOT
FIGURE 34 EUROPE: MARKET SNAPSHOT
FIGURE 35 SHARE ANALYSIS OF TOP PLAYERS IN MARKET, 2021
FIGURE 36 TOP PLAYERS DOMINATED MARKET IN LAST FIVE YEARS
FIGURE 37 MARKET: COMPETITIVE LEADERSHIP MAPPING, 2021
FIGURE 38 SHELL PLC: COMPANY SNAPSHOT
FIGURE 39 LINDE PLC: COMPANY SNAPSHOT
FIGURE 40 AIR PRODUCTS AND CHEMICALS, INC.: COMPANY SNAPSHOT
FIGURE 41 AKER SOLUTIONS: COMPANY SNAPSHOT
FIGURE 42 EXXON MOBIL CORPORATION: COMPANY SNAPSHOT
FIGURE 43 EQUINOR ASA: COMPANY SNAPSHOT
FIGURE 44 UNIPER SE: COMPANY SNAPSHOT
FIGURE 45 PETROFAC LIMITED: COMPANY SNAPSHOT
FIGURE 46 BP P.L.C.: COMPANY SNAPSHOT
FIGURE 47 ENI: COMPANY SNAPSHOT
FIGURE 48 TECHNIP ENERGIES N.V.: COMPANY SNAPSHOT
This study involved four major activities in estimating the current size of the blue hydrogen market. Exhaustive secondary research was done to collect information on the market, the peer market, and the parent market. The next step was to validate these findings, assumptions, and market sizing with industry experts across the value chain through rigorous primary research. Both top-down and bottom-up approaches were used to estimate the total market size. The market breakdown and data triangulation techniques were employed to estimate the market size of the segments and the corresponding subsegments.
Secondary Research
We have extensively used secondary sources, directories, and databases such as water and wastewater management data, industry publications, several newspaper articles, Statista Industry Journal, Factiva, and water & environment journal to identify and collect information useful for a technical, market-oriented, and commercial study of the market. The other secondary sources included annual reports, press releases & investor presentations of companies, white papers, certified publications, articles by recognized authors, manufacturer associations, trade directories, and databases.
Primary Research
The blue hydrogen market comprises several stakeholders, such as companies related to the industry, component manufacturing companies for government & research organizations, organizations, forums, alliances & associations, hydrogen providers, state & national energy authorities, dealers & suppliers, and vendors. The demand side of the market is characterized by increased investment in the residential, commercial, and industrial sectors. The supply side is characterized by investments & expansion and partnerships & collaborations among big players. Various primary sources from both the supply and demand sides of the market were interviewed to obtain qualitative and quantitative information. The breakdown of primary respondents is given below.
To know about the assumptions considered for the study, download the pdf brochure
Market Size Estimation
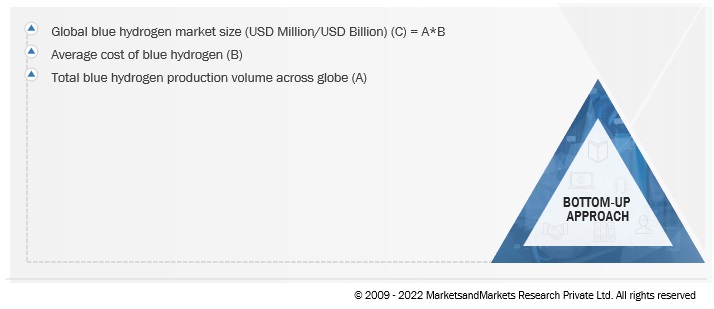
Both top-down and bottom-up approaches have been used to estimate and validate the size of the global blue hydrogen market and its dependent submarkets. These methods were also extensively used to estimate the size of various subsegments in the market. The research methodology used to estimate the market size includes the following:
- The key players in the industry and market have been identified through extensive secondary research, and their market shares in the respective regions have been determined through both primary and secondary research.
- In terms of value, the industry’s supply chain and market size have been determined through primary and secondary research processes.
- All percentage shares, splits, and breakdowns have been determined using secondary sources and verified through primary sources.
Global Blue hydrogen Market Size: Bottom-Up Approach
To know about the assumptions considered for the study, Request for Free Sample Report
Data Triangulation
After arriving at the overall market size—using the market size estimation processes as explained above—the market was split into several segments and subsegments. Data triangulation and market breakdown procedures were employed, wherever applicable to complete the entire market engineering process and arrive at the exact statistics of each market segment and subsegment. The data was triangulated by studying various factors and trends from both the demand and supply sides in the market.
Objectives of the Study
- To forecast and describe the blue hydrogen market size, by technology, end user, and region, in terms of value and volume
- To provide detailed information regarding the major drivers, restraints, opportunities, and challenges influencing the growth of the market
- To estimate the size of the market in terms of value and volume
- To strategically analyze micromarkets with respect to individual growth trends, prospects, future expansions, and contributions to the overall market
- To forecast the growth of the blue hydrogen market with respect to major regions, namely, North America, Europe, Asia Pacific, and RoW.
- To analyze market opportunities for stakeholders and the competitive landscape for market leaders
- To strategically profile key players and comprehensively analyze their respective market shares and core competencies
- To analyze competitive developments such as investments & expansions, mergers & acquisitions, product launches, contracts & agreements, and joint ventures & collaborations in the market
Customization Options:
With the given market data, MarketsandMarkets offers customizations according to your specific needs. The following customization options are available for the report:
Company Information
- Product Matrix, which provides a detailed comparison of the product portfolio of each company
Company Information
- Detailed analysis and profiling of additional market players


 Generating Response ...



Growth opportunities and latent adjacency in Blue Hydrogen Market