CNG, RNG, and Hydrogen Tanks Market by Gas Type (CNG, RNG, Hydrogen), Material Type (Metal, Carbon Fiber, Glass Fiber), Tank Type (Type 1, Type 2, Type 3, Type 4), Application (Fuel, Transportation), and Region - Global Forecasts to 2030


The global CNG, RNG, and hydrogen tanks market size is expected to be USD 2.5 billion in 2022, and grow at a CAGR of 10.7% during the forecasted period. There is an intense effort to switch from fossil fuels to cleaner, more sustainable energy sources as concerns over climate change and air pollution continue to rise due to which the demand for alternative fuel vehicles, such as CNG, RNG, and hydrogen fuels, is also about to increase. The coming demand from the automotive industry due to the stringent environmental regulations and the concern about the environment to boost the market of CNG, RNG and hydrogen tanks in forecasted period.
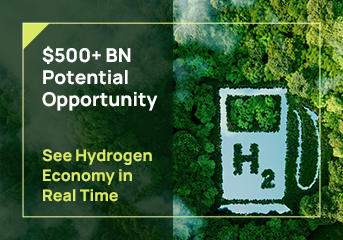
Attractive Opportunities in the CNG, RNG, and Hydrogen Tanks Market

To know about the assumptions considered for the study, Request for Free Sample Report

Global CNG, RNG, and hydrogen tanks market Dynamics:
Drivers: Increasing tax incentives for CNG vehicles and infrastructure
In areas like North America and Asia Pacific, tax incentives have been improved and expanded. As an illustration, in May 2019, legislation pertaining to tax credits for Compressed Natural Gas (CNG) vehicles and refueling was updated and passed by the US government, in particular the state of Oklahoma. The tax credit now lasts through December 31, 2027, instead of just January 1, 2020. With this action, Oklahoma will continue to play a leading role in promoting natural gas as the preferred fuel for automobiles. As a result, the company's goods are anticipated to see a growth in demand while promoting cleaner air thanks to their focus on high-mileage and high-emission automobiles. The state and its residents benefit economically from the tax perks as well. Additionally, the Indian Oil Ministry lowered the Goods and Services Tax (GST) on CNG vehicles from 28% to 5% in December 2019. This action inadvertently increased the appeal of gas cars in India. Since natural gas produces 25% less carbon dioxide (CO2) per unit of energy produced compared to gasoline, countries are primarily motivated to offer these enhanced tax incentives to reduce CO2 emissions. The demand for CNG tanks and related items has increased as a result.
Restraints: High cost of composite material tanks and regulatory approvals
Strong competition is a hallmark of the composites market and the end-use industries it serves, where commercial considerations are key factors in decision-making. Operating expense (OPEX) and capital expenditure (CAPEX) are the two main commercial considerations. However, establishing economies of scale is difficult because of the high cost of raw materials and the high manufacturing cost. As a result, there is a high demand in the market for composites for cost-efficient design and production technology. Potential market participants are discouraged from entering the business because carbon fiber and glass fiber, two essential materials for Type 3 and Type 4 CNG composite tanks, demand a significant capital investment. The high cost of these raw materials directly affects how much Type 3 and Type 4 CNG composite tanks cost to make overall. Finding low-cost methods of creating carbon and glass fiber composites thus becomes a major problem for producers all over the world.
Manufacturers must obtain approval for their composite cylinder types from regulatory bodies or independent inspection authorities. Adhering to safety standards is essential to prevent accidents and ensure the protection of human life and property. Instances of blast accidents are often linked to the use of substandard CNG cylinders and kits in vehicles, potentially hindering demand and restricting the growth of the CNG, RNG, and hydrogen tanks market. These factors may ultimately impact the overall market for CNG, RNG, and hydrogen tanks.
Opportunities: Development of low-weight transportation tanks
As both use electric motors to move the wheels, hydrogen-powered vehicles and electric cars have certain similarities. The main contrast, though, is in how they store their energy. While hydrogen cars store electricity in the form of hydrogen that is then turned into electrical power using a fuel cell, electric cars rely on traditional batteries. At the moment, the price of storage tanks for hydrogen automobiles is still high, which makes their widespread adoption difficult. The cost of these tanks, which range from USD 4,000 to 4,500 for a 5-kg capacity, dramatically raises the price of the entire car. Current research is focused on creating lightweight Class 4-cylinder carbon fiber tanks that minimize costs by lowering gas storage pressure in order to address this issue. The Luxfer Group (UK), lljin (South Korea), Quantum Fuel System Technologies (US), and Hexagon Lincoln (US) are well-known producers of hydrogen storage tanks for automobiles.
Challenges: Already well-established infrastructure for electric cars
Hydrogen-powered vehicles have become more popular in nations like South Korea and Japan, in part because of government subsidies and funding for infrastructure expansion. California in the US also provides incentives for vehicles fueled by fuel cells. Despite the fact that creating hydrogen from natural gas is considered a sustainable technology, some experts contend that since electric automobiles rely on batteries rather than fossil fuels, they are more environmentally friendly than hydrogen-powered vehicles. However, initiatives are being made to generate hydrogen using sustainable resources. Due to their three times worse energy efficiency, lower volumetric efficiency, and higher weight than electric vehicles, hydrogen-powered vehicles have some disadvantages. Insufficient refueling infrastructure also hinders market expansion. Electric vehicles may take the role of hydrogen vehicles if global hydrogen technology does not progress significantly. In anticipation, companies like Toyota, Hyundai, and Honda are already considering developing electric vehicles alongside hydrogen-powered ones.
CNG, RNG and Hydrogen tanks market: Ecosystem

CNG tanks to account for the largest market share, in terms of value and volume
The CNG gas segment held the dominant position in the CNG, RNG, and hydrogen tanks market in both value and volume terms. This was primarily due to increasing awareness and preference for CNG gas compared to other options. Moreover, CNG is considered less hazardous for fuel and transportation tanks when compared to hydrogen gas. However, the market size of the gas type segment witnessed a decline in 2020, both in terms of value and volume, attributed to the recession in 2020. Despite of the recession, it is anticipated that the hydrogen gas segment will exhibit the highest growth rate in terms of volume after 2021, throughout the forecast period.
Metal accounted for the largest share in terms of value and volume
In 2022, the metal material market dominated the CNG, RNG, and hydrogen tanks market both in terms of value and volume. This is because the technology for manufacturing metal-based tanks is well-established and relatively cost-effective compared to glass and carbon fiber-based alternatives. Metal-based tanks also boast numerous advantages, including exceptional durability, high stiffness, remarkable toughness, and resistance to fatigue. Although, Carbon fiber based tanks are expected to witness the maximum growth in the forecasted period.
Type 4 tanks are expected to grow with the highest growth rate
Type 1 tank type dominated the market in 2022, due to well-established and relatively cost-effective manufacturing process and technology. But, Type 4 tank type is expected to grow with the maximum CAGR of 16.7% in terms of value during the forecasted period. This growth rate is attributed to a combination of their lightweight construction, safety features, large storage capacity, and technical developments.
Asia Pacific holds the maximum share along with the maximum CAGR in terms of volume
Asia Pacific held the leading position in the global CNG, RNG, and hydrogen tanks market, primarily driven by the substantial demand for CNG tanks. The Asia Pacific region boasts well-established CNG tank manufacturing technology and infrastructure, surpassing that of hydrogen and RNG. Notably, the number of CNG vehicles in countries like China, India, Pakistan, and Thailand has been witnessing remarkable growth, supported by government incentives and favorable policies.

To know about the assumptions considered for the study, download the pdf brochure
Rising environmental awareness increases natural gas demand
Strict environmental regulations are a significant driver for the growing demand for CNG vehicles worldwide. While gasoline, diesel, and petroleum products have harmful environmental impacts, natural gas is considered a more sustainable alternative, reducing carbon emissions, slowing down global warming, and minimizing greenhouse gas (GHG) emissions. According to the U.S. Environmental Protection Agency (EPA), CNG vehicles can reduce greenhouse gas emissions by up to 25%. To promote the usage of natural gas as a cleaner fuel and mitigate the risks associated with gasoline and diesel, the US government has established various environmental conservation rules and regulations. Countries with substantial natural gas reserves are recognizing the advantages of using CNG as an alternative fuel due to its lower CO2 emissions compared to petrol or diesel.
Moreover, stricter environmental regulations that mandate the use of cleaner, low-emission fuels, and stringent engine manufacturer specifications are expected to further drive the demand for hydrogen gas during the forecast period. For instance, the European Commission has introduced Euro VIl standards, aiming to reduce NOx emissions by 4% for cars and 2% for vans and trucks by 2030. Similarly, India plans to reduce carbon emissions by 1 billion tons by 2030, emphasizing the significance of cleaner fuel options.
Key Market Players
The key players in the global composites market are:
- - Worthington Industries, Inc. (US)
- - Faber Industrie SpA (Italy)
- -Luxfer Group (UK)
- - Hexagon Composites ASA (Norway)
- - Everest Kanto Cylinders Ltd. (India)
These companies are involved in adopting various inorganic and organic strategies to increase their foothold in the composites industry. The study includes an in-depth competitive analysis of these key players in the CNG, RNG, and hydrogen tanks market, with their company profiles, recent developments, and key market strategies.
Scope of the Report
|
Report Metric |
Details |
|
Market size available for years |
2018–2030 |
|
Base year considered |
2022 |
|
Forecast period |
2023–2030 |
|
Units considered |
Value (USD Million/Billion), Volume (Units) |
|
Segments Covered |
By Material Type, By Tank Type, By Gas Type, By Application, and By Region |
|
Geographies covered |
Europe, North America, Asia Pacific, Latin America, the Middle East, and Africa |
|
Companies covered |
Worthington Industries, Inc. (US), Luxfer Group (UK), Hexagon Composites ASA (Norway), Quantum Fuel Systems LLC. (US), Everest Kanto Cylinders Ltd. (India), Praxair Technologies Inc. (US), Avanco Group (Germany), Xinyi Beijing Tianhai Industry Co. Ltd. (China), Lianyungang Zhongfu Lianzhong Composites Group Co. Ltd. (China), Faber Industrie SpA (Italy). |
The study categorizes the CNG, RNG, and hydrogen tank market based on Precursor Type, Source, Resin Type, Manufacturing Process, End-Use Industry, and Region.
By Material Type:
- Metal
- Glass Fiber
- Carbon Fiber
By Tank Type:
- Type 1
- Type 2
- Type 3
- Type 4
By Gas Type:
- CNG
- RNG
- Hydrogen
By Application:
- Fuel Tank
- Transportation Tank
By Region:
- North America
- Asia Pacific
- Europe
- Latin America
- Middle East & Africa
Recent Developments
- In May 2023, Luxfer Group has manufactured a new type 4 cylinder. The G-Stor Go H2 features a proven boss-to-liner interface that results in minimal permeation and is a certified, cost-effective hydrogen storage solution ideal for fuel cell transit buses, heavy-duty trucks, vans, bulk gas transport, boats, and trains.
- In January 2023, Hexagon purus opens a new hydrogen cylinder manufacturing facility in westminster, maryland, usa, with the annual production of up to 10,000 cylinders for heavy-duty vehicle applications and will employ up to 150 skilled workers. The new facility expands cylinder production capabilities and capacity and allows for further expansion by adding additional production equipment as demand for hydrogen storage cylinders continues to grow.
- In February 2021, Worthington industries manufactured Thermaguard hydrogen cylinders. ThermaGuard™ hydrogen cylinders are optimized to meet the unique needs of hydrogen fuel. Meticulously developed using Worthington’s aerospace-grade standards, ThermaGuard hydrogen cylinders are proven more efficient means of transporting and storing high-pressure hydrogen gas.
- In March 2021, Luxfer Group completed the acquisition of SCI (Structural Composites Industries, which is a business u of Worthington Industries). This acquisition is aimed to enhance the capabilities of the hydrogen and CNG gas businesses of Luxfer Group.
- In January 2021, Worthington Industries, Inc. announced the acquisition of PTEC Pressure Technology GmbH. This acquisition is expected to develop the system capabilities of Worthington Industries, Inc.
Frequently Asked Questions (FAQ):
Which are the key players of CNG, RNG, and hydrogen tanks market and what are their strategies to strengthen their market presence/shares?
Some of the key players of CNG, RNG, and hydrogen tanks market are Worthington Industries, Inc. (US), Faber Industrie SpA (Italy), Luxfer Group (UK) , Hexagon Composites ASA (Norway) and Everest Kanto Cylinders Ltd. (India), among others, are the key manufacturers that secured contracts, deals in the last few years. Agreements, expansions, technological developments, contracts, and deals was the key strategies adopted by these companies to strengthen their market presence.
What are the drivers and restraints for the CNG, RNG, and hydrogen tanks market?
The growing number of natural gas vehicles, increasing environmental awareness, and government support encouraging adoption of clean fuel while high processing and manufacturing cost of composites tanks is acting as a restraint for CNG, RNG, and hydrogen composites tanks market.
Which is the fastest growing country-level market for CNG tanks market and what would be the reason of that growth?
India is the fastest-growing CNG market. To lessen pollution and minimize greenhouse gas emissions, the Indian government has been actively encouraging the use of clean and sustainable fuels. The use of CNG vehicles is encouraged through a number of incentives, subsidies, and tax advantages, which has helped to fuel the rise in demand for CNG tanks.
What is the major factor on which the final price of CNG, RNG and hydrogen tanks rely?
Price and availability of raw material along with the type of tank and manufacturing process used plays an important role in determining the costs of the CNG, RNG and hydrogen tanks.
Which region is expected to hold the highest market share?
Asia Pacific will dominate the market share in forecasted period i.e between 2023 to 2030, due to the huge demand coming from the countries like China, Japan, India and South Korea.
What is the biggest restraint in the CNG, RNG, and hydrogen tanks market?
Volatility in the prices of natural gas and lack of hydrogen and RNG infrastructure are restraining market growth for RNG and hydrogen tanks. .
To speak to our analyst for a discussion on the above findings, click Speak to Analyst
 Exclusive indicates content/data unique to MarketsandMarkets and not available with any competitors.
- 5.1 INTRODUCTION
-
5.2 MARKET DYNAMICSDRIVERS- Increasing use of natural gas in automotive industry- Increasing tax incentives for CNG and hydrogen vehicle and infrastructure- Increased demand for natural gas vehicles- Rising environmental awareness of benefits of natural gasRESTRAINTS- Limited availability of hydrogen and CNG refueling infrastructure in emerging economies- High cost of composite material tanks and regulatory approvalsOPPORTUNITIES- Emergence of lightweight composite material based CNG cylinders- Development of lightweight transportation tanksCHALLENGES- Impact of fluctuating oil prices on the CNG andRNG tanks market- Development of electric cars
-
5.3 PORTER’S FIVE FORCES ANALYSISBARGAINING POWER OF BUYERSBARGAINING POWER OF SUPPLIERSTHREAT OF NEW ENTRANTSTHREAT OF SUBSTITUTESINTENSITY OF COMPETITIVE RIVALRY
- 5.4 SUPPLY CHAIN ANALYSIS
-
5.5 PRICING ANALYSISAVERAGE SELLING PRICE, BY APPLICATION
-
5.6 KEY STAKEHOLDERS & BUYING CRITERIAKEY STAKEHOLDERS IN BUYING PROCESSBUYING CRITERIA
- 5.7 TECHNOLOGY ANALYSIS
-
5.8 ECOSYSTEM MAPPING
-
5.9 VALUE CHAIN ANALYSISRAW MATERIALSMANUFACTURINGAPPLICATIONS AND END-USE INDUSTRIES
- 5.10 CASE STUDY ANALYSIS
- 5.11 TRENDS AND DISRUPTIONS IMPACTING CUSTOMERS' BUSINESSES
-
5.12 KEY MARKETS FOR IMPORT/EXPORTCHINAITALYUSUKRAINEARMENIA
-
5.13 REGULATORY LANDSCAPEREGULATORY BODIES, GOVERNMENT AGENCIES, AND OTHER ORGANIZATIONSSTANDARDS FOR CNG, RNG, AND HYDROGEN TANKS MARKET
-
5.14 PATENT ANALYSISINTRODUCTIONMETHODOLOGYDOCUMENT TYPEINSIGHTSLEGAL STATUS OF PATENTSJURISDICTION ANALYSISANALYSIS OF TOP APPLICATNSPATENTS BY CHINA PETROLEUM & CHEM CORP.PATENTS BY SINOPEC ENGINEERING GROUP CO.TOP 10 PATENT OWNERS (US) IN LAST 10 YEARS
- 5.15 KEY CONFERENCES & EVENTS IN 2023-2024
- 6.1 INTRODUCTION
-
6.2 TYPE 1AFFORDABLE AND COST-EFFECTIVE FUEL TANK APPLICATION TO DRIVE MARKET
-
6.3 TYPE 2INCREASING DEMAND FROM TYPE 2 APPLICATIONS TO DRIVE MARKET
-
6.4 TYPE 3HIGH STRENGTH AND EXTRA IMPACT RESISTANCE QUALITIES OF TYPE 3 TO DRIVE MARKET
-
6.5 TYPE 4INCREASING DEMAND FOR LIGHT CYLINDERS TO DRIVE MARKET
- 7.1 INTRODUCTION
-
7.2 CNGINCREASING DEMAND FROM AUTOMOTIVE SECTOR TO DRIVE MARKET
-
7.3 HYDROGENHIGH MASS-ENERGY DENSITY QUALITY COMPARED TO OTHER COMBUSTIBLE FUELS TO DRIVE MARKET
-
7.4 RNGINCREASING DEMAND FOR RENEWABLE FUEL TO DRIVE MARKET
- 8.1 INTRODUCTION
-
8.2 FUEL TANKDURABLE, CHEAPER, AND LOWER CO2 EMISSION TO DRIVE MARKETLIGHT-DUTY VEHICLESMEDIUM-DUTY VEHICLESHEAVY-DUTY VEHICLES
-
8.3 TRANSPORTATION TANKWEIGHT REDUCTION QUALITIES OF TANKS TO DRIVE MARKET
- 9.1 INTRODUCTION
-
9.2 METALINCREASING DEMAND FOR CHEAP RAW MATERIAL TO DRIVE MARKET
-
9.3 GLASS FIBERINCREASING DEMAND FOR LIGHTER TRADITIONAL STEEL TO DRIVE MARKET
-
9.4 CARBON FIBERINCREASED USE OF HIGH-VALUE APPLICATIONS TO DRIVE MARKET
- 10.1 INTRODUCTION
- 10.2 NORTH AMERICA
-
10.3 RECESSION IMPACTUS- Presence of major CNG, RNG, and hydrogen tank manufacturers to drive marketCANADA- Increasing tax incentives for NGVs to drive market
-
10.4 ASIA PACIFICRECESSION IMPACT- China- Pakistan- India- Thailand- Rest of Asia Pacific
-
10.5 EUROPERECESSION IMPACT- Germany- France- UK- Spain- Italy- Russia- Sweden- Ukraine- Armenia- Bulgaria- Switzerland- Austria- Netherlands- Rest of Europe
-
10.6 MIDDLE EAST & AFRICARECESSION IMPACT- Iran- Uzbekistan- Rest of Middle East & Africa
-
10.7 LATIN AMERICARECESSION IMPACT- Brazil- Argentina- Rest of Latin America
- 11.1 OVERVIEW
- 11.2 MARKET SHARE ANALYSIS
- 11.3 MARKET RANKING
- 11.4 REVENUE ANALYSIS OF TOP PLAYERS
-
11.5 COMPANY EVALUATION MATRIXSTARSPERVASIVE PLAYERSEMERGING LEADERSPARTICIPANTS
- 11.6 MARKET EVALUATION FRAMEWORK
- 11.7 COMPETITIVE BENCHMARKING OF KEY STARTUPS/SMES
-
11.8 START-UP/ SMALL AND MEDIUM-SIZED ENTERPRISES (SME) EVALUATION MATRIXPROGRESSIVE COMPANIESRESPONSIVE COMPANIESDYNAMIC COMPANIESSTARTING BLOCKS
-
12.1 KEY PLAYERSWORTHINGTON INDUSTRIES, INC.- Business overview- Products offered- MnM viewLUXFER GROUP- Business overview- Products offered- MnM viewHEXAGON COMPOSITES ASA- Business overview- Products offered- MnM viewQUANTUM FUEL SYSTEMS LLC.- Business overview- Quantum Fuel Systems LLC.: Products offered- MnM viewEVEREST KANTO CYLINDER LTD.- Business overview- Products offered- MnM viewPRAXAIR TECHNOLOGIES INC.- Business overview- Products offered- MnM ViewAVANCO GROUP- Business overview- Products offered- MnM viewBEIJING TIANHAI INDUSTRY CO. LTD.- Business overview- Products offered- MnM viewLIANYUNGANG ZHONGFU LIANZHONG COMPOSITES GROUP CO. LTD.- Business overview- Products offered- MnM viewFABER INDUSTRIE SPA- Business overview- Products offered- MnM viewCOMPOSITES ADVANCED TECHNOLOGIES, LLC. (CATEC GASES)- Business overview- Products offered- MnM viewCIMC ENRIC- Business overview- Products offered- MnM viewLUXI NEW ENERGY EQUIPMENT GROUP CO., LTD.- Business overview- Products offered- MnM viewSINOCLEANSKY- Business overview- Products offered- MnM view
-
12.2 OTHER PLAYERSLINDE PLCULLIT SAAGILITY FUEL SOLUTIONSRAMA CYLINDERS PRIVATE LIMITEDJPM GROUPSAHUWALA CYLINDERS PVT. LTD.EURO INDIA CYLINDERS LTD.CEVOTEC GMBHNPROXXSTEELHEAD COMPOSITES, INC.JIANGSU QIULIN SPECIAL ENERGY EQUIPMENT JOINT STOCK LIMITED COMPANY
- 13.1 DISCUSSION GUIDE
- 13.2 KNOWLEDGESTORE: MARKETSANDMARKETS’ SUBSCRIPTION PORTAL
- 13.3 CUSTOMIZATION OPTIONS
- 13.4 RELATED REPORTS
- 13.5 AUTHOR DETAILS
- TABLE 1 CNG, RNG, AND HYDROGEN TANKS MARKET: PORTER’S FIVE FORCES ANALYSIS
- TABLE 2 CNG, RNG, AND HYDROGEN TANKS MARKET: COMPANIES AND THEIR ROLE IN ECOSYSTEM
- TABLE 3 AVERAGE SELLING PRICE FOR CNG, RNG, AND HYDROGEN TANKS
- TABLE 4 INFLUENCE OF STAKEHOLDERS ON BUYING PROCESS FOR TOP APPLICATIONS
- TABLE 5 KEY BUYING CRITERIA FOR TOP 2 APPLICATIONS
- TABLE 6 NORTH AMERICA: REGULATORY BODIES, GOVERNMENT AGENCIES, AND OTHER ORGANIZATIONS
- TABLE 7 EUROPE: REGULATORY BODIES, GOVERNMENT AGENCIES, AND OTHER ORGANIZATIONS
- TABLE 8 ASIA PACIFIC: REGULATORY BODIES, GOVERNMENT AGENCIES, AND OTHER ORGANIZATIONS
- TABLE 9 REST OF THE WORLD: REGULATORY BODIES, GOVERNMENT AGENCIES, AND OTHER ORGANIZATIONS
- TABLE 10 CURRENT STANDARD CODES FOR CNG, RNG, AND HYDROGEN TANKS MARKET
- TABLE 11 HYDROGEN TANKS MARKET: GLOBAL PATENTS
- TABLE 12 CONFERENCES & EVENTS
- TABLE 13 CNG, RNG, AND HYDROGEN TANKS MARKET, BY TANK TYPE, 2018–2022 (USD MILLION)
- TABLE 14 CNG, RNG, AND HYDROGEN TANKS MARKET, BY TANK TYPE, 2018–2022 (THOUSAND UNIT)
- TABLE 15 CNG, RNG, AND HYDROGEN TANKS MARKET, BY TANK TYPE, 2023–2030 (USD MILLION)
- TABLE 16 CNG, RNG, AND HYDROGEN TANKS MARKET, BY TANK TYPE, 2023–2030 (THOUSAND UNIT)
- TABLE 17 TYPE 1: CNG AND RNG TANKS MARKET, BY REGION, 2018–2022 (USD MILLION)
- TABLE 18 TYPE 1: CNG AND RNG TANKS MARKET, BY REGION, 2018–2022 (THOUSAND UNIT)
- TABLE 19 TYPE 1: CNG AND RNG TANKS MARKET, BY REGION, 2023–2030 (USD MILLION)
- TABLE 20 TYPE 1: CNG AND RNG TANKS MARKET, BY REGION, 2023–2030 (THOUSAND UNIT)
- TABLE 21 TYPE 2: CNG AND RNG TANKS MARKET, BY REGION, 2018–2022 (USD MILLION)
- TABLE 22 TYPE 2: CNG AND RNG TANKS MARKET, BY REGION, 2018–2022 (THOUSAND UNIT)
- TABLE 23 TYPE 2: CNG AND RNG TANKS MARKET, BY REGION, 2023–2030 (USD MILLION)
- TABLE 24 TYPE 2: CNG AND RNG TANKS MARKET, BY REGION, 2023–2030 (THOUSAND UNIT)
- TABLE 25 TYPE 3: CNG, RNG, AND HYDROGEN TANKS MARKET, BY REGION, 2018–2022 (USD MILLION)
- TABLE 26 TYPE 3: CNG, RNG, AND HYDROGEN TANKS MARKET, BY REGION, 2018–2022 (THOUSAND UNIT)
- TABLE 27 TYPE 3: CNG, RNG, AND HYDROGEN TANKS MARKET, BY REGION, 2023–2030 (USD MILLION)
- TABLE 28 TYPE 3: CNG, RNG, AND HYDROGEN TANKS MARKET, BY REGION, 2023–2030 (THOUSAND UNIT)
- TABLE 29 TYPE 4: CNG, RNG, AND HYDROGEN TANKS MARKET, BY REGION, 2018–2022 (USD MILLION)
- TABLE 30 TYPE 4: CNG, RNG, AND HYDROGEN TANKS MARKET, BY REGION, 2018–2022 (THOUSAND UNIT)
- TABLE 31 TYPE 4: CNG, RNG, AND HYDROGEN TANKS MARKET, BY REGION, 2023–2030 (USD MILLION)
- TABLE 32 TYPE 4: CNG, RNG, AND HYDROGEN TANKS MARKET, BY REGION, 2023–2030 (THOUSAND UNIT)
- TABLE 33 CNG, RNG, AND HYDROGEN TANKS MARKET, BY GAS TYPE, 2018–2022 (USD MILLION)
- TABLE 34 CNG, RNG, AND HYDROGEN TANKS MARKET, GAS TYPE, 2018–2022 (THOUSAND UNIT)
- TABLE 35 CNG, RNG, AND HYDROGEN TANKS MARKET, BY GAS TYPE, 2023–2030 (USD MILLION)
- TABLE 36 CNG, RNG, AND HYDROGEN TANKS MARKET, GAS TYPE, 2023–2030 (THOUSAND UNIT)
- TABLE 37 CNG TANKS MARKET, BY REGION, 2018–2022 (USD MILLION)
- TABLE 38 CNG TANKS MARKET, BY REGION, 2018–2022 (THOUSAND UNIT)
- TABLE 39 CNG TANKS MARKET, BY REGION, 2023–2030 (USD MILLION)
- TABLE 40 CNG TANKS MARKET, BY REGION, 2023–2030 (THOUSAND UNIT)
- TABLE 41 CNG TANKS MARKET, BY APPLICATION, 2018–2022 (USD MILLION)
- TABLE 42 CNG TANKS MARKET, BY APPLICATION, 2018–2022 (THOUSAND UNIT)
- TABLE 43 CNG TANKS MARKET, BY APPLICATION, 2023–2030 (USD MILLION)
- TABLE 44 CNG TANKS MARKET, BY APPLICATION, 2023–2030 (THOUSAND UNIT)
- TABLE 45 HYDROGEN TANKS MARKET, BY REGION, 2018–2022 (USD MILLION)
- TABLE 46 HYDROGEN TANKS MARKET, BY REGION, 2018–2022 (THOUSAND UNIT)
- TABLE 47 HYDROGEN TANKS MARKET, BY REGION, 2023–2030 (USD MILLION)
- TABLE 48 HYDROGEN TANKS MARKET, BY REGION, 2023–2030 (THOUSAND UNIT)
- TABLE 49 HYDROGEN TANKS MARKET, BY APPLICATION, 2018–2022 (USD MILLION)
- TABLE 50 HYDROGEN TANKS MARKET, BY APPLICATION, 2018–2022 (THOUSAND UNIT)
- TABLE 51 HYDROGEN TANKS MARKET, BY APPLICATION, 2023–2030 (USD MILLION)
- TABLE 52 HYDROGEN TANKS MARKET, BY APPLICATION, 2023–2030 (THOUSAND UNIT)
- TABLE 53 RNG TANKS MARKET, BY REGION, 2018–2022 (USD MILLION)
- TABLE 54 RNG TANKS MARKET, BY REGION, 2018–2022 (THOUSAND UNIT)
- TABLE 55 RNG TANKS MARKET, BY REGION, 2023–2030 (USD MILLION)
- TABLE 56 RNG TANKS MARKET, BY REGION, 2023–2030 (THOUSAND UNIT)
- TABLE 57 RNG TANKS MARKET, BY APPLICATION, 2018–2022 (USD MILLION)
- TABLE 58 RNG TANKS MARKET, BY APPLICATION, 2018–2022 (THOUSAND UNIT)
- TABLE 59 RNG TANKS MARKET, BY APPLICATION, 2023–2030 (USD MILLION)
- TABLE 60 RNG TANKS MARKET, BY APPLICATION, 2023–2030 (THOUSAND UNIT)
- TABLE 61 CNG, RNG, AND HYDROGEN TANKS MARKET, BY APPLICATION, 2018–2022 (USD MILLION)
- TABLE 62 CNG, RNG, AND HYDROGEN TANKS MARKET, BY APPLICATION, 2018–2022 (THOUSAND UNITS)
- TABLE 63 CNG, RNG, AND HYDROGEN TANKS MARKET, BY APPLICATION, 2023–2030 (USD MILLION)
- TABLE 64 CNG, RNG, AND HYDROGEN TANKS MARKET, BY APPLICATION, 2023–2030 (THOUSAND UNITS)
- TABLE 65 FUEL TANK: CNG, RNG, AND HYDROGEN TANKS MARKET, BY REGION, 2018–2022 (USD MILLION)
- TABLE 66 FUEL TANK: CNG, RNG, AND HYDROGEN TANKS MARKET, BY REGION, 2018–2022 (THOUSAND UNITS)
- TABLE 67 FUEL TANK: CNG, RNG, AND HYDROGEN TANKS MARKET, BY REGION, 2023–2030 (USD MILLION)
- TABLE 68 FUEL TANK: CNG, RNG, AND HYDROGEN TANKS MARKET, BY REGION, 2023–2030 (THOUSAND UNITS)
- TABLE 69 FUEL TANK: CNG, RNG, AND HYDROGEN TANKS MARKET, BY GAS TYPE, 2018–2022 (USD MILLION)
- TABLE 70 FUEL TANK: CNG, RNG, AND HYDROGEN TANKS MARKET, BY GAS TYPE, 2018–2022 (THOUSAND UNITS)
- TABLE 71 FUEL TANK: CNG, RNG, AND HYDROGEN TANKS MARKET, BY GAS TYPE, 2023–2030 (USD MILLION)
- TABLE 72 FUEL TANK: CNG, RNG, AND HYDROGEN TANKS MARKET, BY GAS TYPE, 2023–2030 (THOUSAND UNITS)
- TABLE 73 TRANSPORTATION TANK: CNG, RNG, AND HYDROGEN TANKS MARKET, BY REGION, 2018–2022 (USD MILLION)
- TABLE 74 TRANSPORTATION TANK: CNG, RNG, AND HYDROGEN TANKS MARKET, BY REGION, 2018–2022 (THOUSAND UNITS)
- TABLE 75 TRANSPORTATION TANK: CNG, RNG, AND HYDROGEN TANKS MARKET, BY REGION, 2023–2030 (USD MILLION)
- TABLE 76 TRANSPORTATION TANK: CNG, RNG, AND HYDROGEN TANKS MARKET, BY REGION, 2023–2030 (THOUSAND UNITS)
- TABLE 77 TRANSPORTATION TANK: CNG, RNG, AND HYDROGEN TANKS MARKET, BY GAS TYPE, 2018–2022 (USD MILLION)
- TABLE 78 TRANSPORTATION TANK: CNG, RNG, AND HYDROGEN TANKS MARKET, BY GAS TYPE, 2018–2022 (THOUSAND UNITS)
- TABLE 79 TRANSPORTATION TANK: CNG, RNG, AND HYDROGEN TANKS MARKET, BY GAS TYPE, 2023–2030 (USD MILLION)
- TABLE 80 TRANSPORTATION TANK: CNG, RNG, AND HYDROGEN TANKS MARKET, BY GAS TYPE, 2023–2030 (THOUSAND UNITS)
- TABLE 81 CNG, RNG, AND HYDROGEN TANKS MARKET, BY MATERIAL, 2018–2022 (USD MILLION)
- TABLE 82 CNG, RNG, AND HYDROGEN TANKS MARKET, BY MATERIAL, 2018–2022 (THOUSAND UNIT)
- TABLE 83 CNG, RNG, AND HYDROGEN TANKS MARKET, BY MATERIAL, 2023–2030 (USD MILLION)
- TABLE 84 CNG, RNG, AND HYDROGEN TANKS MARKET, BY MATERIAL, 2023–2030 (THOUSAND UNIT)
- TABLE 85 METAL TANKS MARKET, BY REGION, 2018–2022 (USD MILLION)
- TABLE 86 METAL TANKS MARKET, BY REGION, 2018–2022 (THOUSAND UNIT)
- TABLE 87 METAL TANKS MARKET, BY REGION, 2023–2030 (USD MILLION)
- TABLE 88 METAL TANKS MARKET, BY REGION, 2023–2030 (THOUSAND UNIT)
- TABLE 89 GLASS FIBER TANKS MARKET, BY REGION, 2018–2022 (USD MILLION)
- TABLE 90 GLASS FIBER TANKS MARKET, BY REGION, 2018–2022 (THOUSAND UNIT)
- TABLE 91 GLASS FIBER TANKS MARKET, BY REGION, 2023–2030 (USD MILLION)
- TABLE 92 GLASS FIBER TANKS MARKET, BY REGION, 2023–2030 (THOUSAND UNIT)
- TABLE 93 CARBON FIBER TANKS MARKET, BY REGION, 2018–2022 (USD MILLION)
- TABLE 94 CARBON FIBER TANKS MARKET, BY REGION, 2018–2022 (THOUSAND UNIT)
- TABLE 95 CARBON FIBER TANKS MARKET, BY REGION, 2023–2030 (USD MILLION)
- TABLE 96 CARBON FIBER TANKS MARKET, BY REGION, 2023–2030 (THOUSAND UNIT)
- TABLE 97 CNG, RNG, AND HYDROGEN TANKS MARKET, BY REGION, 2018–2022 (USD MILLION)
- TABLE 98 CNG, RNG, AND HYDROGEN TANKS MARKET, BY REGION, 2018–2022 (THOUSAND UNIT)
- TABLE 99 CNG, RNG, AND HYDROGEN TANKS MARKET, BY REGION, 2023–2030 (USD MILLION)
- TABLE 100 CNG, RNG, AND HYDROGEN TANKS MARKET, BY REGION, 2023–2030 (THOUSAND UNIT)
- TABLE 101 NORTH AMERICA: CNG, RNG, AND HYDROGEN TANKS MARKET, BY APPLICATION, 2018–2022 (USD MILLION)
- TABLE 102 NORTH AMERICA: CNG, RNG, AND HYDROGEN TANKS MARKET, BY APPLICATION, 2018–2022 (THOUSAND UNIT)
- TABLE 103 NORTH AMERICA: CNG, RNG, AND HYDROGEN TANKS MARKET, BY APPLICATION, 2023–2030 (USD MILLION)
- TABLE 104 NORTH AMERICA: CNG, RNG, AND HYDROGEN TANKS MARKET, BY APPLICATION, 2023–2030 (THOUSAND UNIT)
- TABLE 105 NORTH AMERICA: CNG, RNG, AND HYDROGEN TANKS MARKET, BY TANK TYPE, 2018–2022 (USD MILLION)
- TABLE 106 NORTH AMERICA: CNG, RNG, AND HYDROGEN TANKS MARKET, BY TANK TYPE, 2018–2022 (THOUSAND UNIT)
- TABLE 107 NORTH AMERICA: CNG, RNG, AND HYDROGEN TANKS MARKET, BY TANK TYPE, 2023–2030 (USD MILLION)
- TABLE 108 NORTH AMERICA: CNG, RNG, AND HYDROGEN TANKS MARKET, BY TANK TYPE, 2023–2030 (THOUSAND UNIT)
- TABLE 109 NORTH AMERICA: CNG, RNG, AND HYDROGEN TANKS MARKET, BY GAS TYPE, 2018–2022 (USD MILLION)
- TABLE 110 NORTH AMERICA: CNG, RNG, AND HYDROGEN TANKS MARKET, BY GAS TYPE, 2018–2022 (THOUSAND UNIT)
- TABLE 111 NORTH AMERICA: CNG, RNG, AND HYDROGEN TANKS MARKET, BY GAS TYPE, 2023–2030 (USD MILLION)
- TABLE 112 NORTH AMERICA: CNG, RNG, AND HYDROGEN TANKS MARKET, BY GAS TYPE, 2023–2030 (THOUSAND UNIT)
- TABLE 113 NORTH AMERICA: CNG, RNG, AND HYDROGEN TANKS MARKET, BY MATERIAL, 2018–2022 (USD MILLION)
- TABLE 114 NORTH AMERICA: CNG, RNG, AND HYDROGEN TANKS MARKET, BY MATERIAL, 2018–2022 (THOUSAND UNIT)
- TABLE 115 NORTH AMERICA: CNG, RNG, AND HYDROGEN TANKS MARKET, BY MATERIAL, 2023–2030 (USD MILLION)
- TABLE 116 NORTH AMERICA: CNG, RNG, AND HYDROGEN TANKS MARKET, BY MATERIAL, 2023–2030 (THOUSAND UNIT)
- TABLE 117 NORTH AMERICA: CNG TANKS MARKET, BY COUNTRY, 2018–2022 (USD MILLION)
- TABLE 118 NORTH AMERICA: CNG TANKS MARKET, BY COUNTRY, 2018–2022 (THOUSAND UNIT)
- TABLE 119 NORTH AMERICA: CNG TANKS MARKET, BY COUNTRY, 2023–2030 (USD MILLION)
- TABLE 120 NORTH AMERICA: CNG TANKS MARKET, BY COUNTRY, 2023–2030 (THOUSAND UNIT)
- TABLE 121 NORTH AMERICA: RNG TANKS MARKET, BY COUNTRY, 2018–2022 (USD MILLION)
- TABLE 122 NORTH AMERICA: RNG TANKS MARKET, BY COUNTRY, 2018–2022 (THOUSAND UNIT)
- TABLE 123 NORTH AMERICA: RNG TANKS MARKET, BY COUNTRY, 2023–2030 (USD MILLION)
- TABLE 124 NORTH AMERICA: RNG TANKS MARKET, BY COUNTRY, 2023–2030 (THOUSAND UNIT)
- TABLE 125 NORTH AMERICA: HYDROGEN TANKS MARKET, BY COUNTRY, 2018–2022 (USD MILLION)
- TABLE 126 NORTH AMERICA: HYDROGEN TANKS MARKET, BY COUNTRY, 2018–2022 (THOUSAND UNIT)
- TABLE 127 NORTH AMERICA: HYDROGEN TANKS MARKET, BY COUNTRY, 2023–2030 (USD MILLION)
- TABLE 128 NORTH AMERICA: HYDROGEN TANKS MARKET, BY COUNTRY, 2023–2030 (THOUSAND UNIT)
- TABLE 129 ASIA PACIFIC: CNG, RNG, AND HYDROGEN TANKS MARKET, BY APPLICATION, 2018–2022 (USD MILLION)
- TABLE 130 ASIA PACIFIC: CNG, RNG, AND HYDROGEN TANKS MARKET, BY APPLICATION, 2018–2022 (THOUSAND UNIT)
- TABLE 131 ASIA PACIFIC: CNG, RNG, AND HYDROGEN TANKS MARKET, BY APPLICATION, 2023–2030 (USD MILLION)
- TABLE 132 ASIA PACIFIC: CNG, RNG, AND HYDROGEN TANKS MARKET, BY APPLICATION, 2023–2030 (THOUSAND UNIT)
- TABLE 133 ASIA PACIFIC: CNG, RNG, AND HYDROGEN TANKS MARKET, BY TANK TYPE, 2018–2022 (USD MILLION)
- TABLE 134 ASIA PACIFIC: CNG, RNG, AND HYDROGEN TANKS MARKET, BY TANK TYPE, 2018–2022 (THOUSAND UNIT)
- TABLE 135 ASIA PACIFIC: CNG, RNG, AND HYDROGEN TANKS MARKET, BY TANK TYPE, 2023–2030 (USD MILLION)
- TABLE 136 ASIA PACIFIC: CNG, RNG, AND HYDROGEN TANKS MARKET, BY TANK TYPE, 2023–2030 (THOUSAND UNIT)
- TABLE 137 ASIA PACIFIC: CNG, RNG, AND HYDROGEN TANKS MARKET, BY GAS TYPE, 2018–2022 (USD MILLION)
- TABLE 138 ASIA PACIFIC: CNG, RNG, AND HYDROGEN TANKS MARKET, BY GAS TYPE, 2018–2022 (THOUSAND UNIT)
- TABLE 139 ASIA PACIFIC: CNG, RNG, AND HYDROGEN TANKS MARKET, BY GAS TYPE, 2023–2030 (USD MILLION)
- TABLE 140 ASIA PACIFIC: CNG, RNG, AND HYDROGEN TANKS MARKET, BY GAS TYPE, 2023–2030 (THOUSAND UNIT)
- TABLE 141 ASIA PACIFIC: CNG, RNG, AND HYDROGEN TANKS MARKET, BY MATERIAL, 2018–2022 (USD MILLION)
- TABLE 142 ASIA PACIFIC: CNG, RNG, AND HYDROGEN TANKS MARKET, BY MATERIAL, 2018–2022 (THOUSAND UNIT)
- TABLE 143 ASIA PACIFIC: CNG, RNG, AND HYDROGEN TANKS MARKET, BY MATERIAL, 2023–2030 (USD MILLION)
- TABLE 144 ASIA PACIFIC: CNG, RNG, AND HYDROGEN TANKS MARKET, BY MATERIAL, 2023–2030 (THOUSAND UNIT)
- TABLE 145 ASIA PACIFIC: CNG TANKS MARKET, BY COUNTRY, 2018–2022 (USD MILLION)
- TABLE 146 ASIA PACIFIC: CNG TANKS MARKET, BY COUNTRY, 2018–2022 (THOUSAND UNIT)
- TABLE 147 ASIA PACIFIC: CNG TANKS MARKET, BY COUNTRY, 2023–2030 (USD MILLION)
- TABLE 148 ASIA PACIFIC: CNG TANKS MARKET, BY COUNTRY, 2023–2030 (THOUSAND UNIT)
- TABLE 149 ASIA PACIFIC: RNG TANKS MARKET, BY COUNTRY, 2018–2022 (USD MILLION)
- TABLE 150 ASIA PACIFIC: RNG TANKS MARKET, BY COUNTRY, 2018–2022 (THOUSAND UNIT)
- TABLE 151 ASIA PACIFIC: RNG TANKS MARKET, BY COUNTRY, 2023–2030 (USD MILLION)
- TABLE 152 ASIA PACIFIC: RNG TANKS MARKET, BY COUNTRY, 2023–2030 (THOUSAND UNIT)
- TABLE 153 ASIA PACIFIC: HYDROGEN TANKS MARKET, BY COUNTRY, 2018–2022 (USD MILLION)
- TABLE 154 ASIA PACIFIC: HYDROGEN TANKS MARKET, BY COUNTRY, 2018–2022 (THOUSAND UNIT)
- TABLE 155 ASIA PACIFIC: HYDROGEN TANKS MARKET, BY COUNTRY, 2023–2030 (USD MILLION)
- TABLE 156 ASIA PACIFIC: HYDROGEN TANKS MARKET, BY COUNTRY, 2023–2030 (THOUSAND UNIT)
- TABLE 157 EUROPE: CNG, RNG, AND HYDROGEN TANKS MARKET, BY APPLICATION, 2018–2022 (USD MILLION)
- TABLE 158 EUROPE: CNG, RNG, AND HYDROGEN TANKS MARKET, BY APPLICATION, 2018–2022 (THOUSAND UNIT)
- TABLE 159 EUROPE: CNG, RNG, AND HYDROGEN TANKS MARKET, BY APPLICATION, 2023–2030 (USD MILLION)
- TABLE 160 EUROPE: CNG, RNG, AND HYDROGEN TANKS MARKET, BY APPLICATION, 2023–2030 (THOUSAND UNIT)
- TABLE 161 EUROPE: CNG, RNG, AND HYDROGEN TANKS MARKET, BY TANK TYPE, 2018–2022 (USD MILLION)
- TABLE 162 EUROPE: CNG, RNG, AND HYDROGEN TANKS MARKET, BY TANK TYPE, 2018–2022 (THOUSAND UNIT)
- TABLE 163 EUROPE: CNG, RNG, AND HYDROGEN TANKS MARKET, BY TANK TYPE, 2023–2030 (USD MILLION)
- TABLE 164 EUROPE: CNG, RNG, AND HYDROGEN TANKS MARKET, BY TANK TYPE, 2023–2030 (THOUSAND UNIT)
- TABLE 165 EUROPE: CNG, RNG, AND HYDROGEN TANKS MARKET, BY GAS TYPE, 2018–2022 (USD MILLION)
- TABLE 166 EUROPE: CNG, RNG, AND HYDROGEN TANKS MARKET, BY GAS TYPE, 2018–2022 (THOUSAND UNIT)
- TABLE 167 EUROPE: CNG, RNG, AND HYDROGEN TANKS MARKET, BY GAS TYPE, 2023–2030 (USD MILLION)
- TABLE 168 EUROPE: CNG, RNG, AND HYDROGEN TANKS MARKET, BY GAS TYPE, 2023–2030 (THOUSAND UNIT)
- TABLE 169 EUROPE: CNG, RNG, AND HYDROGEN TANKS MARKET, BY MATERIAL, 2018–2022 (USD MILLION)
- TABLE 170 EUROPE: CNG, RNG, AND HYDROGEN TANKS MARKET, BY MATERIAL, 2018–2022 (THOUSAND UNIT)
- TABLE 171 EUROPE: CNG, RNG, AND HYDROGEN TANKS MARKET, BY MATERIAL, 2023–2030 (USD MILLION)
- TABLE 172 EUROPE: CNG, RNG, AND HYDROGEN TANKS MARKET, BY MATERIAL, 2023–2030 (THOUSAND UNIT)
- TABLE 173 EUROPE: CNG TANKS MARKET, BY COUNTRY, 2018–2022 (USD MILLION)
- TABLE 174 EUROPE: CNG TANKS MARKET, BY COUNTRY, 2018–2022 (THOUSAND UNIT)
- TABLE 175 EUROPE: CNG TANKS MARKET, BY COUNTRY, 2023–2030 (USD MILLION)
- TABLE 176 EUROPE: CNG TANKS MARKET, BY COUNTRY, 2023–2030 (THOUSAND UNIT)
- TABLE 177 EUROPE: RNG TANKS MARKET, BY COUNTRY, 2018–2022 (USD MILLION)
- TABLE 178 EUROPE: RNG TANKS MARKET, BY COUNTRY, 2018–2022 (THOUSAND UNIT)
- TABLE 179 EUROPE: RNG TANKS MARKET, BY COUNTRY, 2023–2030 (USD MILLION)
- TABLE 180 EUROPE: RNG TANKS MARKET, BY COUNTRY, 2023–2030 (THOUSAND UNIT)
- TABLE 181 EUROPE: HYDROGEN TANKS MARKET, BY COUNTRY, 2018–2022 (USD MILLION)
- TABLE 182 EUROPE: HYDROGEN TANKS MARKET, BY COUNTRY, 2018–2022 (THOUSAND UNIT)
- TABLE 183 EUROPE: HYDROGEN TANKS MARKET, BY COUNTRY, 2023–2030 (USD MILLION)
- TABLE 184 EUROPE: HYDROGEN TANKS MARKET, BY COUNTRY, 2023–2030 (THOUSAND UNIT)
- TABLE 185 MIDDLE EAST & AFRICA: CNG, RNG, AND HYDROGEN TANKS MARKET, BY APPLICATION, 2018–2022 (USD MILLION)
- TABLE 186 MIDDLE EAST & AFRICA: CNG, RNG, AND HYDROGEN TANKS MARKET, BY APPLICATION, 2018–2022 (THOUSAND UNIT)
- TABLE 187 MIDDLE EAST & AFRICA: CNG, RNG, AND HYDROGEN TANKS MARKET, BY APPLICATION, 2023–2030 (USD MILLION)
- TABLE 188 MIDDLE EAST & AFRICA: CNG, RNG, AND HYDROGEN TANKS MARKET, BY APPLICATION, 2023–2030 (THOUSAND UNIT)
- TABLE 189 MIDDLE EAST & AFRICA: CNG, RNG, AND HYDROGEN TANKS MARKET, BY TANK TYPE, 2018–2022 (USD MILLION)
- TABLE 190 MIDDLE EAST & AFRICA: CNG, RNG, AND HYDROGEN TANKS MARKET, BY TANK TYPE, 2018–2022 (THOUSAND UNIT)
- TABLE 191 MIDDLE EAST & AFRICA: CNG, RNG, AND HYDROGEN TANKS MARKET, BY TANK TYPE, 2023–2030 (USD MILLION)
- TABLE 192 MIDDLE EAST & AFRICA: CNG, RNG, AND HYDROGEN TANKS MARKET, BY TANK TYPE, 2023–2030 (THOUSAND UNIT)
- TABLE 193 MIDDLE EAST & AFRICA: CNG, RNG, AND HYDROGEN TANKS MARKET, BY GAS TYPE, 2018–2022 (USD MILLION)
- TABLE 194 MIDDLE EAST & AFRICA: CNG, RNG, AND HYDROGEN TANKS MARKET, BY GAS TYPE, 2018–2022 (THOUSAND UNIT)
- TABLE 195 MIDDLE EAST & AFRICA: CNG, RNG, AND HYDROGEN TANKS MARKET, BY GAS TYPE, 2023–2030 (USD MILLION)
- TABLE 196 MIDDLE EAST & AFRICA: CNG, RNG, AND HYDROGEN TANKS MARKET, BY GAS TYPE, 2023–2030 (THOUSAND UNIT)
- TABLE 197 MIDDLE EAST & AFRICA: CNG, RNG, AND HYDROGEN TANKS MARKET, BY MATERIAL, 2018–2022 (USD MILLION)
- TABLE 198 MIDDLE EAST & AFRICA CNG, RNG, AND HYDROGEN TANKS MARKET, BY MATERIAL, 2018–2022 (THOUSAND UNIT)
- TABLE 199 MIDDLE EAST & AFRICA: CNG, RNG, AND HYDROGEN TANKS MARKET, BY MATERIAL, 2023–2030 (USD MILLION)
- TABLE 200 MIDDLE EAST & AFRICA: CNG, RNG, AND HYDROGEN TANKS MARKET, BY MATERIAL, 2023–2030 (THOUSAND UNIT)
- TABLE 201 MIDDLE EAST & AFRICA: CNG TANKS MARKET, BY COUNTRY, 2018–2022 (USD MILLION)
- TABLE 202 MIDDLE EAST & AFRICA: CNG TANKS MARKET, BY COUNTRY, 2018–2022 (THOUSAND UNIT)
- TABLE 203 MIDDLE EAST & AFRICA: CNG TANKS MARKET, BY COUNTRY, 2023–2030 (USD MILLION)
- TABLE 204 MIDDLE EAST & AFRICA: CNG TANKS MARKET, BY COUNTRY, 2023–2030 (THOUSAND UNIT)
- TABLE 205 MIDDLE EAST & AFRICA: HYDROGEN TANKS MARKET, BY COUNTRY, 2018–2022 (USD MILLION)
- TABLE 206 MIDDLE EAST & AFRICA: HYDROGEN TANKS MARKET, BY COUNTRY, 2018–2022 (THOUSAND UNIT)
- TABLE 207 MIDDLE EAST & AFRICA: HYDROGEN TANKS MARKET, BY COUNTRY, 2023–2030 (USD MILLION)
- TABLE 208 MIDDLE EAST & AFRICA: HYDROGEN TANKS MARKET, BY COUNTRY, 2023–2030 (THOUSAND UNIT)
- TABLE 209 LATIN AMERICA: CNG, RNG, AND HYDROGEN TANKS MARKET, BY APPLICATION, 2018–2022 (USD MILLION)
- TABLE 210 LATIN AMERICA: CNG, RNG, AND HYDROGEN TANKS MARKET, BY APPLICATION, 2018–2022 (THOUSAND UNIT)
- TABLE 211 LATIN AMERICA: CNG, RNG, AND HYDROGEN TANKS MARKET, BY APPLICATION, 2023–2030 (USD MILLION)
- TABLE 212 LATIN AMERICA: CNG, RNG, AND HYDROGEN TANKS MARKET, BY APPLICATION, 2023–2030 (THOUSAND UNIT)
- TABLE 213 LATIN AMERICA: CNG, RNG, AND HYDROGEN TANKS MARKET, BY TANK TYPE, 2018–2022 (USD MILLION)
- TABLE 214 LATIN AMERICA: CNG, RNG, AND HYDROGEN TANKS MARKET, BY TANK TYPE, 2018–2022 (THOUSAND UNIT)
- TABLE 215 LATIN AMERICA: CNG, RNG, AND HYDROGEN TANKS MARKET, BY TANK TYPE, 2023–2030 (USD MILLION)
- TABLE 216 LATIN AMERICA: CNG, RNG, AND HYDROGEN TANKS MARKET, BY TANK TYPE, 2023–2030 (THOUSAND UNIT)
- TABLE 217 LATIN AMERICA: CNG, RNG, AND HYDROGEN TANKS MARKET, BY GAS TYPE, 2018–2022 (USD MILLION)
- TABLE 218 LATIN AMERICA: CNG, RNG, AND HYDROGEN TANKS MARKET, BY GAS TYPE, 2018–2022 (THOUSAND UNIT)
- TABLE 219 LATIN AMERICA: CNG, RNG, AND HYDROGEN TANKS MARKET, BY GAS TYPE, 2023–2030 (USD MILLION)
- TABLE 220 LATIN AMERICA: CNG, RNG, AND HYDROGEN TANKS MARKET, BY GAS TYPE, 2023–2030 (THOUSAND UNIT)
- TABLE 221 LATIN AMERICA: CNG, RNG, AND HYDROGEN TANKS MARKET, BY MATERIAL, 2018–2022 (USD MILLION)
- TABLE 222 LATIN AMERICA: CNG, RNG, AND HYDROGEN TANKS MARKET, BY MATERIAL, 2018–2022 (THOUSAND UNIT)
- TABLE 223 LATIN AMERICA: CNG, RNG, AND HYDROGEN TANKS MARKET, BY MATERIAL, 2023–2030 (USD MILLION)
- TABLE 224 LATIN AMERICA: CNG, RNG, AND HYDROGEN TANKS MARKET, BY MATERIAL, 2023–2030 (THOUSAND UNIT)
- TABLE 225 LATIN AMERICA: CNG TANKS MARKET, BY COUNTRY, 2018–2022 (USD MILLION)
- TABLE 226 LATIN AMERICA: CNG TANKS MARKET, BY COUNTRY, 2018–2022 (THOUSAND UNIT)
- TABLE 227 LATIN AMERICA: CNG TANKS MARKET, BY COUNTRY, 2023–2030 (USD MILLION)
- TABLE 228 LATIN AMERICA: CNG TANKS MARKET, BY COUNTRY, 2023–2030 (THOUSAND UNIT)
- TABLE 229 LATIN AMERICA: RNG TANKS MARKET, BY COUNTRY, 2018–2022 (USD MILLION)
- TABLE 230 LATIN AMERICA: RNG TANKS MARKET, BY COUNTRY, 2018–2022 (THOUSAND UNIT)
- TABLE 231 LATIN AMERICA: RNG TANKS MARKET, BY COUNTRY, 2023–2030 (USD MILLION)
- TABLE 232 LATIN AMERICA: RNG TANKS MARKET, BY COUNTRY, 2023–2030 (THOUSAND UNIT)
- TABLE 233 LATIN AMERICA: HYDROGEN TANKS MARKET, BY COUNTRY, 2018–2022 (USD MILLION)
- TABLE 234 LATIN AMERICA: HYDROGEN TANKS MARKET, BY COUNTRY, 2018–2022 (THOUSAND UNIT)
- TABLE 235 LATIN AMERICA: HYDROGEN TANKS MARKET, BY COUNTRY, 2023–2030 (USD MILLION)
- TABLE 236 LATIN AMERICA: HYDROGEN TANKS MARKET, BY COUNTRY, 2023–2030 (THOUSAND UNIT)
- TABLE 237 DEGREE OF COMPETITION: CNG, RNG, AND HYDROGEN TANKS MARKET
- TABLE 238 COMPANY PRODUCT FOOTPRINT
- TABLE 239 COMPANY END-USE APPLICATION FOOTPRINT
- TABLE 240 COMPANY REGION FOOTPRINT
- TABLE 241 PRODUCT DEVELOPMENTS, 2018–2023
- TABLE 242 DEALS, 2016-2023
- TABLE 243 CNG, RNG, AND HYDROGEN TANKS MARKET: OTHERS, 2016-2023
- TABLE 244 CNG, RNG, AND HYDROGEN TANKS MARKET: KEY STARTUPS/SMES
- TABLE 245 COMPETITIVE BENCHMARKING OF KEY STARTUPS/SMES
- TABLE 246 WORTHINGTON INDUSTRIES, INC.: COMPANY OVERVIEW
- TABLE 247 WORTHINGTON INDUSTRIES, INC.: NEW PRODUCT DEVELOPMENT
- TABLE 248 WORTHINGTON INDUSTRIES, INC.: DEALS
- TABLE 249 LUXFER GROUP: COMPANY OVERVIEW
- TABLE 250 LUXFER GROUP: NEW PRODUCT DEVELOPMENT
- TABLE 251 LUXFER GROUP: DEALS
- TABLE 252 HEXAGON COMPOSITES ASA: COMPANY OVERVIEW
- TABLE 253 HEXAGON COMPOSITES ASA: DEALS
- TABLE 254 HEXAGON COMPOSITES ASA: OTHER DEALS
- TABLE 255 QUANTUM FUEL SYSTEMS LLC.: COMPANY OVERVIEW
- TABLE 256 QUANTUM FUEL SYSTEMS LLC.: DEALS
- TABLE 257 EVEREST KANTO CYLINDER LTD.: COMPANY OVERVIEW
- TABLE 258 PRAXAIR TECHNOLOGIES INC.: COMPANY OVERVIEW
- TABLE 259 AVANCO GROUP: COMPANY OVERVIEW
- TABLE 260 AVANCO GROUP: DEALS
- TABLE 261 BEIJING TIANHAI INDUSTRY CO. LTD.: COMPANY OVERVIEW
- TABLE 262 LIANYUNGANG ZHONGFU LIANZHONG COMPOSITES GROUP CO. LTD.: COMPANY OVERVIEW
- TABLE 263 FABER INDUSTRIE SPA: COMPANY OVERVIEW
- TABLE 264 FABER INDUSTRIE SPA: NEW PRODUCT DEVELOPMENT
- TABLE 265 COMPOSITES ADVANCED TECHNOLOGIES, LLC.: COMPANY OVERVIEW
- TABLE 266 CIMC ENRIC: COMPANY OVERVIEW
- TABLE 267 CIMC ENRIC: DEALS
- TABLE 268 LUXI NEW ENERGY EQUIPMENT GROUP CO., LTD.: COMPANY OVERVIEW
- TABLE 269 SINOCLEANSKY: BUSINESS OVERVIEW
- TABLE 270 LINDE PLC: COMPANY OVERVIEW
- TABLE 271 ULLIT SA: COMPANY OVERVIEW
- TABLE 272 AGILITY FUEL SOLUTIONS: COMPANY OVERVIEW
- TABLE 273 RAMA CYLINDERS PRIVATE LIMITED: COMPANY OVERVIEW
- TABLE 274 JPM GROUP: COMPANY OVERVIEW
- TABLE 275 SAHUWALA CYLINDERS LTD.: COMPANY OVERVIEW
- TABLE 276 EURO INDIA CYLINDERS LTD.: COMPANY OVERVIEW
- TABLE 277 CEVOTEC GMBH: COMPANY OVERVIEW
- TABLE 278 NPROXX: COMPANY OVERVIEW
- TABLE 279 STEELHEAD COMPOSITES, INC.: COMPANY OVERVIEW
- TABLE 280 JIANGSU QIULIN SPECIAL ENERGY EQUIPMENT JOINT STOCK LIMITED COMPANY: COMPANY OVERVIEW
- FIGURE 1 CNG, RNG, AND HYDROGEN TANKS MARKET SEGMENTATION
- FIGURE 2 CNG, RNG, AND HYDROGEN TANKS MARKET: RESEARCH DESIGN
- FIGURE 3 CNG, RNG, AND HYDROGEN TANKS MARKET: BOTTOM-UP APPROACH
- FIGURE 4 CNG, RNG, AND HYDROGEN TANKS MARKET: TOP-DOWN APPROACH
- FIGURE 5 CNG, RNG, AND HYDROGEN TANKS MARKET: DATA TRIANGULATION
- FIGURE 6 CNG TANKS WAS LARGEST SEGMENT OF CNG, RNG, AND HYDROGEN TANKS MARKET IN 2022
- FIGURE 7 CARBON FIBER-BASED CNG, RNG, AND HYDROGEN TANKS REGISTER HIGHEST CAGR
- FIGURE 8 FUEL TANK APPLICATION DOMINATED THE MARKET IN 2022
- FIGURE 9 TYPE 1 SEGMENT DOMINATED THE MARKET IN 2022
- FIGURE 10 ASIA PACIFIC LED CNG, RNG, AND HYDROGEN TANKS MARKET IN 2022
- FIGURE 11 SIGNIFICANT GROWTH PROJECTED IN GLOBAL MARKET BETWEEN 2023 AND 2030
- FIGURE 12 TYPE 1 SEGMENT AND ASIA PACIFIC ACCOUNTED FOR LARGEST SHARE IN 2022
- FIGURE 13 METAL SEGMENT DOMINATED MARKET
- FIGURE 14 FUEL TANK APPLICATION DOMINATED MARKET
- FIGURE 15 CNG DOMINATED MARKET
- FIGURE 16 INDIA TO BE FASTEST-GROWING CNG TANKS MARKET, (2023–2030)
- FIGURE 17 DRIVERS, RESTRAINTS, OPPORTUNITIES, AND CHALLENGES
- FIGURE 18 CNG, RNG, AND HYDROGEN TANKS MARKET: PORTER’S FIVE FORCES ANALYSIS
- FIGURE 19 INFLUENCE OF STAKEHOLDERS ON BUYING PROCESS FOR TOP 2 APPLICATIONS
- FIGURE 20 KEY BUYING CRITERIA FOR TOP 2 APPLICATIONS
- FIGURE 21 VALUE CHAIN ANALYSIS: CNG, RNG, AND HYDROGEN TANKS MARKET
- FIGURE 22 GLOBAL PATENT ANALYSIS, BY DOCUMENT TYPE
- FIGURE 23 GLOBAL PATENT PUBLICATION TREND: 2012–2022
- FIGURE 24 HYDROGEN TANKS MARKET: LEGAL STATUS OF PATENTS
- FIGURE 25 GLOBAL JURISDICTION ANALYSIS
- FIGURE 26 CHINA PETROLEUM & CHEM CORP. REGISTERED HIGHEST NUMBER OF PATENTS
- FIGURE 27 TYPE 1 CYLINDER SEGMENT TO DOMINATE CNG, RNG, AND HYDROGEN TANKS MARKET
- FIGURE 28 DEMAND FOR TYPE 1 CYLINDER TANKS TO BE HIGHEST IN ASIA PACIFIC
- FIGURE 29 CNG GAS SEGMENT TO LEAD CNG, RNG, AND HYDROGEN TANKS MARKET
- FIGURE 30 DEMAND FOR CNG TO BE HIGHEST IN ASIA PACIFIC
- FIGURE 31 FUEL TANK APPLICATION TO DOMINATE CNG, RNG, AND HYDROGEN TANKS MARKET
- FIGURE 32 DEMAND FOR FUEL TANKS TO BE HIGHEST IN ASIA PACIFIC
- FIGURE 33 METAL SEGMENT TO LEAD CNG, RNG, AND HYDROGEN TANKS MARKET
- FIGURE 34 DEMAND FOR METAL TO BE HIGHEST IN ASIA PACIFIC
- FIGURE 35 INDIA TO BE THE FASTEST-GROWING CNG TANKS MARKET
- FIGURE 36 NORTH AMERICA: CNG, RNG, AND HYDROGEN TANKS MARKET SNAPSHOT
- FIGURE 37 ASIA PACIFIC: CNG, RNG, AND HYDROGEN TANKS MARKET SNAPSHOT
- FIGURE 38 EUROPE: CNG, RNG, AND HYDROGEN TANKS MARKET SNAPSHOT
- FIGURE 39 IRAN IS THE LARGEST MARKET FOR CNG TANKS
- FIGURE 40 HIGH DEMAND IN BRAZIL IS DUE TO GROWING AUTOMOTIVE INDUSTRY
- FIGURE 41 MARKET SHARE OF TOP COMPANIES IN THE CNG, RNG, AND HYDROGEN TANKS MARKET, 2022
- FIGURE 42 RANKING OF TOP FIVE PLAYERS IN THE CNG, RNG, AND HYDROGEN TANKS MARKET
- FIGURE 43 REVENUE ANALYSIS OF TOP PLAYERS IN CNG, RNG, AND HYDROGEN TANKS MARKET
- FIGURE 44 COMPETITIVE LEADERSHIP MAPPING, 2022
- FIGURE 45 CNG, RNG, AND HYDROGEN TANKS MARKET: SMALL AND MEDIUM-SIZED ENTERPRISES MAPPING, 2022
- FIGURE 46 WORTHINGTON INDUSTRIES, INC.: COMPANY SNAPSHOT
- FIGURE 47 LUXFER GROUP: COMPANY SNAPSHOT
- FIGURE 48 HEXAGON COMPOSITES ASA: COMPANY SNAPSHOT
- FIGURE 49 EVEREST KANTO CYLINDER LTD.: COMPANY SNAPSHOT
- FIGURE 50 CIMC ENRIC: COMPANY SNAPSHOT
The study involves two major activities in estimating the current market size for the CNG, RNG, and hydrogen tank market. Exhaustive secondary research was done to collect information on the market, peer market, and parent market. The next step was to validate these findings, assumptions, and sizing with industry experts across the value chain through primary research. Both top-down and bottom-up approaches were employed to estimate the complete market size. After that, market breakdown and data triangulation were used to estimate the market size of segments and subsegments.
Secondary Research
Secondary sources referred to for this research study include financial statements of companies offering CNG, RNG, and hydrogen tanks and information from various trade, business, and professional associations. Secondary research has been used to obtain critical information about the industry’s value chain, the total pool of key players, market classification, and segmentation according to industry trends to the bottom-most level and regional markets. The secondary data was collected and analyzed to arrive at the overall size of the CNG, RNG, and hydrogen tank market, which was validated by primary respondents.
Primary Research
Extensive primary research was conducted after obtaining information regarding the CNG, RNG, and hydrogen tank market scenario through secondary research. Several primary interviews were conducted with market experts from both the demand and supply sides across major countries of North America, Europe, Asia Pacific, the Middle East & Africa, and Latin America. Primary data was collected through questionnaires, emails, and telephonic interviews. The primary sources from the supply side included various industry experts, such as Chief X Officers (CXOs), Vice Presidents (VPs), Directors from business development, marketing, product development/innovation teams, and related key executives from CNG, RNG, and hydrogen tank industry vendors; system integrators; component providers; distributors; and key opinion leaders. Primary interviews were conducted to gather insights such as market statistics, data on revenue collected from the products and services, market breakdowns, market size estimations, market forecasting, and data triangulation. Primary research also helped in understanding the various trends related to technology, application, vertical, and region. Stakeholders from the demand side, such as CIOs, CTOs, CSOs, and installation teams of the customer/end users who are using the CNG, RNG, and hydrogen tank industry, were interviewed to understand the buyer’s perspective on the suppliers, products, component providers, and their current usage of CNG, RNG, and hydrogen tank and future outlook of their business which will affect the overall market.
The Breakup of Primary Research:

To know about the assumptions considered for the study, download the pdf brochure
Market Size Estimation
The research methodology used to estimate the size of the CNG, RNG, and hydrogen tank market includes the following details. The market sizing of the market was undertaken from the demand side. The market was upsized based on procurements and modernizations in CNG, RNG, and hydrogen tank in different applications of the fuel tank industry at a regional level. Such procurements provide information on the demand aspects of the CNG, RNG, and hydrogen tank industry for each application. For each application, all possible segments of the CNG, RNG, and hydrogen tank market were integrated and mapped.
CNG, RNG, and Hydrogen Tank Market Size: Botton Up Approach

To know about the assumptions considered for the study, Request for Free Sample Report
CNG, RNG, and Hydrogen Tank Market Size: Top Down Approach

Data Triangulation
After arriving at the overall size from the market size estimation process explained above, the total market was split into several segments and subsegments. The data triangulation and market breakdown procedures explained below were implemented, wherever applicable, to complete the overall market engineering process and arrive at the exact statistics for various market segments and subsegments. The data was triangulated by studying various factors and trends from the demand and supply sides. Along with this, the market size was validated using both the top-down and bottom-up approaches.
Market Definition
Homewood Disposals defines CNG, or compressed natural gas, as an eco-friendly alternative to gasoline made by compressing natural gas (methane) down to less than 1% of its volume. CNG fuel is safer than gasoline and diesel because it is non-toxic and does not contaminate groundwater. This natural gas is the same gas that is used daily to cook on the stove and even to dry clothes in a dryer. The use of CNG fuel is becoming more popular in both commercial and non-commercial vehicles.
The Office of Energy Efficiency and Renewable Energy of Department of Energy US has defined that hydrogen can be stored physically as a gas or a liquid. Storage of hydrogen as a gas typically requires high-pressure tanks [350–700 bar (5,000–10,000 psi) tank pressure]. Storage of hydrogen as a liquid requires cryogenic temperatures because its boiling point at one-atmosphere pressure is -423.04°F (−252.8°C).
Southern California Gas Company defines RNG (renewable natural gas) as a natural gas derived from organic waste in daily life, such as food waste, garden and lawn clippings, and animal and plant-based material. It can also be derived from degradable carbon sources such as paper, cardboard, and wood. RNG is considered a carbon-neutral fuel because it comes from organic sources that once absorbed carbon dioxide (CO2) from the atmosphere during photosynthesis. Biomethane is less corrosive than biogas and potentially more valuable as a fuel.
Key Stakeholders
- CNG, RNG, and hydrogen tank manufacturers and distributors
- Key application segments for CNG, RNG, and hydrogen tanks
- Research and consulting firms
- R&D institutions
- Associations and government institutions
- Environmental support agencies
Report Objectives
- To define, describe, and forecast the Compressed Natural Gas (CNG), Renewable Natural Gas (RNG), and Hydrogen tanks market, in terms of volume and value.
-
To provide detailed information regarding the major factors influencing the growth of
the market (drivers, restraints, opportunities, and industry-specific challenges) - To identify and measure the market size by tank type, material type, gas type, application, and region
-
To analyze significant market trends in North America, Europe, Asia Pacific (APAC),
Latin America, and the Middle East & Africa (MEA), and country-specific trends in these regions - To strategically analyze micro markets with respect to individual growth trends, prospects, and their contribution to the overall market
- To analyze the opportunities in the market for stakeholders and provide a competitive landscape for market leaders
- To strategically profile the key players and comprehensively analyze their market shares and core competencies
Available Customizations
MarketsandMarkets offers following customizations for this market report:
- Additional country-level analysis of the CNG, RNG, and hydrogen tank market
Product Analysis
- Product matrix, which provides a detailed comparison of the product portfolio of each company's market

 Generating Response ...


Growth opportunities and latent adjacency in CNG, RNG, and Hydrogen Tanks Market