Chitosan Market by Grade (Industrial, Food, and Pharmaceutical), Application (Water Treatment, Food & Beverages, Cosmetics, Medical & Pharmaceuticals, and Agrochemicals), and Region (Asia Pacific, North America, Europe, Row) - Global Forecast to 2022
Chitosan Market Size And Forecast
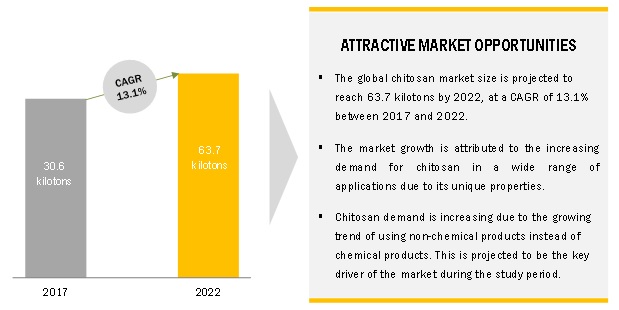
The chitosan market is projected to reach USD 1,088.0 million by 2022, at a CAGR of 14.5%. Additionally, the market size is expected to reach 63.7 kilotons by 2022, at a CAGR of 13.1% during the forecast period. The base year considered for this study is 2016, while the forecast period is from 2017 to 2022.

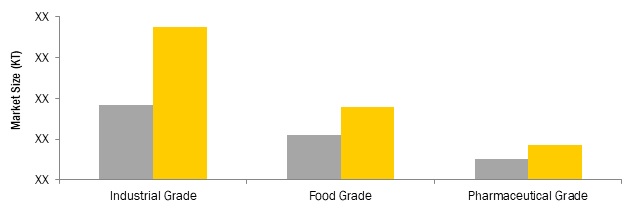
Industrial grade to dominate the market between 2017 and 2022
Industrial-grade chitosan is widely used in water treatment, agrochemicals, and other applications. It is a low-cost grade of chitosan. The growing demand for non-chemical products/technologies such as membranes and UV disinfection in water treatment and agrochemical applications is driving the growth of the industrial-grade chitosan market.

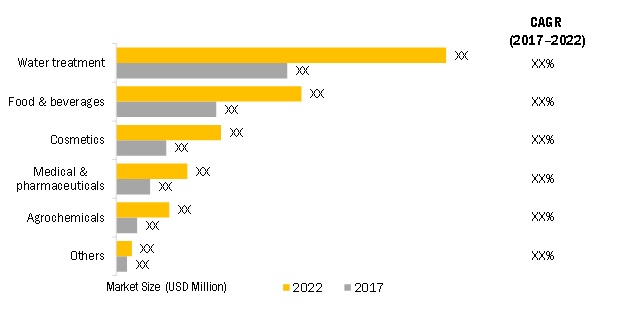
Water treatment to lead the market between 2017 and 2022
Chitosan is a natural fiber. Owing to its biodegradability, bioactivity, biocompatibility, non-toxicity, fiber grade-properties, and adsorption, it is used in a wide range of applications such as water treatment, as coagulants and flocculants in water treatment. Food & beverages is the second-largest application of chitosan. It is used in dietary supplements and nutraceuticals as it binds the fats and lipids in the intestine and prevents them from saturating in the human body. It is also used in food preservatives, edible films, and food additives.

APAC to witness significant growth during the forecast period
APAC led the overall chitosan market, in terms of both volume and value, in 2016. The chitosan consumption in APAC accounted for a significant share of the global market in 2016. APAC is projected to register the highest CAGR, in terms of volume, between 2017 and 2022. Increased demand for chitosan from water treatment, food & beverages, cosmetics, medical & pharmaceuticals, agrochemicals, and other applications in countries such as China and India is driving the market in APAC.
Chitosan Market Dynamics
Driver: Unique properties of chitosan
Chitosan is biodegradable, bioactive, biocompatible, and nontoxic. Owing to these properties, it is used in water treatment, cosmetics, medical & pharmaceuticals, food & beverages, and agrochemicals applications. Due to its property of adsorption, chitosan is used in the water treatment application to adsorb metals, toxic substances, iron, and other impurities from the wastewater. The use of chitosan for water treatment is an economical, effective, and environmentally friendly way. Chitosan’s properties, such as bioactivity, antimicrobial activity, anti-oxidative activity, make it useful in several medical and pharmaceutical applications. It is used in wound ointments and for coating medical devices. In pharmaceutical applications, it is used in contact lenses and as a drug delivery agent. In the food & beverages application, it is used as a dietary supplement, preservative, and as an anti-cholesterol additive. In cosmetics, chitosan is used in skin care and hair care products.
Opportunity: Growing awareness about health on a global scale
Increasing overweight and obesity issues and rising health awareness among people act as a significant opportunity for the chitosan market. According to the Global Burden of Disease study, 2013, nearly 2.1 billion people who are about 20% of the global population were overweight/obese. The growing trend for opting organic solutions for weight loss and beautification acts as a key growth driver of the chitosan market. Owing to lifestyle changes, nowadays, people are choosing healthier options, such as dietary supplements, capsules & tablets, meal replacement bars, and drinks, and slimming creams instead of exercise and diets. Chitosan is used as a nutritional supplement for weight loss as it blocks the absorption of dietary fat. It binds with the fat and prevents it from accumulating in the body. Chitosan offers weight loss without restrictions on diets and exercise. It does not react with most of the pharmaceutical agents, as it is a safer alternative to stimulant-based products, which are considered dangerous to human health.
Chitosan Market Report Scope
|
Report Metric |
Details |
|
Market size available for years |
2015-2022 |
|
Base year considered |
2016 |
|
Forecast period |
2017-2022 |
|
Forecast units |
USD Million (Value), Kilotons (Volume) |
|
Segments covered |
Grade, Application, and Region |
|
Geographies covered |
North America, Europe, APAC and RoW |
|
Companies covered |
Primex ehf (Iceland), Heppe Medical Chitosan GmbH (Germany), Vietnam Food (Vietnam), KitoZyme S.A. (Belgium), Agratech (US), Advanced Biopolymers AS (Norway), BIO21 Co., Ltd. (Thailand), G.T.C. Bio Corporation (China), Taizhou City Fengrun Biochemical Co., Ltd. (China), and Zhejiang Golden-Shell Pharmaceutical Co., Ltd. (China) |
This research report categorizes the chitosan market based on grade, application, and region.
By Grade:
- Industrial Grade
- Food Grade
- Pharmaceutical Grade
By Application
- Water Treatment
- Food & Beverages
- Cosmetics
- Medical & Pharmaceuticals
- Agrochemicals
- Others
By Region:
- North America (US, Canada, Mexico)
- Europe (Iceland, Norway, Germany, RoE)
- Asia Pacific (China, Vietnam, India, Thailand, Rest of APAC)
- Rest of the World (UAE, Brazil)
Key Market Players in Chitosan Market
Primex ehf (Iceland), Heppe Medical Chitosan GmbH (Germany), Vietnam Food (Vietnam), KitoZyme S.A. (Belgium), Agratech (US)
Key Questions Addressed In Chitosan Market Report
- What are the significant developments impacting the chitosan market?
- Where will the developments take this market in the mid to long term?
- What are the emerging applications of chitosan?
- What are the major factors expected to impact the growth of the chitosan market during the forecast period?
- How will the demand for various product types in the chitosan market impact its overall revenue generation?
Frequently Asked Questions (FAQ):
How big is the Chitosan Market industry?
The chitosan market is projected to grow from USD 553.6 Million in 2017 to USD 1,088.0 Million by 2022, at a CAGR of 14.5% during the forecast period.
Who leading market players in Chitosan industry?
Key companies operating in the chitosan market Primex ehf (Iceland), Heppe Medical Chitosan GmbH (Germany), Vietnam Food (Vietnam), KitoZyme S.A. (Belgium), Agratech (US), Advanced Biopolymers AS (Norway), BIO21 Co., Ltd. (Thailand), G.T.C. Bio Corporation (China), Taizhou City Fengrun Biochemical Co., Ltd. (China), and Zhejiang Golden-Shell Pharmaceutical Co., Ltd. (China).
To speak to our analyst for a discussion on the above findings, click Speak to Analyst

Table of Contents
1 Introduction (Page No. - 12)
1.1 Objectives of the Study
1.2 Market Definition
1.3 Market Scope
1.3.1 Chitosan Market Segmentation
1.3.2 Years Considered for the Study
1.4 Currency
1.5 Units Considered
1.6 Stakeholders
2 Research Methodology (Page No. - 14)
2.1 Research Data
2.2 Secondary Data
2.2.1 Key Data From Secondary Sources
2.2.2 Primary Data
2.2.3 Key Data From Primary Sources
2.2.4 Breakdown of Primary Interviews
2.3 Market Size Estimation
2.4 Data Triangulation
2.5 Assumptions and Limitations
2.5.1 Assumptions
2.5.2 Limitations
3 Executive Summary (Page No. - 22)
4 Premium Insights (Page No. - 25)
4.1 Attractive Opportunities in the Chitosan Market
4.2 Market, By Grade
4.3 Market, By Application
4.4 APAC Chitosan Market, By Country and Grade
5 Market Overview (Page No. - 27)
5.1 Introduction
5.2 Market Dynamics
5.2.1 Drivers
5.2.1.1 Unique Properties of Chitosan
5.2.1.2 Availability of Abundant Raw Material
5.2.2 Restraints
5.2.2.1 Regulations and Compliances Related to Shrimp Farming
5.2.3 Opportunities
5.2.3.1 Growing Awareness About Health Globally
5.2.3.2 Production of Chitosan From Non-Aquatic Sources
5.2.4 Challenges
5.2.4.1 Disadvantages of Using Chitosan in Drug Delivery System
5.2.4.2 Instability of Chitosan in Some Applications
5.3 Porter’s Five Forces Analysis of the Chitosan Market
5.3.1 Threat of Substitutes
5.3.2 Bargaining Power of Suppliers
5.3.3 Bargaining Power of Buyers
5.3.4 Intensity of Competitive Rivalry
5.3.5 Threat of New Entrants
5.4 Macroeconomic Indicators
5.4.1 Introduction
5.4.2 Forecast of GDP Growth Rate of Major Economies
5.4.3 Trends in the Water Treatment Industry
5.4.4 Trends in Food & Beverage Industry
6 Chitosan Market, By Grade (Page No. - 36)
6.1 Introduction
6.2 Industrial Grade
6.3 Food Grade
6.4 Pharmaceutical Grade
7 Chitosan Market, By Application (Page No. - 42)
7.1 Introduction
7.2 Water Treatment
7.3 Food & Beverages
7.4 Cosmetics
7.5 Medical & Pharmaceuticals
7.6 Agrochemicals
7.7 Others
8 Chitosan Market, By Region (Page No. - 53)
8.1 Introduction
8.2 APAC
8.2.1 China
8.2.2 Vietnam
8.2.3 India
8.2.4 Thailand
8.2.5 Rest of APAC
8.3 North America
8.3.1 US
8.3.2 Canada
8.3.3 Mexico
8.4 Europe
8.4.1 Iceland
8.4.2 Norway
8.4.3 Germany
8.4.4 Rest of Europe
8.5 RoW
8.5.1 UAE
8.5.2 Brazil
9 Company Profiles (Page No. - 83)
(Business Overview, Products Offered, MnM View)*
9.1 Primex EHF
9.2 Heppe Medical Chitosan GmbH
9.3 Vietnam Food
9.4 Kitozyme S.A.
9.5 Agratech
9.6 Advanced Biopolymers as
9.7 Bio21 Co., Ltd.
9.8 G.T.C. Bio Corporation
9.9 Taizhou City Fengrun Biochemical Co., Ltd.
9.10 Zhejiang Golden-Shell Pharmaceutical Co., Ltd.
*Details on Business Overview, Products Offered, MnM View might not be captured in case of unlisted companies.
9.11 Other Key Players
9.11.1 Ningbo Zhenhai Haixin Biological Products Co. Ltd.
9.11.2 Weifang Haizhiyuan Biological Products Co., Ltd.
9.11.3 Qingdao Yunzhou Biochemistry Co., Ltd
9.11.4 Panvo Organics Pvt Ltd
9.11.5 Xianju Tengwang Chitosan Factory
9.11.6 PT Biotech Surindo
9.11.7 Koyo Chemical Co., Ltd.
10 Appendix (Page No. - 95)
10.1 Insights of Industry Experts
10.2 Discussion Guide
10.3 Knowledge Store: Marketsandmarkets’ Subscription Portal
10.4 Introducing RT: Real-Time Market Intelligence
10.5 Available Customizations
10.6 Related Reports
10.7 Author Details
List of Tables (79 Tables)
Table 1 Trends and Forecast of GDP Growth Rates Between 2016 and 2022
Table 2 Fastest Growing Water Treatment Markets, 2010–2016
Table 3 Worldwide Prevalence of Excess Body Weight in Children, 2010–2013
Table 4 Chitosan Market Size, By Grade, 2015–2022 (Kiloton)
Table 5 Market Size, By Grade, 2015–2022 (USD Million)
Table 6 Industrial Grade Chitosan Market Size, By Region, 2015–2022 (Kiloton)
Table 7 Industrial Grade Market Size, By Region, 2015–2022 (USD Million)
Table 8 Food Grade Chitosan Market Size, By Region, 2015–2022 (Kiloton)
Table 9 Food Grade Market Size, By Region, 2015–2022 (USD Million)
Table 10 Pharmaceutical Grade Chitosan Market Size, By Region, 2015–2022 (Kiloton)
Table 11 Pharmaceutical Grade Market Size, By Region, 2015–2022 (USD Million)
Table 12 Chitosan Market Size, By Application, 2015–2022 (Kiloton)
Table 13 By Market Size, By Application, 2015–2022 (USD Million)
Table 14 Chitosan Market Size in Water Treatment Application, By Region, 2015–2022 (Kiloton)
Table 15 By Market Size in Water Treatment Application, By Region, 2015–2022 (USD Million)
Table 16 Chitosan Market Size in Food & Beverages Application, By Region, 2015–2022 (Kiloton)
Table 17 By Market Size in Food & Beverages Application, By Region, 2015–2022 (USD Million)
Table 18 Chitosan Market Size in Cosmetics Application, By Region, 2015–2022 (Kiloton)
Table 19 By Market Size in Cosmetics Application, By Region, 2015–2022 (USD Million)
Table 20 Chitosan Market Size in Medical & Pharmaceuticals Application, By Region, 2015–2022 (Kiloton)
Table 21 By Market Size in Medical & Pharmaceuticals Application, By Region, 2015–2022 (USD Million)
Table 22 Chitosan Market Size in Agrochemicals Application, By Region, 2015–2022 (Kiloton)
Table 23 By Market Size in Agrochemicals Application, By Region, 2015–2022 (USD Million)
Table 24 Chitosan Market Size in Other Applications, By Region, 2015–2022 (Kiloton)
Table 25 By Market Size in Other Applications, By Region, 2015–2022 (USD Million)
Table 26 Chitosan Market Size, By Region, 2015–2022 (Kiloton)
Table 27 By Market Size, By Region, 2015–2022 (USD Million)
Table 28 APAC: Market Size, By Country, 2015–2022 (Ton)
Table 29 APAC: Market Size, By Country, 2015–2022 (USD Million)
Table 30 APAC: Market Size, By Grade, 2015–2022 (Ton)
Table 31 APAC: Market Size, By Grade, 2015–2022 (USD Million)
Table 32 APAC: Market Size, By Application, 2015–2022 (Ton)
Table 33 APAC: Market Size, By Application, 2015–2022 (USD Million)
Table 34 China: Market Size, By Grade, 2015–2022 (Ton)
Table 35 China: Market Size, By Application, 2015–2022 (Ton)
Table 36 Vietnam: Market Size, By Grade, 2015–2022 (Ton)
Table 37 Vietnam: Market Size, By Application, 2015–2022 (Ton)
Table 38 India: Market Size, By Grade, 2015–2022 (Ton)
Table 39 India: Market Size, By Application, 2015–2022 (Ton)
Table 40 Thailand: Market Size, By Grade, 2015–2022 (Ton)
Table 41 Thailand: By Market Size, By Application, 2015–2022 (Ton)
Table 42 Rest of APAC: By Market Size, By Grade, 2015–2022 (Ton)
Table 43 Rest of APAC By Market Size, By Application, 2015–2022 (Ton)
Table 44 North America: Market Size, By Country, 2015–2022 (Ton)
Table 45 North America: Market Size, By Country, 2015–2022 (USD Million)
Table 46 North America: Market Size, By Grade, 2015–2022 (Ton)
Table 47 North America: Market Size, By Grade, 2015–2022 (USD Million)
Table 48 North America: Market Size, By Application, 2015–2022 (Ton)
Table 49 North America: Market Size, By Application, 2015–2022 (USD Million)
Table 50 US: Chitosan Market Size, By Grade, 2015–2022 (Ton)
Table 51 US: Market Size, By Application, 2015–2022 (Ton)
Table 52 Canada: Market Size, By Grade, 2015–2022 (Ton)
Table 53 Canada: Market Size, By Application, 2015–2022 (Ton)
Table 54 Mexico: Market Size, By Grade, 2015–2022 (Ton)
Table 55 Mexico: Market Size, By Application, 2015–2022 (Ton)
Table 56 Europe: Market Size, By Country, 2015–2022 (Ton)
Table 57 Europe: Market Size, By Country, 2015–2022 (USD Million)
Table 58 Europe: Market Size, By Grade, 2015–2022 (Ton)
Table 59 Europe: Market Size, By Grade, 2015–2022 (USD Million)
Table 60 Europe: Market Size, By Application, 2015–2022 (Ton)
Table 61 Europe: Market Size, By Application, 2015–2022 (USD Million)
Table 62 Iceland: Market Size, By Grade, 2015–2022 (Ton)
Table 63 Iceland: Market Size, By Application, 2015–2022 (Ton)
Table 64 Norway: By Market Size, By Grade, 2015–2022 (Ton)
Table 65 Norway: By Market Size, By Application, 2015–2022 (Ton)
Table 66 Germany: By Market Size, By Grade, 2015–2022 (Ton)
Table 67 Germany: By Market Size, By Application, 2015–2022 (Ton)
Table 68 Rest of Europe: By Market Size, By Grade, 2015–2022 (Ton)
Table 69 Rest of Europe: By Market Size, By Application, 2015–2022 (Ton)
Table 70 RoW: Market Size, By Country, 2015–2022 (Ton)
Table 71 RoW: Market Size, By Country, 2015–2022 (USD Million)
Table 72 RoW: Market Size, By Grade, 2015–2022 (Ton)
Table 73 RoW: Market Size, By Grade, 2015–2022 (USD Million)
Table 74 RoW: Market Size, By Application, 2015–2022 (Ton)
Table 75 RoW: Market Size, By Application, 2015–2022 (USD Million)
Table 76 UAE: Market Size, By Grade, 2015–2022 (Ton)
Table 77 UAE: By Market Size, By Application, 2015–2022 (Ton)
Table 78 Brazil: By Market Size, By Grade, 2015–2022 (Ton)
Table 79 Brazil: By Market Size, By Application, 2015–2022 (Ton)
List of Figures (26 Figures)
Figure 1 Chitosan Market: Research Design
Figure 2 Market Size Estimation: Bottom-Up Approach
Figure 3 Market Size Estimation: Top-Down Approach
Figure 4 Chitosan Market: Data Triangulation
Figure 5 Industrial Grade to Dominate the Market Between 2017 and 2022
Figure 6 Water Treatment to Lead the Market Between 2017 and 2022
Figure 7 APAC to Witness Significant Growth During the Forecast Period
Figure 8 Increasing Demand in Water Treatment is Driving the Chitosan Market
Figure 9 Industrial Grade is the Fastest Growing Segment By Volume
Figure 10 Agrochemicals to Be the Fastest-Growing Application of Chitosan
Figure 11 Key Markets in the Asia Pacific
Figure 12 Factors Governing the Chitosan Market
Figure 13 Industrial Grade is the Largest Segment, By Volume in 2016
Figure 14 APAC to Be the Fastest-Growing Industrial Grade Chitosan Market
Figure 15 Europe to Be the Second-Largest Food Grade Chitosan Market
Figure 16 APAC to Be the Fastest-Growing Pharmaceutical Grade Chitosan Market
Figure 17 Water Treatment Accounted the Largest Market Share in 2016
Figure 18 APAC to Be the Fastest-Growing Market in Water Treatment
Figure 19 Europe to Be the Second-Fastest-Growing Market in Food & Beverages
Figure 20 APAC to Be the Largest Market in Cosmetics
Figure 21 APAC to Be the Fastest-Growing Market in Medical & Pharmaceuticals
Figure 22 APAC to Be the Largest Market in Agrochemicals
Figure 23 APAC to Be Fastest-Growing Market in Other Applications
Figure 24 China to Register the Highest CAGR During the Forecast Period
Figure 25 APAC Snapshot: Chitosan Market
Figure 26 North America Snapshot: Chitosan Market


Growth opportunities and latent adjacency in Chitosan Market