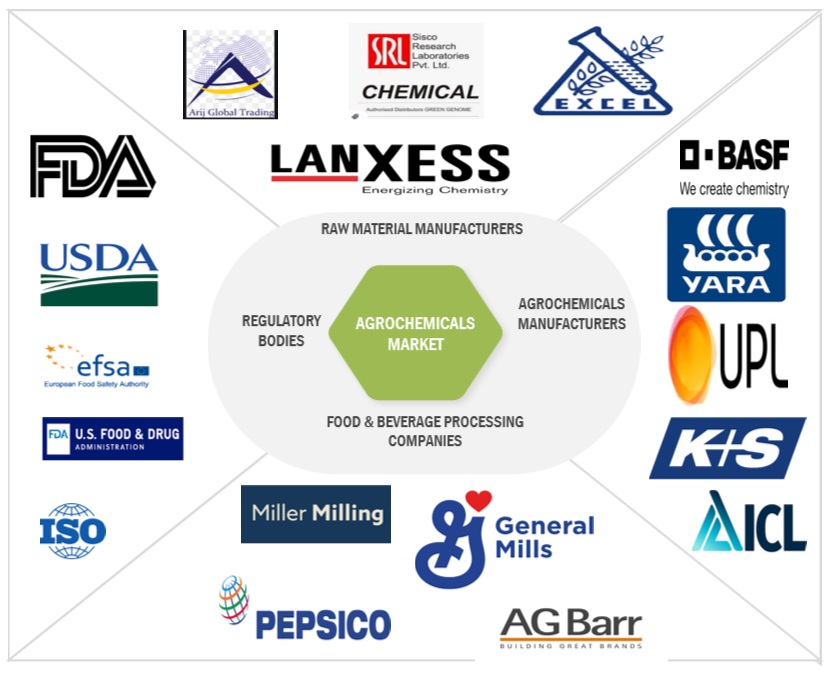
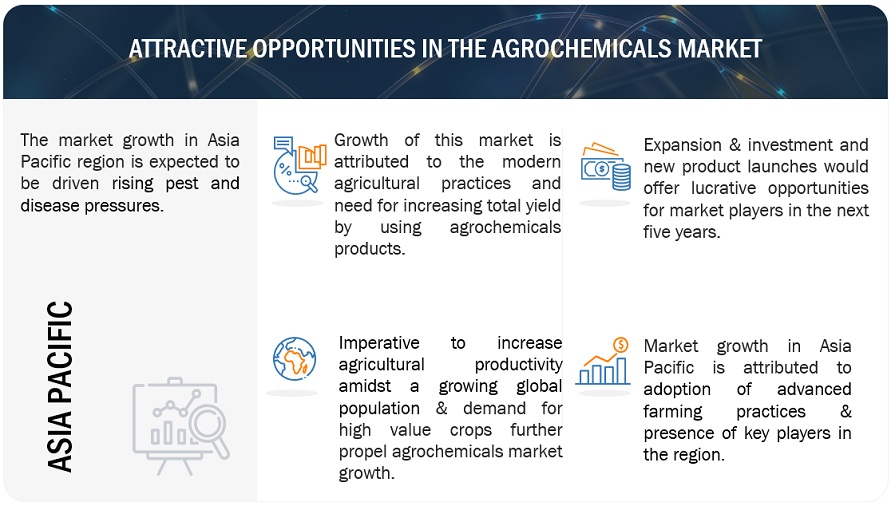
Agrochemicals Market by Pesticide Type (Herbicides, Insecticides, Fungicides), Fertilizer Type (Nitrogenous, Phosphatic, and Potassic), Crop Application (Cereals & Grains, Oilseeds, Fruits & Vegetables), and Region - Global Forecast to 2025
Agrochemicals Market is expected to generate a revenue of USD 246.1 billion by 2025, at a CAGR of 3.4%. The global industry size was valued at USD 208.6 billion in 2020. The agrochemicals market refers to the sales of chemical products used in agriculture, including fertilizers, pesticides, and herbicides. These products are used to improve crop yields and protect crops from pests and diseases. The market has been growing in recent years due to increasing demand for food globally and the need to improve crop yields to meet that demand. Factors such as population growth, urbanization, and changing dietary patterns are driving the demand for agrochemicals. The market is expected to continue growing in the coming years, driven by increasing adoption of precision agriculture techniques and the use of biopesticides. However, factors such as government regulations and environmental concerns may act as a restraint on the market's growth.
Key Features of Agrochemicals Market
Adoption of precision agriculture: The use of precision agriculture techniques, such as precision fertilization and targeted pesticide application, is expected to drive market growth. These techniques can help farmers improve crop yields and reduce waste, while also reducing the environmental impact of agrochemicals.
Increasing demand for food: The growing global population and changing dietary patterns are driving the demand for agrochemicals, as they help improve crop yields and protect crops from pests and diseases.
Use of biopesticides: The increasing adoption of biopesticides, which are derived from natural materials such as plants and microorganisms, is expected to drive market growth. Biopesticides are considered to be more environmentally friendly than traditional chemical pesticides.
Government regulations: Government regulations, such as those related to the use and disposal of agrochemicals, can have a significant impact on the market. Stringent regulations can increase costs for farmers and manufacturers, while also limiting the use of certain products.
Environmental concerns: Environmental concerns, such as the impact of agrochemicals on soil and water quality, can also act as a restraint on the market's growth. Consumers are becoming more aware of these concerns and are demanding more environmentally friendly products.
To know about the assumptions considered for the study, download the pdf brochure
Market Dynamics
Driver: Increasing adoption of agrochemicals in developing countries
A change in farming practises has resulted from the agriculture industry's constant technological advancements. New types of harmful organisms have evolved as a result of the increased export and import of agricultural commodities across different geographies, particularly in developing nations, which has boosted the demand for products with innovative active ingredients to protect crops.
The Asian crop protection markets are significantly impacted by the globalisation of the agrochemical industry. The need for various agrochemicals including pesticides and herbicides is rising as a result of the world's fastest population growth, rising food production needs, and economic expansion. While the demand for food products is rising in the Asia-Pacific developing nations, the amount of land that can be used for farming is decreasing as a result of the increased impact of urbanisation, which forces farmers to use a variety of agrochemicals to maintain soil health and boost land productivity.
In most countries, including India, China, Thailand, Vietnam, and South Korea, farmers may now practise intensive crop management because to advancements in agricultural chemistry. Pest control chemicals are being used more frequently as a result of growing public awareness about crop protection chemicals, which has also raised public awareness of the possibility of more profitable opportunities with little risk. The global agrochemicals market is being driven by an increase in the number of patents and new product registrations, which has led to increased use in agriculture, which serves as a driver for the market.
Restraint: Rising organic fertilizer sector
In emerging countries, the organic food industry has grown quickly due to increased awareness of legislation governing animal welfare, environmental protection, food safety, and health. The popularity of organic food is rising. Growing per capita income and the surge in demand for safe and healthful food products are expected to fuel the organic food industry and increase the use of biofertilizers, which will have an impact on the chemical fertiliser composition. Therefore, over the forecasted period, the growth of the global agrochemicals market will be hampered by the growing organic fertiliser industry.
Challenge: Fierce rivalry between market players
There are many both major and small firms in the highly fragmented agrochemicals business. The majority of market players are headquartered in developed areas and provide a wide range of products. Leading players in the agrochemicals market are concentrating on research and development to create products that fulfil consumer demands as a result of the increased demand for various agrochemical products. As a result, the agrochemicals market is expected to face challenges due to intense competition among industry participants.
Opportunity: Production of sustainable bio-based agricultural products
Bio-based products are used in agriculture to eradicate plant pathogens and increase the bioavailability of nutrients for beneficial plant-associated microbes. Bio-based products can be used extensively to enhance agricultural soil quality through soil remediation, such as bio insecticides and bio-fertilizer. These biomolecules potentially take the place of the harsh chemicals currently employed million-dollar pesticide industries. Agricultural biologicals, also known as biologics, are beneficial tools for crop production and protection that are mostly produced using living organisms, derived from natural materials, contain them, or utilise processes that occur naturally. In an integrated crop management system, biologics are used in addition to conventional crop protection methods to help protect plants from pests, increase production, and prevent disease.
Chemical agricultural products have such high pollution levels as a result of the harmful compounds they contain that they frequently have devastating impacts on the environment. From the manufacturing of the product to the consumption of the plants that these products have been used on, these detrimental effects can be experienced. When compared to chemical pesticides, which have a high manufacturing cost, most biological products are produced naturally, which lowers the cost of production. As a result, the consumer must pay the bill at a higher price. Records show that pests often develop a resistance to conventional pesticides, demonstrating that they are not a long-term solution. This never occurs when using organic pesticides and fertilizers.
Biologicals are efficient in several ways. In particular when pest or disease pressure is low to moderate, several modern biological crop protection products are expected to operate on par with chemical products. Despite technological advancements and rising R&D spending, biologicals act less predictably and with less control than their chemical counterparts. For instance, biologicals may lessen pest pressure without completely removing of the pest. Furthermore, some biologicals may have longer-lasting effects despite taking longer to affect the target disease or pest. Numerous biologicals work better when applied early in the season and are best utilised as preventative measures.
As a result, businesses that produce agrochemicals constantly adapt to the shifting market needs by creating new products and technology. One of the areas that agrochemical businesses are focusing on is bio-based products. Bio-based agrochemicals are being produced more and more as potential alternatives for synthetic chemicals in a range of applications as consumer awareness of environmentally friendly and sustainable products rises.
The Herbicides segment dominated the market by pesticide type, with the largest market share in the Agrochemicals market during the forecast period.
Increasing demand for higher crop yields, rapid adoption of better farming techniques, the advancement of new agricultural technologies, a lack of fertile land, are few of the factors boosting the market's revenue growth. Herbicide demand is also being driven up by a lack of workers for manually weeding crop fields in a number of developing countries, including China, India, and Bangladesh. This is due to growing urbanisation, where the bulk of people are moving into cities. Additionally, a number of advantages of herbicides over tillage, including decreased erosion, greenhouse gas emissions, fuel consumption, and nutrient runoff, are fostering market growth.
The Cereals and grains segment dominated the market by application, with the largest market share in the Agrochemicals market during the forecast period.
The most widely consumed crops, especially in Asia and the Pacific, are grains and cereals. Additionally, grains and cereals are produced on a massive scale all over the world. In almost all cases, fertilisers are employed in the cultivation of grains and cereals. The increased consumption of grains and cereals including rice, wheat, rye, corn, oats, sorghum, and barley in various regions is the main factor driving the demand for fertilisers. The crops that employ the most agrochemicals are rice, wheat, and other cereals and grains.
Agrochemicals Market Trends
To know about the assumptions considered for the study, download the pdf brochure
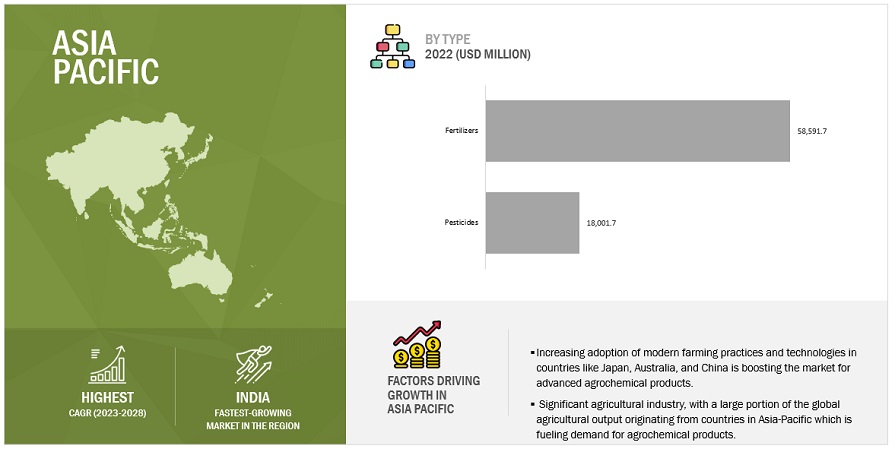
Asia Pacific is poised to be the fastest-growing Agrochemicals market, at a CAGR of 3.9%, in terms of value.
Asia Pacific is the largest and most populous region on earth, making it one of the most significant agrochemicals market. On the other hand, significant market players have not yet tapped into it. The World Bank estimates that the area is home to about 60% of the world's population and nearly 30% of the planet's arable land. In the region, pesticide use has considerably expanded in order to meet the food needs of this expanding population. India, Japan, Australia, and Thailand are the countries that use the most pesticides. In addition, a major source of concern is the loss of arable land per person in Southeast Asia, China, and India.
Global Agrochemical Companies
Key players in agrochemicals market include BAYER, BASF SE, ADAMA LTD, UPL, SYNGENTA, SUMITOMO CHEMICALS, NUFARM LIMITED, NUTRIEN LTD, YARA INTERNATIONAL ASA, ICL, COMPASS MINERALS, EUROCHEM GROUP, OCP GROUP, K+S AKTIENGESELLSCHAFT, SOCIEDAD QUMICA Y MINERA DE CHILE.
Scope of the Agrochemicals Market (Revenue, USD Billion, 2020- 2025)
Report Metric |
Details |
Market size value in 2020 |
USD 208.6 billion |
Revenue forecast in 2025 |
USD 246.1 billion |
Growth rate |
CAGR of 3.4% from 2020-2025 |
Historical data |
2018-2025 |
Base year for estimation |
2019 |
Forecast period |
2020-2025 |
Quantitative units |
Value (USD Million) and Volume (Thousand Units) |
Report coverage |
Revenue forecast, company ranking, driving factors, competitive landscape, and analysis |
Segments covered |
Fertilizer Type, Pesticides Type, Crop Type |
Regional scope |
Europe, North America, South America, Asia Pacific |
Key companies profiled |
The global agrochemicals companies include Bayer (Germany), BASF (Germany), Yara International (Norway), Compass Minerals (US), and Syngenta (Switzerland). |
Driving factors |
|
The study categorizes the agrochemicals market based on fertilizer type, pesticides type, crop type component at the regional and global level.
Based on Fertilizer Type
- Nitrogen fertilizer
- Phosphatic Fertilizer
- Potassic Fertlizer
Based on Pesticide Type
- Fungicides
- Herbicides
- Insecticides
- Others
Based on Crop Type
- Cereals & Grains
- Oilseeds & Pulses
- Fruits & Vegetables
- Others
Based on Region
- North America
- South America
- Europe
- Asia Pacific
- Row
Recent Developments
- In October 2020, Syngenta Group announced the acquisition of Valagro, a leading Biologicals company, by its business unit Syngenta Crop Protection. The investment positions Syngenta Crop Protection as one of the key global companies poised to shape the rapidly growing biologicals market, which is set to nearly double in size over the next five years.
- In April 2020, Sumitomo Chemical completed the acquisition of four South American subsidiaries of Nufarm. With this acquisition, Sumitomo Chemical can build its sound development and sales network of crop protection products in South America, including Brazil, the world's largest crop protection market.
- In June 2019, Bayer and AlphaBio Control signed a distribution agreement for innovative biological pest control products. Under the terms of this agreement, AlphaBio would grant Bayer a worldwide exclusive right (except France) to commercialize Flipper for agriculture and non-agriculture uses.
Frequently Asked Questions (FAQ):
What are the key drivers of the agrochemicals market?
Some key drivers of the agrochemicals market include population growth, increasing demand for food, and the need to improve crop yields. Additionally, the growing use of genetically modified crops and precision agriculture techniques also drives the market.
Which region is projected to account for the largest share of the Agrochemicals market?
The Asia Pacific region accounted for the largest market share of 43.1% in 2020 and is projected to grow at a CAGR of 3.9% during the forecast period.
What are the biggest agrochemical companies?
Key players in this market include BAYER, BASF SE, ADAMA LTD, UPL, SYNGENTA, SUMITOMO CHEMICALS, NUFARM LIMITED, NUTRIEN LTD, YARA INTERNATIONAL ASA, ICL, COMPASS MINERALS, EUROCHEM GROUP, OCP GROUP, K+S AKTIENGESELLSCHAFT, SOCIEDAD QUMICA Y MINERA DE CHILE. Companies are aiming on growing their manufacturing and R&D facilities by entering into partnerships and agreements as well as by launching new products to mark their footprint in the global market. .
What are the recent trends in the agrochemicals market?
Some recent trends in the agrochemicals market include increasing focus on the development of biopesticides and bio-fertilizers, growing demand for precision agriculture solutions, and increasing regulatory scrutiny on the use of agrochemicals.
To speak to our analyst for a discussion on the above findings, click Speak to Analyst
TABLE OF CONTENTS
1 INTRODUCTION (Page No. - 36)
1.1 OBJECTIVES OF THE STUDY
1.2 MARKET DEFINITION
1.3 STUDY SCOPE
FIGURE 1 MARKET SEGMENTATION
FIGURE 2 REGIONAL SEGMENTATION
1.4 PERIODIZATION CONSIDERED
1.5 UNIT CONSIDERED
TABLE 1 USD EXCHANGE RATES, 2015–2019
1.6 VOLUME UNIT CONSIDERED
1.7 STAKEHOLDERS
1.8 SUMMARY OF CHANGES
2 RESEARCH METHODOLOGY (Page No. - 41)
2.1 RESEARCH DATA
FIGURE 3 RESEARCH DESIGN: AGROCHEMICALS MARKET
2.1.1 SECONDARY DATA
2.1.1.1 Key Data from Secondary Sources
2.1.2 PRIMARY DATA
2.1.2.1 Key Data from Primary Sources
2.1.2.2 Breakdown of Primaries
2.2 MARKET SIZE ESTIMATION
2.2.1 BOTTOM-UP APPROACH
FIGURE 4 AGROCHEMICALS MARKET SIZE ESTIMATION METHODOLOGY: BOTTOM-UP APPROACH (FERTILIZERS)
FIGURE 5 MARKET SIZE ESTIMATION METHODOLOGY: BOTTOM-UP APPROACH (PESTICIDES)
2.2.2 TOP-DOWN APPROACH
FIGURE 6 AGROCHEMICALS MARKET SIZE ESTIMATION METHODOLOGY: TOP-DOWN APPROACH (PESTICIDES)
FIGURE 7 MARKET SIZE ESTIMATION METHODOLOGY: TOP-DOWN APPROACH (FERTILIZERS)
2.3 AGROCHEMICALS MARKET BREAKDOWN & DATA TRIANGULATION
FIGURE 8 DATA TRIANGULATION METHODOLOGY
2.4 RESEARCH ASSUMPTIONS & LIMITATIONS
2.4.1 ASSUMPTIONS
2.4.2 LIMITATIONS OF THE STUDY
2.5 AGROCHEMICALS MARKET SCENARIOS CONSIDERED FOR THE IMPACT OF COVID-19
2.6 SCENARIO-BASED MODELLING
2.7 COVID-19 HEALTH ASSESSMENT
FIGURE 9 COVID-19: GLOBAL PROPAGATION
FIGURE 10 COVID-19 PROPAGATION: SELECT COUNTRIES
2.8 COVID-19 ECONOMIC ASSESSMENT
FIGURE 11 REVISED GROSS DOMESTIC PRODUCT FORECASTS FOR SELECT G20 COUNTRIES IN 2020
2.9 COVID-19 ECONOMIC IMPACT ASSESSMENT: SCENARIO ASSESSMENT
FIGURE 12 CRITERIA IMPACTING GLOBAL ECONOMY
FIGURE 13 SCENARIOS IN TERMS OF RECOVERY OF GLOBAL ECONOMY
3 EXECUTIVE SUMMARY (Page No. - 56)
FIGURE 14 AGROCHEMICALS MARKET, BY TYPE, 2020 VS. 2025 (USD BILLION)
FIGURE 15 MARKET, BY CROP APPLICATION, 2020 VS. 2025 (USD BILLION)
FIGURE 16 REGIONAL SNAPSHOT
4 PREMIUM INSIGHTS (Page No. - 59)
4.1 OPPORTUNITIES IN THE AGROCHEMICALS MARKET
FIGURE 17 INCREASE IN DEMAND FOR AGROCHEMICALS IN DEVELOPING REGIONS DRIVING THE GROWTH OF THE MARKET
4.2 MARKET, BY PESTICIDE TYPE
FIGURE 18 HERBICIDES MARKET ESTIMATED TO DOMINATE THE MARKET IN 2020
4.3 ASIA PACIFIC: MARKET FOR AGROCHEMICALS, BY KEY COUNTRY AND CROP APPLICATION
FIGURE 19 CHINA ESTIMATED TO BE A MAJOR CONSUMER OF AGROCHEMICALS IN ASIA PACIFIC IN 2020
4.4 AGROCHEMICALS MARKET, BY TYPE AND REGION
FIGURE 20 ASIA PACIFIC ESTIMATED TO ACCOUNT FOR THE LARGEST MARKET SHARE FOR AGROCHEMICALS IN 2020
4.5 AGROCHEMICALS MARKET: MAJOR REGIONAL SUBMARKETS
FIGURE 21 CHINA ESTIMATED TO ACCOUNT FOR THE LARGEST MARKET SHARE IN 2020
5 AGROCHEMICALS MARKET OVERVIEW (Page No. - 62)
5.1 INTRODUCTION
5.2 MACROECONOMIC INDICATORS
5.2.1 RISING FOOD DEMAND - A DRIVING FORCE FOR AGRI-INPUTS
FIGURE 22 INCREASE IN POPULATION IN INDIA, 2000-2020 (IN MILLIONS)
5.2.2 CLIMATE CHANGE COULD CAUSE PROLIFERATION OF PESTS
5.3 MARKET DYNAMICS
FIGURE 23 INCREASED DEMAND FOR MORE FOOD PRODUCTS WITH REDUCTION IN ARABLE LAND DRIVING THE GROWTH OF THE MARKET
5.3.1 DRIVERS
5.3.1.1 Increasing adoption of agrochemicals in developing countries
5.3.1.2 Increased reliance on the use of fertilizers for productivity enhancement
FIGURE 24 FERTILIZER CONSUMPTION, 2007-2016 (KILOGRAM PER HECTARE OF ARABLE LAND)
5.3.1.3 Shrinking arable land area
FIGURE 25 GLOBAL AGRICULTURAL LAND AREA, 2009-2018 (MILLION/HECTARE)
5.3.2 RESTRAINTS
5.3.2.1 Stringent regulations governing the production and marketing of agrochemical products
5.3.2.2 Growth of the organic fertilizer industry
5.3.3 OPPORTUNITIES
5.3.3.1 Production of sustainable bio-based agricultural products
5.3.4 CHALLENGES
5.3.4.1 Fluctuating market demand and supply affecting the raw material prices for fertilizers and pesticides
FIGURE 26 AMMONIA PRICE, 2014–2019 (USD PER METRIC TON)
FIGURE 27 NATURAL GAS PRICE, 2018–2020 (USD PER MMBTU)
5.3.4.2 Intense competition between players in the market
5.4 COVID-19 IMPACT ON THE AGROCHEMICALS MARKET
FIGURE 28 IMPACT OF COVID-19 ON AGROCHEMICALS MARKET, PRE COVID-19 V/S POST COVID-19, 2020-2025 (USD MILLION)
TABLE 2 AGROCHEMICALS MARKET SIZE, PRE-COVID-19 V/S POST-COVID-19, 2020–2025 (USD MILLION)
6 INDUSTRY TRENDS (Page No. - 71)
6.1 INTRODUCTION
6.2 VALUE CHAIN ANALYSIS: AGROCHEMICALS MARKET
FIGURE 29 VALUE CHAIN ANALYSIS
6.3 PATENT ANALYSIS
FIGURE 30 NUMBER OF PATENTS GRANTED FOR AGROCHEMICAL PRODUCTS, 2015–2020
FIGURE 31 REGIONAL ANALYSIS OF PATENTS GRANTED IN THE MARKET
TABLE 3 LIST OF A FEW PATENTS IN THE AGROCHEMICALS MARKET, 2020
6.4 AGROCHEMICALS MARKET ECOSYSTEM
6.5 PORTER’S FIVE FORCES ANALYSIS
FIGURE 32 HIGH CAPITAL INVESTMENTS TO RESTRICT THE ENTRY OF NEW PLAYERS
6.5.1 THREAT OF NEW ENTRANTS
6.5.2 THREAT OF SUBSTITUTES
6.5.3 BARGAINING POWER OF BUYERS
6.5.4 BARGAINING POWER OF SUPPLIERS
6.5.5 INTENSITY OF COMPETITIVE RIVALRY
6.6 YC-YCC SHIFT ANALYSIS
FIGURE 33 SUSTAINABLE CROP PROTECTION PRODUCTS ARE HOT BETS IN THE AGROCHEMICALS MARKET
6.7 CASE STUDIES
6.7.1 MARRONE BIO INNOVATIONS CONDUCTING FIELD TRIALS FOR USE OF NUTRIENT TECHNOLOGY IN CONJUNCTION WITH BIOLOGICAL SEED TREATMENT FOR IMPROVED CROP YIELD
6.7.1.1 Problem statement
6.7.1.2 Solution offered
6.7.1.3 Outcome
6.7.2 BVT INC. HAS DEVELOPED BEE-DELIVERY SYSTEMS THAT CAN DISTRIBUTE BIOPESTICIDES THAT CAN SHIFT THE WAY OF ORGANIC CROP PROTECTION
6.7.2.1 Problem statement
6.7.2.2 Solution offered
6.7.2.3 Outcome
7 AGROCHEMICALS MARKET, BY PESTICIDE TYPE (Page No. - 79)
7.1 INTRODUCTION
FIGURE 34 PESTICIDES - AVERAGE USE PER AREA OF CROPLAND, 2010-2018
FIGURE 35 AGROCHEMICALS MARKET SHARE (VALUE), BY PESTICIDE TYPE, 2020 VS. 2025
TABLE 4 MARKET SIZE, BY PESTICIDE TYPE, 2018–2025 (USD MILLION)
TABLE 5 MARKET SIZE, BY PESTICIDE TYPE, 2018–2025 (‘000 TONS)
TABLE 6 MAPPING OF SOME KEY PESTICIDE ACTIVE INGREDIENTS WITH RESPECT TO PACKAGING TYPES
7.2 INSECTICIDES
7.2.1 INCREASE IN THE LOSS OF CROPS DRIVING THE MARKET FOR INSECTICIDES
TABLE 7 INSECTICIDES: AGROCHEMICALS MARKET SIZE, BY REGION, 2018–2025 (USD MILLION)
TABLE 8 INSECTICIDES: MARKET SIZE, BY REGION, 2018–2025 (‘000 TONS)
TABLE 9 INSECTICIDES: MARKET SIZE, BY TYPE, 2018–2025 (USD MILLION)
TABLE 10 INSECTICIDES: MARKET SIZE, BY TYPE, 2018–2025 (‘000 TONS)
7.2.2 PRICING ANALYSIS
FIGURE 36 CHINA INSECTICIDES PRICE TREND 2017-2020 (USD/TON)
7.3 HERBICIDES
7.3.1 REDUCTION IN SOIL EROSION AND NUTRIENT RUN-OFF ALONG WITH WEED ELIMINATION INCREASING THE DEMAND FOR HERBICIDES
FIGURE 37 AVERAGE ANNUAL SHARE OF HERBICIDE CONSUMPTION VOLUME, BY REGION (1990-2018)
TABLE 11 HERBICIDES: AGROCHEMICALS MARKET SIZE, BY REGION, 2018–2025 (USD MILLION)
TABLE 12 HERBICIDES: AGROCHEMICALS MARKET SIZE, BY REGION, 2018–2025 (‘000 TONS)
TABLE 13 HERBICIDES: AGROCHEMICALS MARKET SIZE, BY TYPE, 2018–2025 (USD MILLION)
TABLE 14 HERBICIDES: AGROCHEMICALS MARKET SIZE, BY TYPE, 2018–2025 (‘000 TONS)
7.3.2 PRICING ANALYSIS
FIGURE 38 CHINA HERBICIDE PRICE TREND 2017-2020 (USD/TON)
7.4 FUNGICIDES
7.4.1 THE PREVENTATIVE NATURE OF FUNGICIDES ALLOWS FARMERS TO PROTECT CROPS DURING EARLY GROWTH STAGES
FIGURE 39 AVERAGE ANNUAL SHARE OF FUNGICIDES AND BACTERICIDES CONSUMPTION VOLUME, BY REGION (1990-2018)
TABLE 15 FUNGICIDES: AGROCHEMICALS MARKET SIZE, BY REGION, 2018–2025 (USD MILLION)
TABLE 16 FUNGICIDES: AGROCHEMICALS MARKET SIZE, BY REGION, 2018–2025 (‘000 TONS)
TABLE 17 FUNGICIDES: AGROCHEMICALS MARKET SIZE, BY TYPE, 2018–2025 (USD MILLION)
TABLE 18 FUNGICIDES: AGROCHEMICALS MARKET SIZE, BY TYPE, 2018–2025 (‘000 TONS)
7.4.2 PRICING ANALYSIS
FIGURE 40 CHINA FUNGICIDE PRICE TREND 2017-2020 (USD/TON)
7.5 OTHER PESTICIDE TYPES
7.5.1 INCREASE IN DEMAND FOR HIGH-VALUE CROPS BOOSTING THE DEMAND FOR PGR AND SEED TREATMENT
TABLE 19 OTHER PESTICIDE TYPES: AGROCHEMICALS MARKET SIZE, BY REGION, 2018–2025 (USD MILLION)
TABLE 20 OTHER PESTICIDE TYPES: MARKET SIZE, BY REGION, 2018–2025 (‘000 TONS)
8 AGROCHEMICALS MARKET, BY FERTILIZER TYPE (Page No. - 93)
8.1 INTRODUCTION
TABLE 21 FERTILIZERS: AGROCHEMICALS MARKET SIZE, BY TYPE, 2018–2025 (USD MILLION)
TABLE 22 GLOBAL MARKET SIZE, BY FERTILIZER TYPE, 2018–2025 (‘000 TONS)
8.2 NITROGENOUS FERTILIZERS
TABLE 23 NITROGEN FERTILIZERS: AGROCHEMICALS MARKET SIZE, BY REGION, 2018–2025 (USD MILLION)
TABLE 24 NITROGEN FERTILIZERS: MARKET SIZE, BY REGION, 2018–2025 (‘000 TON)
TABLE 25 NITROGEN FERTILIZERS: MARKET SIZE, BY TYPE, 2018–2025 (USD MILLION)
TABLE 26 NITROGEN FERTILIZERS: MARKET SIZE, BY TYPE, 2018–2025 (‘000 TON)
8.2.1 PRICING ANALYSIS
FIGURE 41 NITROGEN: PRICING TREND, 2017-2020 (USD/MT)
8.2.2 UREA
8.2.2.1 Urea is the cheapest fertilizer that provides maximum nitrogen supply to the crops
TABLE 27 UREA: AGROCHEMICALS MARKET SIZE, BY REGION, 2018–2025 (USD MILLION)
TABLE 28 UREA: MARKET SIZE, BY REGION, 2018–2025 (‘000 TONS)
8.2.3 AMMONIUM NITRATE
8.2.3.1 The immediately available nitrate source for plants encourages farmers to use ammonium nitrate
TABLE 29 AMMONIUM NITRATE: AGROCHEMICALS MARKET SIZE, BY REGION, 2018–2025 (USD MILLION)
TABLE 30 AMMONIUM NITRATE: MARKET SIZE, BY REGION, 2018–2025 (‘000 TONS)
8.2.4 AMMONIUM SULPHATE
8.2.4.1 Ammonium sulfate fertilizers are an excellent source of sulfate, sulfur, and ammonium nitrogen
TABLE 31 AMMONIUM SULFATE: MARKET SIZE, BY REGION, 2018–2025 (USD MILLION)
TABLE 32 AMMONIUM SULFATE: MARKET SIZE, BY REGION, 2018–2025 (‘000 TONS)
8.2.5 AMMONIA
8.2.5.1 Ammonia has the highest content of any commercial fertilizer, making it a popular source despite the potential hazard it poses
TABLE 33 AMMONIA: MARKET SIZE, BY REGION, 2018–2025 (USD MILLION)
TABLE 34 AMMONIA: MARKET SIZE, BY REGION, 2018–2025 (‘000 TONS)
8.2.6 CALCIUM AMMONIUM NITRATE
8.2.6.1 Safer alternative to conventional ammonium nitrate
TABLE 35 CALCIUM AMMONIUM NITRATE: MARKET SIZE, BY REGION, 2018–2025 (USD MILLION)
TABLE 36 CALCIUM AMMONIUM NITRATE: MARKET SIZE, BY REGION, 2018–2025 (‘000 TONS)
8.2.7 OTHER NITROGENOUS FERTILIZERS
TABLE 37 OTHER NITROGENOUS FERTILIZERS: AGROCHEMICALS MARKET SIZE, BY REGION, 2018–2025 (USD MILLION)
TABLE 38 OTHER NITROGENOUS FERTILIZERS: AGROCHEMICALS MARKET SIZE, BY REGION, 2018–2025 (‘000 TONS)
8.3 PHOSPHATIC FERTILIZER
TABLE 39 PHOSPHATIC FERTILIZERS: AGROCHEMICALS MARKET SIZE, BY REGION, 2018–2025 (USD MILLION)
TABLE 40 PHOSPHATIC FERTILIZERS: MARKET SIZE, BY REGION, 2018–2025 (‘000 TONS)
TABLE 41 PHOSPHATIC FERTILIZERS: MARKET SIZE, BY TYPE, 2018–2025 (USD MILLION)
TABLE 42 PHOSPHATIC FERTILIZERS: MARKET SIZE, BY TYPE, 2018–2025 (‘000 TON)
8.3.1 PRICING ANALYSIS
FIGURE 42 DAP: PRICING TREND, 2017-2020, (USD/MT)
8.3.2 DIAMMONIUM PHOSPHATE (DAP)
8.3.2.1 DAP has a higher nitrogen content than MAP
TABLE 43 DIAMMONIUM PHOSPHATE: MARKET SIZE, BY REGION, 2018–2025 (USD MILLION)
TABLE 44 DIAMMONIUM PHOSPHATE: MARKET SIZE, BY REGION, 2018–2025 (‘000 TONS)
8.3.3 MONOAMMONIUM PHOSPHATE (MAP)
8.3.3.1 Suitable as an under-root fertilizer in crops, with a high phosphorus content requirement
TABLE 45 MONOAMMONIUM PHOSPHATE: MARKET SIZE, BY REGION, 2018–2025 (USD MILLION)
TABLE 46 MONOAMMONIUM PHOSPHATE: MARKET SIZE, BY REGION, 2018–2025 (‘000 TONS)
8.3.4 TRIPLE SUPERPHOSPHATE (TSP)
8.3.4.1 High demand for TSP because of the presence of water-soluble phosphate
TABLE 47 TRIPLE SUPERPHOSPHATE: MARKET SIZE, BY REGION, 2018–2025 (USD MILLION)
TABLE 48 TRIPLE SUPERPHOSPHATE: MARKET SIZE, BY REGION, 2018–2025 (‘000 TONS)
8.3.5 OTHER PHOSPHATIC FERTILIZERS
TABLE 49 OTHER PHOSPHATIC FERTILIZERS: MARKET SIZE, BY REGION, 2018–2025 (USD MILLION)
TABLE 50 OTHER PHOSPHATIC FERTILIZERS: MARKET SIZE, BY REGION, 2018–2025 (‘000 TONS)
8.4 POTASSIC FERTILIZER
TABLE 51 POTASSIC FERTILIZERS: AGROCHEMICALS MARKET SIZE, BY REGION, 2018–2025 (USD MILLION)
TABLE 52 POTASSIC FERTILIZERS: MARKET SIZE, BY REGION, 2018–2025 (‘000 TONS)
TABLE 53 POTASSIC FERTILIZERS: MARKET SIZE, BY TYPE, 2018–2025 (USD MILLION)
TABLE 54 POTASSIC FERTILIZERS: MARKET SIZE, BY TYPE, 2018–2025 (‘000 TON)
8.4.1 PRICING ANALYSIS
FIGURE 43 POTASSIUM CHLORIDE: PRICING TREND, 2017-2020 (USD/MT)
8.4.2 POTASSIUM CHLORIDE
8.4.2.1 Potassium chloride is the most widely applied K fertilizer because of its relatively low cost
TABLE 55 POTASSIUM CHLORIDE FERTILIZER: AGROCHEMICALS MARKET SIZE, BY REGION, 2018–2025 (USD MILLION)
TABLE 56 POTASSIUM CHLORIDE FERTILIZER:MARKET SIZE, BY REGION, 2018–2025 (‘000 TONS)
8.4.3 POTASSIUM SULFATE
8.4.3.1 Low hygroscopicity and chemical stability have been the key factors in the adoption of potassium sulfate
TABLE 57 POTASSIUM SULFATE: AGROCHEMICALS MARKET SIZE, BY REGION, 2018–2025 (USD MILLION)
TABLE 58 POTASSIUM SULFATE: MARKET SIZE, BY REGION, 2018–2025 (‘000 TONS)
8.4.4 OTHER POTASSIC FERTILIZERS
TABLE 59 OTHER POTASSIC FERTILIZERS: MARKET SIZE, BY REGION, 2018–2025 (USD MILLION)
TABLE 60 OTHER POTASSIC FERTILIZERS: MARKET SIZE, BY REGION, 2018–2025 (‘000 TONS)
9 AGROCHEMICALS MARKET, BY CROP APPLICATION (Page No. - 115)
9.1 INTRODUCTION
TABLE 61 GLOBAL AGROCHEMICALS MARKET SIZE, BY CROP APPLICATION, 2018–2025 (USD MILLION)
9.2 CEREALS & GRAINS
9.2.1 NITROGENOUS FERTILIZERS ARE HIGHLY USED IN THE PRODUCTION OF CEREALS AND GRAINS
TABLE 62 CEREALS & GRAINS: AGROCHEMICALS MARKET SIZE, BY REGION, 2018–2025 (USD MILLION)
9.3 OILSEED & PULSES
9.3.1 INCREASE IN THE PRODUCTION AND EXPORT OF HIGH-VALUE OILSEEDS LIKE SOYBEAN TO DRIVE THE MARKET FOR AGROCHEMICALS
TABLE 63 OILSEED & PULSES: MARKET SIZE, BY REGION, 2018–2025 (USD MILLION)
9.4 FRUITS & VEGETABLES
9.4.1 INCREASE IN THE CONSUMPTION OF FRUITS & VEGETABLES
TABLE 64 FRUITS & VEGETABLES: MARKET SIZE, BY REGION, 2018–2025 (USD MILLION)
9.5 OTHER CROP APPLICATIONS
TABLE 65 OTHER CROP APPLICATIONS: MARKET SIZE, BY REGION, 2018–2025 (USD MILLION)
10 AGROCHEMICALS MARKET, BY REGION (Page No. - 121)
10.1 INTRODUCTION
TABLE 66 GLOBAL: AGROCHEMICALS MARKET SIZE, BY COUNTRY, 2016–2019 (USD MILLION)
TABLE 67 GLOBAL: AGROCHEMICALSMARKET SIZE, BY COUNTRY, 2020-2025 (USD MILLION)
TABLE 68 GLOBAL: MARKET SIZE, BY COUNTRY, 2016–2019 (‘000 TONS)
TABLE 69 GLOBAL: MARKET SIZE, BY COUNTRY, 2020-2025 (‘000 TONS)
10.2 COVID-19 IMPACT ON THE AGROCHEMICALS MARKET, BY REGION
10.2.1 OPTIMISTIC SCENARIO
TABLE 70 COVID-19 IMPACT ON THE AGROCHEMICALS MARKET SIZE, BY REGION, 2020–2023 (USD MILLION) (OPTIMISTIC SCENARIO)
10.2.2 PESSIMISTIC SCENARIO
TABLE 71 COVID-19 IMPACT ON THE AGROCHEMICAL MARKET SIZE, BY REGION, 2020–2023 (USD MILLION) (PESSIMISTIC SCENARIO)
10.2.3 REALISTIC SCENARIO
TABLE 72 COVID-19 IMPACT ON THE AGROCHEMICALS MARKET SIZE, BY REGION, 2018–2021 (USD MILLION) (REALISTIC SCENARIO)
10.3 NORTH AMERICA
10.3.1 REGULATION FRAMEWORK PESTICIDES
10.3.1.1 US
10.3.1.1.1 Product registration for pesticides in the US
10.3.1.2 Canada
10.3.1.2.1 Pesticide regulations in Canada
10.3.2 REGULATORY FRAMEWORK FERTILIZERS
10.3.2.1 US
10.3.2.2 Canada
10.3.3 TRADE ANALYSIS
10.3.3.1 Export scenario of insecticides and fungicides
FIGURE 44 NORTH AMERICA: INSECTICIDES AND FUNGICIDES EXPORT, BY KEY COUNTRY, 2012–2019 (USD MILLION)
10.3.3.2 Import scenario of insecticides and fungicides
FIGURE 45 NORTH AMERICA: INSECTICIDES AND FUNGICIDES IMPORT, BY KEY COUNTRY, 2012–2019 (USD MILLION)
10.3.4 NORTH AMERICA, BY COUNTRY
TABLE 73 NORTH AMERICA: AGROCHEMICALS MARKET SIZE, BY COUNTRY, 2016–2019 (USD MILLION)
TABLE 74 NORTH AMERICA: MARKET SIZE, BY COUNTRY, 2020-2025 (USD MILLION)
TABLE 75 NORTH AMERICA: MARKET SIZE, BY COUNTRY, 2016–2019 (‘000 TONS)
TABLE 76 NORTH AMERICA: MARKET SIZE, BY COUNTRY, 2020-2025 (‘000 TONS)
TABLE 77 NORTH AMERICA: MARKET SIZE, BY PESTICIDE TYPE, 2018–2025 (USD MILLION)
TABLE 78 NORTH AMERICA: MARKET SIZE, BY PESTICIDE TYPE, 2018–2025 (‘000 TONS)
TABLE 79 NORTH AMERICA: MARKET SIZE, BY FERTILIZER TYPE, 2018–2025 (USD MILLION)
TABLE 80 NORTH AMERICA: MARKET SIZE, BY FERTILIZER TYPE, 2018–2025 (‘000 TONS)
TABLE 81 NORTH AMERICA: MARKET SIZE, BY CROP APPLICATION, 2018–2025 (USD MILLION)
TABLE 82 NORTH AMERICA: MARKET SIZE, BY CROP APPLICATION, 2018–2025 (‘000 TONS)
10.3.5 US
10.3.5.1 Presence of major agrochemicals companies aiding the growth of the agrochemicals market
TABLE 83 US: AGROCHEMICALS MARKET SIZE, BY PESTICIDE TYPE, 2018–2025 (USD MILLION)
TABLE 84 US: MARKET SIZE, BY PESTICIDE TYPE, 2018–2025 (‘000 TONS)
TABLE 85 US: MARKET SIZE, BY CROP APPLICATION, 2018–2025 (USD MILLION)
TABLE 86 US: MARKET SIZE, BY CROP APPLICATION, 2018–2025 (‘000 TONS)
10.3.6 CANADA
10.3.6.1 Rising consumption of cereals, fruits, and vegetables to support agrochemical demand
TABLE 87 CANADA: AGROCHEMICALS MARKET SIZE, BY PESTICIDE TYPE, 2018–2025 (USD MILLION)
TABLE 88 CANADA: MARKET SIZE, BY PESTICIDE TYPE, 2018–2025 (‘000 TONS)
TABLE 89 CANADA: MARKET SIZE, BY CROP APPLICATION, 2018–2025 (USD MILLION)
TABLE 90 CANADA: MARKET SIZE, BY CROP APPLICATION, 2018–2025 (‘000 TONS)
10.3.7 MEXICO
10.3.7.1 Pesticide application for genetically modified corn to meet the growing demand from the livestock sector
TABLE 91 MEXICO: AGROCHEMICALS MARKET SIZE, BY PESTICIDE TYPE, 2018–2025 (USD MILLION)
TABLE 92 MEXICO: MARKET SIZE, BY PESTICIDE TYPE, 2018–2025 (‘000 TONS)
TABLE 93 MEXICO: MARKET SIZE, BY CROP APPLICATION, 2018–2025 (USD MILLION)
TABLE 94 MEXICO: MARKET SIZE, BY CROP APPLICATION, 2018–2025 (‘000 TONS)
10.4 EUROPE
TABLE 95 EUROPE: AGROCHEMICALS MARKET SIZE, BY COUNTRY, 2016–2019 (USD MILLION)
TABLE 96 EUROPE: MARKET SIZE, BY COUNTRY, 2020-2025 (USD MILLION)
TABLE 97 EUROPE: MARKET SIZE, BY COUNTRY, 2016–2019 (‘000 TONS)
TABLE 98 EUROPE: MARKET SIZE, BY COUNTRY, 2020-2025 (‘000 TONS)
TABLE 99 EUROPE: MARKET SIZE, BY PESTICIDE TYPE, 2018–2025 (USD MILLION)
TABLE 100 EUROPE: MARKET SIZE, BY PESTICIDE TYPE, 2018–2025 (‘000 TONS)
TABLE 101 EUROPE: MARKET SIZE, BY FERTILIZER TYPE, 2018–2025 (USD MILLION)
TABLE 102 EUROPE: MARKET SIZE, BY FERTILIZER TYPE, 2018–2025 (‘000 TONS)
TABLE 103 EUROPE: MARKET SIZE, BY CROP APPLICATION, 2018–2025 (USD MILLION)
TABLE 104 EUROPE: MARKET SIZE, BY CROP APPLICATION, 2018–2025 (‘000 TONS)
10.4.1 REGULATIONS: PESTICIDES
10.4.1.1 Data requirements for plant protection products
10.4.2 REGULATIONS: FERTILIZERS
10.4.3 TRADE ANALYSIS
10.4.3.1 Export scenario of insecticides and fungicides
FIGURE 46 EUROPE: INSECTICIDES AND FUNGICIDES EXPORT, BY KEY COUNTRY, 2012–2019 (USD MILLION)
10.4.3.2 Import scenario of insecticides and fungicides
FIGURE 47 EUROPE: INSECTICIDES AND FUNGICIDES IMPORT, BY KEY COUNTRY, 2012–2019 (USD MILLION)
10.4.4 SPAIN
10.4.4.1 Increase in the production and export of agricultural products to drive the market for agrochemicals
TABLE 105 SPAIN: AGROCHEMICALS MARKET SIZE, BY PESTICIDE TYPE, 2018–2025 (USD MILLION)
TABLE 106 SPAIN: MARKET SIZE, BY PESTICIDE TYPE, 2018–2025 (‘000 TONS)
TABLE 107 SPAIN: MARKET SIZE, BY CROP APPLICATION, 2018–2025 (USD MILLION)
TABLE 108 SPAIN: MARKET SIZE, BY CROP APPLICATION, 2018–2025 (‘000 TONS)
10.4.5 ITALY
10.4.5.1 Increase in the utilization of environmentally friendly agricultural inputs to fuel the demand for agrochemicals
TABLE 109 ITALY: AGROCHEMICALS MARKET SIZE, BY PESTICIDE TYPE, 2018–2025 (USD MILLION)
TABLE 110 ITALY: MARKET SIZE, BY PESTICIDE TYPE, 2018–2025 (‘000 TONS)
TABLE 111 ITALY: MARKET SIZE, BY CROP APPLICATION, 2018–2025 (USD MILLION)
TABLE 112 ITALY: MARKET SIZE, BY CROP APPLICATION, 2018–2025 (‘000 TONS)
10.4.6 FRANCE
10.4.6.1 Agrochemical competitors have been actively employing strategies to increase their presence in the country
TABLE 113 FRANCE: AGROCHEMICALS MARKET SIZE, BY PESTICIDE TYPE, 2018–2025 (USD MILLION)
TABLE 114 FRANCE: MARKET SIZE, BY PESTICIDE TYPE, 2018–2025 (‘000 TONS)
TABLE 115 FRANCE: MARKET SIZE, BY CROP APPLICATION, 2018–2025 (USD MILLION)
TABLE 116 FRANCE: MARKET SIZE, BY CROP APPLICATION, 2018–2025 (‘000 TONS)
10.4.7 GERMANY
10.4.7.1 Rising trend of organic farming practices in the country to drive the market for bio-based crop protection chemicals
TABLE 117 GERMANY: AGROCHEMICALS MARKET SIZE, BY PESTICIDE TYPE, 2018–2025 (USD MILLION)
TABLE 118 GERMANY: MARKET SIZE, BY PESTICIDE TYPE, 2018–2025 (‘000 TONS)
TABLE 119 GERMANY: MARKET SIZE, BY CROP APPLICATION, 2018–2025 (USD MILLION)
TABLE 120 GERMANY: MARKET SIZE, BY CROP APPLICATION, 2018–2025 (‘000 TONS)
10.4.8 REST OF EUROPE
10.4.8.1 Rising demand for food and the use of innovative pesticides to drive the demand for agrochemicals
TABLE 121 REST OF EUROPE: AGROCHEMICALS MARKET SIZE, BY PESTICIDE TYPE, 2018–2025 (USD MILLION)
TABLE 122 REST OF EUROPE: MARKET SIZE, BY PESTICIDE TYPE, 2018–2025 (‘000 TONS)
TABLE 123 REST OF EUROPE: MARKET SIZE, BY CROP APPLICATION, 2018–2025 (USD MILLION)
TABLE 124 REST OF EUROPE: MARKET SIZE, BY CROP APPLICATION, 2018–2025 (‘000 TONS)
10.5 ASIA PACIFIC
FIGURE 48 ASIA PACIFIC: REGIONAL SNAPSHOT
10.5.1 REGULATIONS: PESTICIDES
10.5.1.1 China
10.5.1.2 Australia
10.5.1.2.1 Approval of active constituents for use in Australia
10.5.1.3 India
10.5.1.3.1 Data requirements for technical ingredients
10.5.2 REGULATIONS: FERTILIZERS
10.5.2.1 Australia
10.5.2.2 China
10.5.2.3 India
TABLE 125 NUTRIENT-BASED SUBSIDY (NBS) RATES, 2010–2015
10.5.3 TRADE ANALYSIS:
10.5.3.1 Export scenario of insecticides and fungicides
FIGURE 49 ASIA PACIFIC: INSECTICIDES AND FUNGICIDES EXPORT, BY KEY COUNTRY, 2012–2019 (USD MILLION)
10.5.3.2 Import scenario of insecticides and fungicides
FIGURE 50 ASIA PACIFIC: INSECTICIDES AND FUNGICIDES IMPORT, BY KEY COUNTRY, 2012–2019 (USD MILLION)
TABLE 126 ASIA PACIFIC: AGROCHEMICALS MARKET SIZE, BY COUNTRY, 2016–2019 (USD MILLION)
TABLE 127 ASIA PACIFIC: MARKET SIZE, BY COUNTRY, 2020-2025 (USD MILLION)
TABLE 128 ASIA PACIFIC: MARKET SIZE, BY COUNTRY, 2016–2019 (‘000 TONS)
TABLE 129 ASIA PACIFIC: MARKET SIZE, BY COUNTRY, 2020-2025 (‘000 TONS)
TABLE 130 ASIA PACIFIC: MARKET SIZE, BY PESTICIDE TYPE, 2018–2025 (USD MILLION)
TABLE 131 ASIA PACIFIC: MARKET SIZE, BY PESTICIDE TYPE, 2018–2025 (‘000 TONS)
TABLE 132 ASIA PACIFIC: MARKET SIZE, BY FERTILIZER TYPE, 2018–2025 (USD MILLION)
TABLE 133 ASIA PACIFIC: MARKET SIZE, BY FERTILIZER TYPE, 2018–2025 (‘000 TONS)
TABLE 134 ASIA PACIFIC: MARKET SIZE, BY CROP APPLICATION, 2018–2025 (USD MILLION)
TABLE 135 ASIA PACIFIC: MARKET SIZE, BY CROP APPLICATION, 2018–2025 (‘000 TONS)
10.5.4 CHINA
10.5.4.1 Reducing practices of chemical agriculture to drive the market for bio-based agricultural inputs
TABLE 136 CHINA: AGROCHEMICALS MARKET SIZE, BY PESTICIDES TYPE, 2018–2025 (USD MILLION)
TABLE 137 CHINA: MARKET SIZE, BY PESTICIDES TYPE, 2018–2025 (‘000 TONS)
TABLE 138 CHINA: MARKET SIZE, BY CROP APPLICATION, 2018–2025 (USD MILLION)
TABLE 139 CHINA: MARKET SIZE, BY CROP APPLICATION, 2018–2025 (‘000 TONS)
10.5.5 INDIA
10.5.5.1 Increased pressure on improving farm yield to drive the agrochemicals market
TABLE 140 INDIA: AGROCHEMICALS MARKET SIZE, BY PESTICIDES TYPE, 2018–2025 (USD MILLION)
TABLE 141 INDIA: MARKET SIZE, BY PESTICIDES TYPE, 2018–2025 (‘000 TONS)
TABLE 142 INDIA: MARKET SIZE, BY CROP APPLICATION, 2018–2025 (USD MILLION)
TABLE 143 INDIA: MARKET SIZE, BY CROP APPLICATION, 2018–2025 (‘000 TONS)
10.5.6 JAPAN
10.5.6.1 Regulated and limited use of agrochemicals to protect the environment
TABLE 144 JAPAN: AGROCHEMICALS MARKET SIZE, BY PESTICIDE TYPE, 2018–2025 (USD MILLION)
TABLE 145 JAPAN:MARKET SIZE, BY PESTICIDE TYPE, 2018–2025 (‘000 TONS)
TABLE 146 JAPAN: MARKET SIZE, BY CROP APPLICATION, 2018–2025 (USD MILLION)
TABLE 147 JAPAN: MARKET SIZE, BY CROP APPLICATION, 2018–2025 (‘000 TONS)
10.5.7 AUSTRALIA
10.5.7.1 Increase in pesticide resistance towards existing active ingredients to impact the agrochemicals market
TABLE 148 AUSTRALIA: AGROCHEMICALS MARKET SIZE, BY PESTICIDES TYPE, 2018–2025 (USD MILLION)
TABLE 149 AUSTRALIA: MARKET SIZE, BY PESTICIDES TYPE, 2018–2025 (‘000 TONS)
TABLE 150 AUSTRALIA: MARKET SIZE, BY CROP APPLICATION, 2018–2025 (USD MILLION)
TABLE 151 AUSTRALIA: MARKET SIZE, BY CROP APPLICATION, 2018–2025 (‘000 TONS)
10.5.8 THAILAND
10.5.8.1 Rising trend of organic farming to increase the demand and usage of bio-based agricultural solutions
TABLE 152 THAILAND: AGROCHEMICALS MARKET SIZE, BY PESTICIDE TYPE, 2018–2025 (USD MILLION)
TABLE 153 THAILAND: MARKET SIZE, BY PESTICIDE TYPE, 2018–2025 (‘000 TONS)
TABLE 154 THAILAND: MARKET SIZE, BY CROP APPLICATION, 2018–2025 (USD MILLION)
TABLE 155 THAILAND: MARKET SIZE, BY CROP APPLICATION, 2018–2025 (‘000 TONS)
10.5.9 REST OF ASIA PACIFIC
TABLE 156 REST OF ASIA PACIFIC: AGROCHEMICALS MARKET SIZE, BY PESTICIDE TYPE, 2018–2025 (USD MILLION)
TABLE 157 REST OF ASIA PACIFIC: MARKET SIZE, BY PESTICIDE TYPE, 2018–2025 (‘000 TONS)
TABLE 158 REST OF ASIA PACIFIC: MARKET SIZE, BY CROP APPLICATION, 2018–2025 (USD MILLION)
TABLE 159 REST OF ASIA PACIFIC: MARKET SIZE, BY CROP APPLICATION, 2018–2025 (‘000 TONS)
10.6 SOUTH AMERICA
FIGURE 51 SOUTH AMERICA: REGIONAL SNAPSHOT
10.6.1 REGULATORY FRAMEWORK
10.6.2 TRADE ANALYSIS
10.6.2.1 Export scenario of insecticides and fungicides
FIGURE 52 SOUTH AMERICA: INSECTICIDES AND FUNGICIDES EXPORT, BY KEY COUNTRY, 2012–2019 (USD MILLION)
10.6.2.2 Import scenario of insecticides and fungicides
FIGURE 53 SOUTH AMERICA: INSECTICIDES AND FUNGICIDES IMPORT, BY KEY COUNTRY, 2012–2019 (USD MILLION)
TABLE 160 SOUTH AMERICA: AGROCHEMICALS MARKET SIZE, BY COUNTRY, 2016–2019 (USD MILLION)
TABLE 161 SOUTH AMERICA: MARKET SIZE, BY COUNTRY, 2020-2025 (USD MILLION)
TABLE 162 SOUTH AMERICA: MARKET SIZE, BY COUNTRY, 2016–2019 (‘000 TONS)
TABLE 163 SOUTH AMERICA: MARKET SIZE, BY COUNTRY, 2020-2025 (‘000 TONS)
TABLE 164 SOUTH AMERICA: MARKET SIZE, BY PESTICIDE TYPE, 2018–2025 (USD MILLION)
TABLE 165 SOUTH AMERICA: MARKET SIZE, BY PESTICIDE TYPE, 2018–2025 (‘000 TONS)
TABLE 166 SOUTH AMERICA: MARKET SIZE, BY FERTILIZER TYPE, 2018–2025 (USD MILLION)
TABLE 167 SOUTH AMERICA: MARKET SIZE, BY FERTILIZER TYPE, 2018–2025 (‘000 TONS)
TABLE 168 SOUTH AMERICA: MARKET SIZE, BY CROP APPLICATION, 2018–2025 (USD MILLION)
TABLE 169 SOUTH AMERICA: MARKET SIZE, BY CROP APPLICATION, 2018–2025 (‘000 TONS)
10.6.3 BRAZIL
10.6.3.1 High demand for soybean from Europe and Asian countries to increase adoption of agrochemicals
TABLE 170 BRAZIL: AGROCHEMICALS MARKET SIZE, BY PESTICIDE TYPE, 2018–2025 (USD MILLION)
TABLE 171 BRAZIL: MARKET SIZE, BY PESTICIDE TYPE, 2018–2025 (‘000 TONS)
TABLE 172 BRAZIL: MARKET SIZE, BY CROP APPLICATION, 2018–2025 (USD MILLION)
TABLE 173 BRAZIL: MARKET SIZE, BY CROP APPLICATION, 2018–2025 (‘000 TONS)
10.6.4 ARGENTINA
10.6.4.1 Argentinean companies are promoting the adoption of advanced agrochemical solutions
TABLE 174 ARGENTINA: AGROCHEMICALS MARKET SIZE, BY PESTICIDE TYPE, 2018–2025 (USD MILLION)
TABLE 175 ARGENTINA: MARKET SIZE, BY PESTICIDE TYPE, 2018–2025 (‘000 TONS)
TABLE 176 ARGENTINA: MARKET SIZE, BY CROP APPLICATION, 2018–2025 (USD MILLION)
TABLE 177 ARGENTINA: MARKET SIZE, BY CROP APPLICATION, 2018–2025 (‘000 TONS)
10.6.5 REST OF SOUTH AMERICA
10.6.5.1 Growing competition among key players to register their products to tap the market opportunities
TABLE 178 REST OF SOUTH AMERICA: AGROCHEMICALS MARKET SIZE, BY PESTICIDE TYPE, 2018–2025 (USD MILLION)
TABLE 179 REST OF SOUTH AMERICA: AGROCHEMICALS MARKET SIZE, BY PESTICIDE TYPE, 2018–2025 (‘000 TONS)
TABLE 180 REST OF SOUTH AMERICA: AGROCHEMICALS MARKET SIZE, BY CROP APPLICATION, 2018–2025 (USD MILLION)
TABLE 181 REST OF SOUTH AMERICA: AGROCHEMICALS MARKET SIZE, BY CROP APPLICATION, 2018–2025 (‘000 TONS)
10.7 REST OF THE WORLD (ROW)
TABLE 182 ROW: AGROCHEMICALS MARKET SIZE, BY COUNTRY, 2016–2019 (USD MILLION)
TABLE 183 ROW: AGROCHEMICALS MARKET SIZE, BY COUNTRY, 2020-2025 (USD MILLION)
TABLE 184 ROW: AGROCHEMICALSMARKET SIZE, BY COUNTRY, 2016–2019 (‘000 TONS)
TABLE 185 ROW: AGROCHEMICALS MARKET SIZE, BY COUNTRY, 2020-2025 (‘000 TONS)
TABLE 186 ROW: AGROCHEMICALS MARKET SIZE, BY PESTICIDE TYPE, 2018–2025 (USD MILLION)
TABLE 187 ROW: AGROCHEMICALS MARKET SIZE, BY PESTICIDE TYPE, 2018–2025 (‘000 TONS)
TABLE 188 ROW: AGROCHEMICALS MARKET SIZE, BY FERTILIZER TYPE, 2018–2025 (USD MILLION)
TABLE 189 ROW: AGROCHEMICALS MARKET SIZE, BY FERTILIZER TYPE, 2018–2025 (‘000 TONS)
TABLE 190 ROW: AGROCHEMICALS MARKET SIZE, BY CROP APPLICATION, 2018–2025 (USD MILLION)
TABLE 191 ROW: AGROCHEMICALS MARKET SIZE, BY CROP APPLICATION, 2018–2025 (‘000 TONS)
10.7.1 REGULATIONS: PESTICIDES
10.7.1.1 South Africa
10.7.2 REGULATIONS: FERTILIZERS
10.7.2.1 South Africa
10.7.2.2 Israel
10.7.3 TRADE ANALYSIS
10.7.3.1 Export scenario of insecticides and fungicides
FIGURE 54 ROW: INSECTICIDES AND FUNGICIDES EXPORT, BY KEY COUNTRY, 2012–2019 (USD MILLION)
10.7.3.2 Import scenario of insecticides and fungicides
FIGURE 55 ROW: INSECTICIDES AND FUNGICIDES IMPORT, BY KEY COUNTRY, 2012–2019 (USD MILLION)
10.7.4 AFRICA
10.7.4.1 Africa holds the huge market potential for agrochemical manufacturers
TABLE 192 AFRICA: AGROCHEMICALS MARKET SIZE, BY PESTICIDE TYPE, 2018–2025 (USD MILLION)
TABLE 193 AFRICA: AGROCHEMICALS MARKET SIZE, BY PESTICIDE TYPE, 2018–2025 (‘000 TONS)
TABLE 194 AFRICA: AGROCHEMICALS MARKET SIZE, BY CROP APPLICATION, 2018–2025 (USD MILLION)
TABLE 195 AFRICA: AGROCHEMICALS MARKET SIZE, BY CROP APPLICATION, 2018–2025 (‘000 TONS)
10.7.5 MIDDLE EAST
10.7.5.1 Rising investments on indoor vertical farming in the Middle East countries would act as a significant driver in the development of agrochemicals market.
TABLE 196 MIDDLE EAST: AGROCHEMICALS MARKET SIZE, BY PESTICIDE TYPE, 2018–2025 (USD MILLION)
TABLE 197 MIDDLE EAST: AGROCHEMICALS MARKET SIZE, BY PESTICIDE TYPE, 2018–2025 (‘000 TONS)
TABLE 198 MIDDLE EAST: AGROCHEMICALS MARKET SIZE, BY CROP APPLICATION, 2018–2025 (USD MILLION)
TABLE 199 MIDDLE EAST: AGROCHEMICALS MARKET SIZE, BY CROP APPLICATION, 2018–2025 (‘000 TONS)
11 COMPETITIVE LANDSCAPE (Page No. - 202)
11.1 OVERVIEW
11.2 MARKET SHARE ANALYSIS, 2019
TABLE 200 YARA, MOSAIC, AND NUTRIEN DOMINATED THE FERTILIZERS MARKET IN 2019
TABLE 201 SYNGENTA, BASF, AND CORTEVA DOMINATE THE PESTICIDES MARKET IN 2019
FIGURE 56 REVENUE ANALYSIS OF KEY PLAYERS IN THE PESTICIDES MARKET, 2017-2019 (USD MILLION)
FIGURE 57 REVENUE ANALYSIS OF KEY PLAYERS IN THE FERTILIZERS MARKET, 2017-2019 (USD MILLION)
11.3 COVID-19 SPECIFIC COMPANY RESPONSE
11.4 COMPANY EVALUATION QUADRANT: DEFINITION & METHODOLOGY (PESTICIDES MARKET)
11.4.1 STAR
11.4.2 EMERGING LEADERS
11.4.3 PERVASIVE
11.4.4 PARTICIPANTS
FIGURE 58 PESTICIDES MARKET: COMPANY EVALUATION QUADRANT, 2020
11.5 COMPANY EVALUATION QUADRANT: DEFINITION & METHODOLOGY (FERTILIZERS MARKET)
11.5.1 STAR
11.5.2 EMERGING LEADERS
11.5.3 PERVASIVE
11.5.4 PARTICIPANTS
FIGURE 59 FERTILIZER MARKET: COMPANY EVALUATION QUADRANT, 2020
11.6 PRODUCT FOOTPRINT
TABLE 202 AGROCHEMICALS MARKET: COMPANY TYPE FOOTPRINT
TABLE 203 AGROCHEMICALS MARKET: COMPANY REGION FOOTPRINT
TABLE 204 AGROCHEMICALS MARKET: PRODUCT FOOTPRINT (OVERALL)
11.7 AGROCHEMICALS MARKET EVALUATION FRAMEWORK
TABLE 205 OVERVIEW OF STRATEGIES DEPLOYED BY AGROCHEMICAL COMPANIES
11.7.1 NEW PRODUCT LAUNCHES
TABLE 206 AGROCHEMICALS: PRODUCT LAUNCHES, JANUARY 2018- FEBRUARY 2021
11.7.2 DEALS
TABLE 207 AGROCHEMICALS: DEALS, JANUARY 2018-FEBRUARY 2021
12 COMPANY PROFILES (Page No. - 214)
12.1 AGROCHEMICALS MARKET KEY PLAYERS
(Business Overview, Products offered, SWOT Analysis, Recent Developments and MNM View)*
12.1.1 BAYER
TABLE 208 BAYER: BUSINESS OVERVIEW
FIGURE 60 BAYER: COMPANY SNAPSHOT
12.1.2 BASF SE
TABLE 209 BASF SE: BUSINESS OVERVIEW
FIGURE 61 BASF SE: COMPANY SNAPSHOT
12.1.3 SYNGENTA AG
TABLE 210 SYNGENTA AG: BUSINESS OVERVIEW
FIGURE 62 SYNGENTA AG: COMPANY SNAPSHOT
12.1.4 UPL
TABLE 211 UPL: BUSINESS OVERVIEW
FIGURE 63 UPL: COMPANY SNAPSHOT
12.1.5 COMPASS MINERALS
TABLE 212 COMPASS MINERALS: BUSINESS OVERVIEW
FIGURE 64 COMPASS MINERALS: COMPANY SNAPSHOT
12.1.6 EUROCHEM GROUP
TABLE 213 EUROCHEM GROUP - BUSINESS OVERVIEW
FIGURE 65 EUROCHEM GROUP: COMPANY SNAPSHOT
12.1.7 OCP GROUP
TABLE 214 OCP GROUP - BUSINESS OVERVIEW
FIGURE 66 OCP GROUP: COMPANY SNAPSHOT
12.1.8 K+S AKTIENGESELLSCHAFT
TABLE 215 K+S AKTIENGESELLSCHAFT - BUSINESS OVERVIEW
FIGURE 67 K+S AKTIENGESELLSCHAFT: COMPANY SNAPSHOT
12.1.9 SOCIEDAD QUÍMICA Y MINERA DE CHILE
TABLE 216 SOCIEDAD QUÍMICA Y MINERA DE CHILE - BUSINESS OVERVIEW
FIGURE 68 SOCIEDAD QUÍMICA Y MINERA DE CHILE: COMPANY SNAPSHOT
12.1.10 SUMITOMO CHEMICALS
TABLE 217 SUMITOMO CHEMICALS – BUSINESS OVERVIEW
FIGURE 69 SUMITOMO CHEMICALS: COMPANY SNAPSHOT
12.1.11 ADAMA LTD
TABLE 218 ADAMA LTD - BUSINESS OVERVIEW
FIGURE 70 ADAMA LTD: COMPANY SNAPSHOT
12.1.12 NUFARM
TABLE 219 NUFARM - BUSINESS OVERVIEW
FIGURE 71 NUFARM: COMPANY SNAPSHOT
12.1.13 NUTRIEN LTD
TABLE 220 NUTRIEN LTD - BUSINESS OVERVIEW
FIGURE 72 NUTRIEN LTD: COMPANY SNAPSHOT
12.1.14 YARA INTERNATIONAL ASA
TABLE 221 YARA INTERNATIONAL ASA - BUSINESS OVERVIEW
FIGURE 73 YARA INTERNATIONAL ASA: COMPANY SNAPSHOT
12.1.15 ICL
TABLE 222 ICL - BUSINESS OVERVIEW
FIGURE 74 ICL: COMPANY SNAPSHOT
12.1.16 CORTEVA INC.
12.2 OTHER PLAYERS
12.2.1 MARRONE BIO INNOVATIONS, INC.
12.2.2 THE MOSAIC COMPANY
12.2.3 CF INDUSTRIES HOLDINGS, INC.
12.2.4 OCI NITROGEN
12.2.5 FMC CORPORATION
12.2.6 NIPPON SODA CO., LTD.
12.2.7 ISAGRO SPA
12.2.8 NISSAN CHEMICALS INDUSTRIES LTD.
*Details on Business Overview, Products offered, SWOT Analysis, Recent Developments and MNM View might not be captured in case of unlisted companies.
13 APPENDIX (Page No. - 253)
13.1 DISCUSSION GUIDE
13.2 KNOWLEDGE STORE: MARKETSANDMARKETS’ SUBSCRIPTION PORTAL
13.3 AVAILABLE CUSTOMIZATIONS
13.4 RELATED REPORTS
13.5 AUTHOR DETAILS
The study involves four major activities to estimate the current market size of the agrochemicals market. Exhaustive secondary research was done to collect information on the market, peer market, and parent market. These findings, assumptions, and market sizes were validated with industry experts across the value chain through primary research. Both the top-down and bottom-up approaches were employed to estimate the complete market size. After that, the market breakdown and data triangulation approaches were used to estimate the market size of various segments and subsegments.
Secondary Research
In the secondary research process, various secondary sources such as the Food and Agriculture organization (FAO), United States Department of Agriculture (USDA), European Commission, Hoovers, Bloomberg BusinessWeek, and Dun & Bradstreet were referred to identify and collect information for this study. These secondary sources included annual reports, press releases & investor presentations of companies, white papers, certified publications, articles by recognized authors, food safety organizations, regulatory bodies, and trade directories.
Primary Research
The agrochemicals market comprises several stakeholders such farmers and their agents, agricultural supplies and services, food distributors and processors, national/regional helath protection agencises, National/regional environmental protection agencies, European and international agencies, NGOs, manufacturers, animal breeders, commercial research organisations/agencies/laboratories, and regulatory bodies such as the intermediary suppliers, wholesalers, traders, research institutes and organization, and regulatory bodies such as United States Department of Agriculture (USDA), Food and Agricultural organization (FAO) and European Commission (EU).
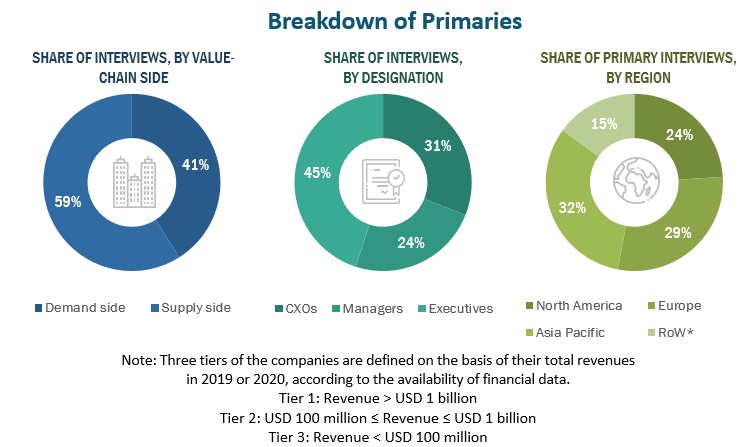
The demand side is comprised of strong demand from the various farmers, agricultural supplies and services, food distributors and processors, and fertilizers and pesticides manufacturers. Various primary sources from both the supply and demand sides of the market were interviewed to obtain qualitative and quantitative information. Following is the breakdown of primary respondents:
To know about the assumptions considered for the study, download the pdf brochure
Agrochemicals Market Size Estimation
Both the top-down and bottom-up approaches were used to estimate and validate the total size of the agrochemicals market. The research methodology used to estimate the market size includes the following:
- The key players were identified through extensive secondary research.
- The industry’s supply chain and market size were determined through primary and secondary research.
- All percentage shares splits, and breakdowns were determined using secondary sources and verified through primary sources.
- All the possible parameters that affect the markets covered in this research study were accounted for, viewed in extensive detail, verified through primary research, and analyzed to obtain the final quantitative and qualitative data.
To know about the assumptions considered for the study, Request for Free Sample Report
Data Triangulation
After arriving at the overall market size—using the market size estimation processes as explained above—the market was split into several segments and subsegments. To complete the overall market engineering process and arrive at the exact statistics of each market segment and subsegment, the data triangulation and market breakdown procedures were employed. The data was triangulated by studying various factors and trends from both the demand and supply sides in the agrochemicals market.
Report Objectives
- To define, segment, and estimate the size of the agrochemicals market with respect to fertilizer type, pesticide type and crop type and region
- To provide detailed information about the major factors influencing the growth of the agrochemicals market (drivers, restraints, opportunities, and industry-specific challenges)
- To analyze the complete value chain and influence of all key stakeholders, such as manufacturers, suppliers, and end users
- To analyze the opportunities in the agrochemicals market for stakeholders and provide details of the competitive landscape for market leaders
- To profile the key players and comprehensively analyze their core competencies
- To analyze the competitive developments, such as new product launches, acquisitions, investments, expansions, partnerships, agreements, joint ventures, and product approvals, in the trace minerals in feed market
Available Customizations
With the given market data, MarketsandMarkets offers customizations according to the company’s specific needs.
The following customization options are available for the report:
Product Analysis
- Product Matrix, which gives a detailed comparison of the product portfolio of each company
Geographic Analysis
- Further breakdown of the Rest of Europe market for agrochemicals which includes countries such as Netherlands, Romania and the UK.
- Further breakdown of the Rest of Asia Pacific agrochemicals market, which includes countries such as Indonesia and Veitnam.
- Further breakdown of the Rest of South America market agrochemicals market which includes countries such as Peru, Paraguay and Peru.
Company Information
- Detailed analysis and profiling of additional market players (up to five)
Growth opportunities and latent adjacency in Agrochemicals Market
Interested in agrochemicalas, plant growth regulators and biofertilizers
Interested in the market for agrochemicals in the South America, mostly in Paraguay, Brazil and Argentina.
Need information regarding Nigeria and West Africa.
I want to know more about future business opportunities in the global market.
Interested global agricultural fertilizer and pesticide annual consumption globally
Interested in comparison analysis for South African companies vs. global leading players in the agrochemical industry
Interested in Pesticide and Biopesticide market estimates (current and Past)
Interested in fertilizer import data and suppliers in Myanmar.
Interested in knowing the market size of Pesticides in Zambia and major players by annual sales
Want to purchase full report on Agrochemicals Market - Global Trends & Forecast to 2020
Need information if contract research on agrochemicals is increasing?
Looking for global agrochemicals market by fertilizers and pesticides forecasted to 2020
Need details and statistics for India market
Interested in Agrochemicals market in Europe, North and Latin America, registration requirements; market trends, off-patent chemicals
Need information on challenges, growth drivers etc. Global Agrochemical Industry
Interested in knowing the latest trends in agri input industry
Interested in understanding more about integrated use of biological products in agriculture.
Interested in the company profiles of Bayer, Monsanto, Syngenta, BASF, Dow and DuPont.
Interested in market information regarding Controlled Release Fertilizers.
Need information on global consumption of pesticides
Need information regarding the buckets of value chain analysis.
Looking for information on global pesticide market, specialty agrochemicals from China, India and LatinAmerica along with trade data.