
Combined Heat and Power Market

Combined Heat and Power Market by Capacity (Up to 10 MW, 11�150 MW, 151�300 MW, and Above 300 MW), Prime Mover (Gas Turbine, Steam Turbine, Reciprocating Engine, Fuel Cell, Microturbine, Other Prime Movers), End User (Utilities, Industrial, Commercial, Residential), Fuel, and Region - Global Forecast to 2030


OVERVIEW
Source: Secondary Research, Interviews with Experts, MarketsandMarkets Analysis
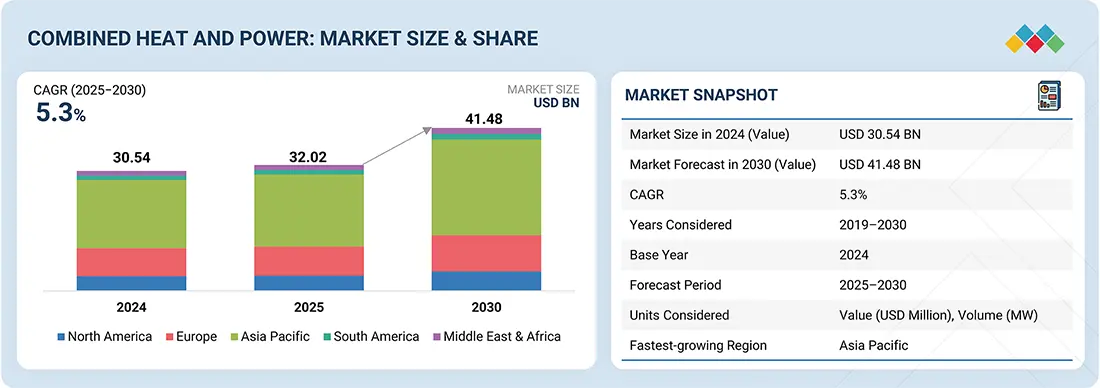
The combined heat and power market is projected to reach USD 41.48 billion by 2030 from USD 32.02 billion in 2025, at a CAGR of 5.3% from 2025 to 2030. There is a growing need for combined heat and power (CHP) systems due to increasing industrialization, stringent government energy policies, and rising electricity costs. This situation compels industrialists to adopt efficient technologies to reduce operational expenses and mitigate the harmful effects of pollution. CHP systems help minimize energy loss, support decarbonization efforts, and provide long-term cost savings, which enhances their popularity in industries such as manufacturing, HVAC, and transportation. Additionally, advancements in CHP technology and attractive financial offers promote widespread adoption, as companies aim to achieve sustainability goals and adapt to changing energy requirements.
Combined Heat and Power Market Size and Forecast:
- Market Size Value in 2024: USD 30.54 Billion
- Market Size Value in 2025: USD 32.02 Billion
- Revenue Forecast in 2030: USD 41.48 Billion
- Growth Rate: CAGR of 5.3% from 2025 to 2030
- Data available from 2019 to 2030
- The industrial end-user segment holds the largest market share due to increasing demand for energy-efficient and cost-effective power generation solutions.
Key Market Trends and Insights
- Market Growth: Driven by rising electricity costs, stringent energy efficiency regulations, and increasing adoption of decentralized power generation systems across industries.
- Growing Trends: The growing use of natural gas-fired CHP systems, integration of digital monitoring technologies, and increasing deployment of micro-CHP units are reshaping the market landscape.
- Growth Opportunities: Expansion of district heating networks, replacement of aging power generation equipment, and supportive government incentives for low-carbon technologies are creating significant market opportunities.
- Market Share Analysis: The industrial end-user segment accounts for the largest market share in 2025 owing to its high and continuous energy requirements, while the natural gas fuel segment remains dominant due to its high efficiency, lower emissions, and favorable economics.
KEY TAKEAWAYS
-
BY END USERThe end-user segment includes industrial, commercial, residential, and utilities. The industrial end-user segment is driven by the need for energy efficiency, rising electricity costs, and stringent government regulations aimed at reducing carbon emissions.
-
BY CAPACITYThe capacity segment includes up to 10 MW, 11–150 MW, 151–300 MW, and above 300 MW. The 11–150 MW capacity segment is widely used in industrial settings like manufacturing and chemicals, where it provides a balance between efficiency and scalability, meeting significant energy demands while utilizing waste heat effectively.
-
BY FUELThe fuel segment includes coal, natural gas, biogas/biomass, nuclear, diesel, and other fuels. Natural gas-powered CHP systems are widely adopted in industrial, commercial, and residential applications, aligning with sustainability goals and regulatory pressures to reduce carbon footprints.
-
BY PRIME MOVERThe prime mover segment includes gas turbine, steam turbine, reciprocating engine, fuel cell, microturbine, and other prime movers. Reciprocating engines are particularly popular in industrial and commercial applications, offering reliable power generation and effective heat recovery.
-
BY REGIONThe regions considered are North America, Europe, Asia Pacific, South America, and the Middle East & Africa. The Asia Pacific leads due to escalating electricity and heating needs, with China and India leading in power generation growth. CHP systems provide reliable, decentralized power, mitigating supply disruptions.
-
COMPETITIVE LANDSCAPEMajor market players use organic and inorganic strategies, such as partnerships and investments, to drive growth in combined heat and power applications. Companies such as GE Vernova, Veolia, Wartsila, MITSUBISHI HEAVY INDUSTRIES, and Siemens Energy have entered various agreements, contracts, and product launches to meet the increasing demand for combined heat and power in innovative uses.
The projected growth in the demand for combined heat and power (CHP) systems is primarily driven by industrial stakeholders and government agencies aiming to achieve significant energy savings, reduce carbon emissions, and comply with stricter efficiency standards. The accelerating trends of industrialization and urbanization, along with an increase in applications across the manufacturing, HVAC, and transport sectors, are further promoting the adoption of CHP systems. This shift is supported by sustainability policies, decarbonization efforts, and rapid advancements in technology.
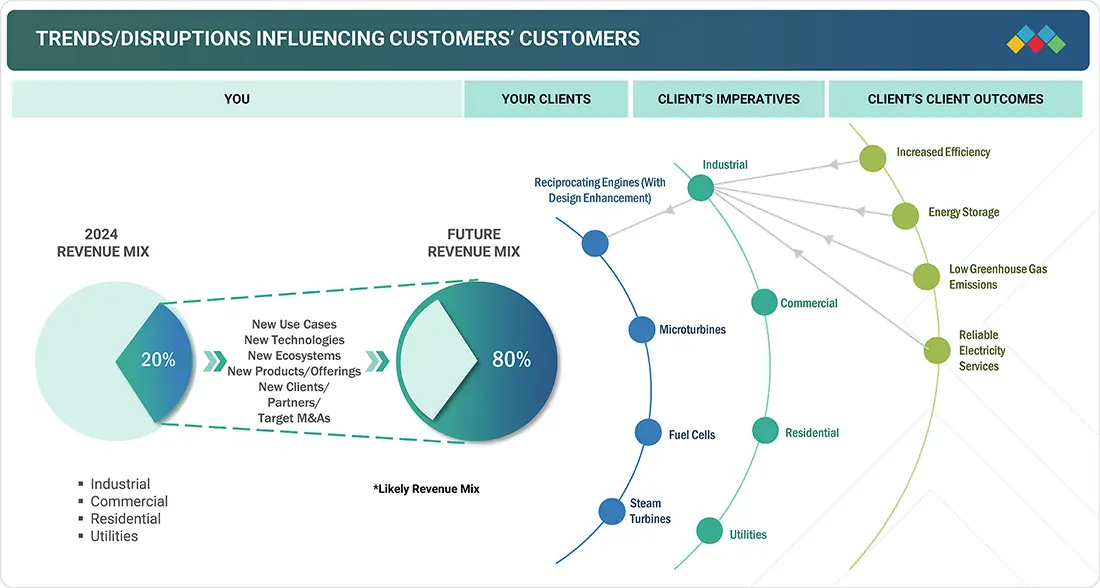
TRENDS & DISRUPTIONS IMPACTING CUSTOMERS' CUSTOMERS
The combined heat and power market is projected to grow at a CAGR of 5.3% during the forecast period, by value. Growing decarbonization goals and the rising demand for renewable energy are driving market growth. Global government initiatives supporting the adoption of CHP systems are anticipated to provide significant expansion opportunities for market participants.
Source: Secondary Research, Interviews with Experts, MarketsandMarkets Analysis
MARKET DYNAMICS
Level
-
Favorable government programs and incentives

-
Growing demand for natural gas for power generation

Level
-
Rising concerns over stable natural gas supply

Level
-
Rise in deployment of micro-CHP systems

-
Growing replacement and upgrade of aged power generation equipment

Level
-
Damaged prime movers due to high contamination from biogas fuel

Source: Secondary Research, Interviews with Experts, MarketsandMarkets Analysis
Driver: Growing demand for natural gas for power generation
The transition away from coal-based power generation has led to a greater adoption of natural gas as a fuel source for combined heat and power (CHP) systems. In many countries worldwide, the share of natural gas in the energy mix is rapidly increasing. There has been a gradual shift from coal- and diesel-powered plants to gas-powered plants on a global scale. This rise in natural gas usage can be attributed to declining prices and increased production, particularly in North America and the Asia Pacific region. The surge in natural gas use for power generation has significantly driven the demand for combined heat and power systems. In the US, advancements in extraction technologies such as hydraulic fracturing (fracking) and horizontal drilling have resulted in a boom in natural gas production. This abundance has led to relatively low and stable natural gas prices compared to other fossil fuels, making it an appealing option for power generation. Natural gas is considered a cleaner-burning fossil fuel than coal and oil because it emits lower levels of greenhouse gases and pollutants, such as sulfur dioxide and particulate matter. As environmental regulations become stricter and public awareness of climate change increases, many power producers are transitioning from coal-fired generation to natural gas-fired generation to reduce emissions. Combined heat and power systems offer higher energy efficiency compared to conventional generation methods by capturing and utilizing waste heat that would otherwise be lost. Natural gas-fired CHP systems are particularly efficient, achieving total system efficiencies of up to 80% or higher. This increased efficiency leads to lower fuel consumption and operating costs for end users, making CHP systems economically attractive.
Restraint: Rising concerns over stable natural gas supply
Natural gas is a vital energy resource for combined heat and power (CHP) plants, making the development of proper infrastructure essential to tap into its potential. However, building natural gas pipelines is a complex and costly endeavor. The construction process is influenced by various factors, including environmental regulations, average capacity factors, gas flow (in cubic meters per day), gas production, and the length of the pipeline. The South Stream pipeline project, which runs through Bulgaria, has faced challenges due to political tensions between Russia and the European Union. Additionally, a significant 30-year gas supply agreement between Russia and China, signed in 2014, involves nearly USD 30 billion allocated for the construction of pipelines and related infrastructure, although the financing details are still pending. Consequently, ongoing concerns about stable natural gas supply and adequate infrastructure pose challenges for the combined heat and power market.
Opportunity: Rise in deployment of micro-CHP systems
Micro-CHP is a technology that simultaneously generates heat and electricity from the same energy source in individual homes or buildings. The primary output of a micro-CHP system is heat, with some electricity generation at a typical ratio of about 6:1 for domestic appliances. These systems typically have an output of less than 50 kW, making them ideal for sectors with relatively low energy demands, such as residential homes and small commercial buildings. Micro-CHP systems resemble standard domestic boilers in size and shape, which allows for versatile installation in various locations. In the residential sector, electrical capacities usually reach up to 5 kilowatts electric (kWel), with heat capacities up to 20 kilowatts thermal (kWth). In public and small to medium-sized enterprise (SME) buildings, the electrical capacity can range from 5 to 50 kWel, and thermal capacities can go up to 250 kWth.
Challenge: Damaged prime movers due to high contamination from biogas fuel
One of the major challenges in combined heat and power (CHP) plants is understanding the importance of gas pretreatment and developing an effective strategy for it. Biogas-fueled combined heat and power systems utilize prime movers, such as gas turbines, microgas turbines, reciprocating engines, or Stirling engines. These systems operate by oxidizing methane in a combustion chamber, which generates thermal energy and drives a piston or turbine. The resulting mechanical work is then converted into electricity by a generator. In many cases, methane is the primary fuel used in each type of prime mover, and when fuel cells are in operation, methane is oxidized electrochemically. While biogas typically contains nitrogen (N2) and carbon dioxide (CO2), which generally do not damage the prime mover, these gases can dilute the fuel and reduce overall performance. However, trace impurities such as hydrogen sulfide (H2S), carbon monoxide (CO), and ammonia (NH3) can have more harmful effects on the prime mover. When H2S is oxidized, it produces sulfur dioxide (SO2) and sulfuric acid (H2SO4), both of which can lead to corrosion and damage to the prime mover. Additionally, siloxanes present in the biogas can be oxidized in the combustion chamber, generating silicon dioxide (SiO2) in solid form, which adversely affects both turbines and pistons. Although prime movers can tolerate small amounts of these impurities, higher concentrations can significantly shorten the lifespan of combined heat and power systems to just a few years.
combined heat and power market: COMMERCIAL USE CASES ACROSS INDUSTRIES
| COMPANY | USE CASE DESCRIPTION | BENEFITS |
|---|---|---|
 |
Deploys CHP systems in industrial plants to utilize waste heat for both electricity and process heating | Lower fuel costs, reduced carbon emissions |
 |
Implements CHP in power generation operations to supply both electricity and high-temperature steam for continuous operations | Improved reliability of power supply, reduced operational costs |
 |
Installs CHP units in commercial science parks and research facilities to supply electricity, heating, and cooling for labs and office spaces | Increased energy resilience, decreased utility costs |
Logos and trademarks shown above are the property of their respective owners. Their use here is for informational and illustrative purposes only.
MARKET ECOSYSTEM
The market map provides a quick snapshot of the key stakeholders involved in the combined heat and power market, from component providers and end users to regulatory bodies/standards organizations. This list is not exhaustive and is meant to give an idea of the key market players.
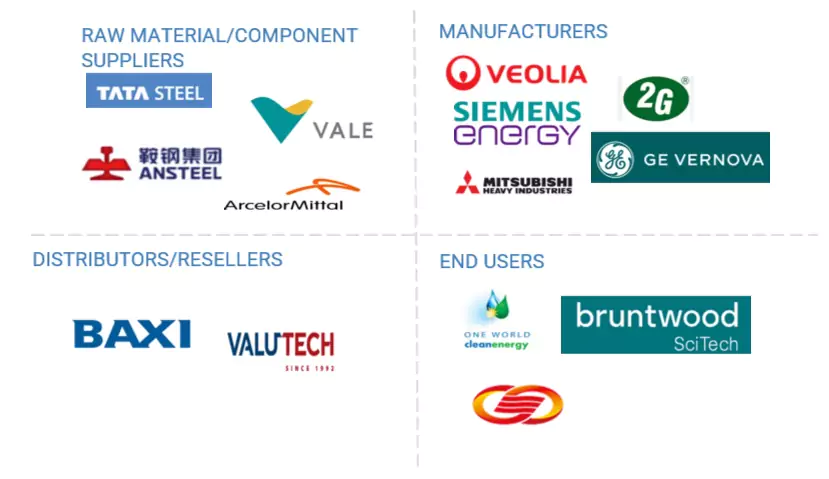
Logos and trademarks shown above are the property of their respective owners. Their use here is for informational and illustrative purposes only.
MARKET SEGMENTS
Source: Secondary Research, Interviews with Experts, MarketsandMarkets Analysis
Combined Heat and Power Market, By End User
The combined heat and power (CHP) market has distinct dynamics across its end-user segments: industrial, commercial, residential, and utilities. The industrial segment is the largest, mainly due to the extensive use of CHP systems in energy-intensive sectors such as steel, cement, and pulp & paper. These systems provide reliable on-site power and heat, reducing energy costs by up to 30%. The commercial segment is experiencing rapid growth, driven by its use in hospitals, universities, and data centers. These facilities benefit from CHP's ability to ensure uninterrupted power and reduce emissions. The residential segment is emerging, particularly in Europe and Japan, with micro-CHP units providing households with efficient heating and electricity, supported by government incentives. The utilities segment is expanding as CHP systems integrate with district heating networks and renewable energy sources. This enhances grid resilience and supports decarbonization goals in countries such as China.
Combined Heat and Power Market, By Capacity
The combined heat and power (CHP) market is divided by capacity into four segments: up to 10 MW, 11–150 MW, 151–300 MW, and above 300 MW, each serving specific needs. The up to 10 MW segment is commonly used for small-scale applications, such as commercial buildings, hospitals, and small industrial facilities. This segment provides efficient heat and power solutions with quick installation and lower initial costs. The 11–150 MW segment is prevalent in medium to large industrial settings, including manufacturing and chemical plants. It strikes a balance between scalability and efficiency and is widely used in regions like the Asia Pacific. The 151–300 MW segment caters to large industrial complexes and district heating systems, ensuring a reliable energy supply and effective heat recovery in energy-intensive operations, such as refineries. Finally, the above 300 MW segment is used in utility-scale projects and major industrial hubs. This capacity supports grid stability and large-scale cogeneration, particularly in countries with advanced energy infrastructure like Germany and the US.
Combined Heat and Power Market, By Fuel
The combined heat and power (CHP) market is categorized by fuel types, including coal, natural gas, biogas/biomass, nuclear, diesel, and other fuels. Natural gas leads the market due to its high efficiency, lower emissions, and widespread availability, making it an ideal choice for industrial and commercial CHP systems. Biogas and biomass are increasingly gaining popularity as renewable options, particularly in Europe and North America, as they contribute to sustainability goals through waste-to-energy solutions. Although coal remains significant in regions like the Asia Pacific for large-scale industrial CHP, its usage is declining due to environmental concerns. Diesel is often used as a reliable backup fuel for remote or small-scale CHP units, especially in developing areas. Nuclear CHP is utilized in specific utility-scale projects to provide consistent baseload power and heat. Other fuels, such as hydrogen, are emerging as experimental options for future decarbonization efforts.
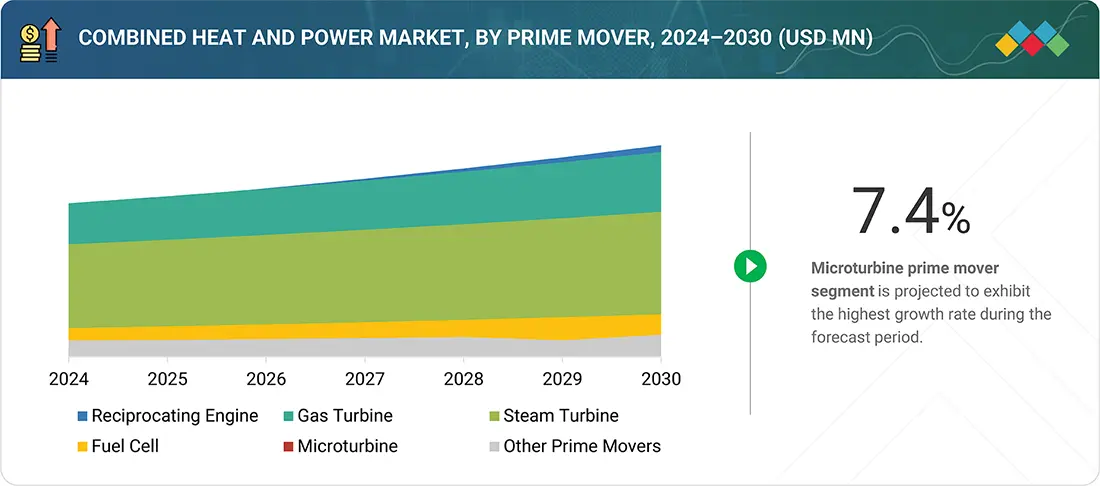
Combined Heat and Power Market, By Prime Mover
The combined heat and power (CHP) market is divided into segments based on the type of prime mover used. These include gas turbines, steam turbines, reciprocating engines, fuel cells, microturbines, and other prime movers, each designed for specific applications. Reciprocating engines are the most popular choice due to their flexibility, high efficiency, and ability to run on various fuels such as natural gas and biogas. They are commonly found in industrial and commercial settings. Gas turbines are primarily used in large-scale industrial and utility applications, where they provide high power output and efficiency for continuous operation. Steam turbines are effective in large industrial processes and district heating systems, as they can utilize waste heat from existing setups. Fuel cells are gaining traction because of their low emissions and suitability for residential and small commercial CHP systems, particularly with advancements in hydrogen technology. Microturbines are favored for small-scale, decentralized applications due to their compact design and reliability. Other prime movers, such as organic Rankine cycle systems, are emerging for specialized, highly efficient uses.
REGION
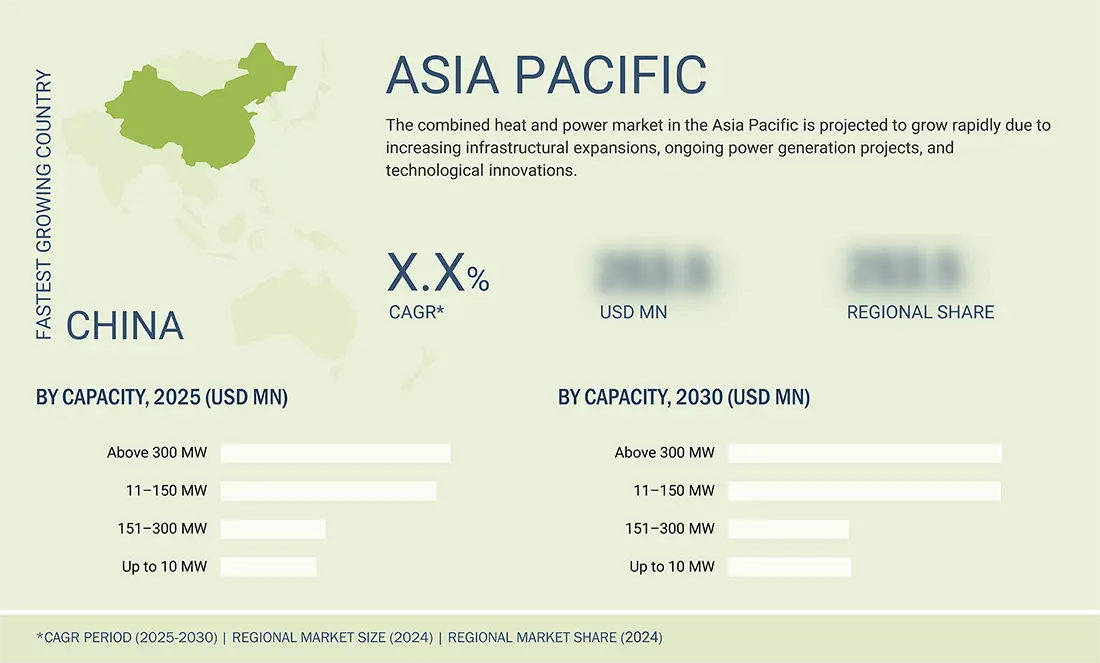
Asia Pacific to be fastest-growing region in global combined heat and power market during forecast period
The Asia Pacific is the fastest-growing regional segment in the global combined heat and power (CHP) market, driven by its position as the largest energy consumer in the world. Countries like China, India, Japan, and South Korea are increasing demand through rapid industrialization and urbanization. CHP systems are being increasingly integrated into manufacturing hubs, commercial complexes, and residential microgrids. These systems efficiently generate energy on-site by utilizing natural gas and biomass. Key applications of CHP span various industrial sectors, such as chemicals and food processing in China, commercial buildings like hospitals and IT parks in India, and utility services including district heating in Japan. This growth is supported by technological advancements in reciprocating engines and gas turbines.
combined heat and power market: COMPANY EVALUATION MATRIX
In the combined heat and power market matrix, GE Vernova (Star) stands out with a robust market presence and a diverse product portfolio, enabling significant adoption across various industries, including industrial and commercial sectors. Robert Bosch GmbH (Emerging Leader) is also gaining momentum with its high-efficiency combined heat and power systems. While GE Vernova dominates due to its scale, Robert Bosch GmbH demonstrates strong growth potential, positioning itself to advance toward the leaders' quadrant.

Source: Secondary Research, Interviews with Experts, MarketsandMarkets Analysis
KEY MARKET PLAYERS
MARKET SCOPE
| REPORT METRIC | DETAILS |
|---|---|
| Market Size in 2024 (Value) | USD 30.54 Billion |
| Market Forecast in 2030 (Value) | USD 41.48 Billion |
| Growth Rate | CAGR of 5.3% from 2025–2030 |
| Years Considered | 2019–2030 |
| Base Year | 2024 |
| Forecast Period | 2025–2030 |
| Units Considered | Value (USD Million), Volume (MW) |
| Report Coverage | Revenue forecast, company ranking, competitive landscape, growth factors, and trends |
| Segments Covered |
|
| Regions Covered | North America, Europe, Asia Pacific, South America, and the Middle East & Africa |
WHAT IS IN IT FOR YOU: combined heat and power market REPORT CONTENT GUIDE
DELIVERED CUSTOMIZATIONS
We have successfully delivered the following deep-dive customizations:
| CLIENT REQUEST | CUSTOMIZATION DELIVERED | VALUE ADDS |
|---|---|---|
| US-based Combined Heat and Power System Manufacturer | Detailed company profiles of competitors (financials, product portfolio) | Identify interconnections and supply chain blind spots |
| End-user Segmentation | Comprehensive list of customers with segmentation by end user & capacity | Insights on revenue shifts towards emerging composite applications |
| Combined Heat and Power System Manufacturer | Transformative improvements in efficiency and performance, balancing initial cost challenges with long-term operational and system-level economic advantages | Support entry into utilities value chain with tailored opportunity mapping |
| US-based Combined Heat and Power System Raw Material Supplier | Global & regional production capacity benchmarking | Strengthen forward integration strategy |
| Combined Heat and Power System Customer | Patent landscape & IP strength mapping in combined heat and power system in utilities | Support backward integration into CHP system sourcing |
RECENT DEVELOPMENTS
- August 2024 : Wärtsilä Corporation secured contracts to supply gas-fueled generating sets for two combined heat and power (CHP) plants in Hungary, with one plant situated at Füredi út in Budapest. The project, led by Kraftszer Kft., will feature three Wärtsilä 18V34SG generating sets, providing a total electrical output of 18,000 kW for Zugló-Therm Energiaszolgáltató Kft.
- February 2024 : MITSUBISHI HEAVY INDUSTRIES invested in Fervo Energy, an innovative geothermal technology startup based in Houston, Texas. The investment, facilitated through Mitsubishi Heavy Industries America, involves collaboration with a consortium of investors, including Devon Energy Corporation and Marunouchi Innovation Partners, among others.
- August 2023 : 2G Energy expanded its core cogeneration business by acquiring Dutch heat pump manufacturer, NRGTEQ, adding an innovative division to its portfolio. This move aligns with the growing political emphasis on electrifying the heating sector, showcasing 2G Energy's commitment to diverse and sustainable energy solutions.
- June 2021 : MITSUBISHI HEAVY INDUSTRIES secured a contract from Jiangsu Shagang Group to supply a 180-megawatt (MW) class gas turbine combined cycle (GTCC) power plant fired by blast furnace gas (BFG). The plant will include the M701SDAX gas turbine as a key component, heat recovery steam generator, steam turbine, generator, gas compressor, and auxiliary equipment.
- March 2021 : 2G Energy secured a contract via a collaboration between European Marine Energy Centre (UK) & Highlands and Islands Airports Limited (UK). 2G Energy will deliver a CHP plant generating heat and electricity of 100% hydrogen. The hydrogen CHP system is coupled with the existing heating system of Kirkwall Airport to meet the heating and power requirements of the main airport buildings.
Table of Contents
 Exclusive indicates content/data unique to MarketsandMarkets and not available with any competitors.
Methodology
The study involved major activities in estimating the current size of the combined heat and power market. Exhaustive secondary research was done to collect information on the peer and parent markets. The next step was to validate these findings, assumptions, and sizing with industry experts across the value chain through primary research. Both top-down and bottom-up approaches were employed to estimate the complete market size. Thereafter, market breakdown and data triangulation were used to estimate the market size of the segments and subsegments.
Secondary Research
This research study on the combined heat and power market involved the use of extensive secondary sources, directories, and databases, such as Hoovers, Bloomberg, Businessweek, Factiva, International Energy Agency, and BP Statistical Review of World Energy, to identify and collect useful information for a technical, market-oriented, and commercial study of the global combined heat and power market. The other secondary sources included annual reports, press releases, and investor presentations of companies, white papers, certified publications, articles by recognized authors, manufacturer associations, trade directories, and databases.
Primary Research
The combined heat and power market comprises stakeholders such as combined heat and power manufacturers, technology providers, and support providers in the supply chain. The demand side of this market is characterized by the rising demand for energy-efficient systems in countries due to increasing needs for sustainability, reduced carbon emissions, and cost-effective power generation. The supply side is characterized by rising demand for contracts from industrial users and utilities, and mergers & acquisitions among big players. Various primary sources from both the supply and demand sides of the market were interviewed to obtain qualitative and quantitative information. The following is the breakdown of primary respondents:

Note: “Others” include sales managers, engineers, and regional managers
The tiers of the companies are defined based on their total revenue as of 2024: Tier 1: >USD 1 billion, Tier 2:
USD 500 million–1 billion, and Tier 3:
To know about the assumptions considered for the study, download the pdf brochure
Market Size Estimation
Both the top-down and bottom-up approaches were used to estimate and validate the size of the combined heat and power market and its dependent submarkets. The key players in the market were identified through secondary research, and their market share in the respective regions was obtained through primary and secondary research. The research methodology includes the study of the annual and financial reports of top market players and interviews with industry experts, such as chief executive officers, vice presidents, directors, sales managers, and marketing executives, for key quantitative and qualitative insights related to the combined heat and power market.
Combined Heat and Power Market : Top-Down and Bottom-Up Approach

Data Triangulation
After arriving at the overall market size from the estimation process explained above, the total market has been split into several segments and subsegments. To complete the overall market engineering process and arrive at the exact statistics for all the segments and subsegments, the data triangulation and market breakdown processes have been employed, wherever applicable. The data has been triangulated by studying various factors and trends from both the demand and supply sides. Along with this, the market has been validated using both the top-down and bottom-up approaches.
Market Definition
Combined heat and power (CHP) is an energy-efficient technology that generates electricity and captures the heat that would otherwise be wasted to provide useful thermal energy, such as steam or hot water. This steam or hot water, in turn, can be used for heating, cooling, and other domestic and industrial processes. CHP can be implemented for different types of prime movers, such as gas turbines, steam turbines, reciprocating engines, fuel cells, and microturbines. CHP, also called cogeneration, can be used in an individual facility/building or a district energy/utility resource. CHP systems are typically employed at facilities where there is a need for electricity and thermal energy. It provides benefits such as a reduction in dependency on grid support due to on-site electricity generation, enhanced reliability, reduced costs of energy and initial setup, increased resiliency against power disruption, and reduction in harmful emissions. CHP systems can handle critical electrical and thermal loads during grid power outages. Microturbines are a type of combustion turbine that produces both heat and electricity on a relatively small scale.
Stakeholders
- Consulting companies in energy sector
- Distributed energy associations
- Environmental associations
- EPC contractors for CHP
- Manufacturers of fuel cells and microturbines
- Manufacturers of gas and steam turbines
- Government and research organizations
- Investment banks
- Power companies
- Manufacturers of reciprocating engines
Report Objectives
- To describe and forecast the combined heat and power market based on capacity, prime mover, fuel, end user, and region in terms of value
- To describe and forecast the combined heat and power market based on region in terms of volume
- To describe and forecast the combined heat and power market for various segments with respect to five main regions: North America, Europe, Asia Pacific, South America, and the Middle East & Africa, in terms of value
- To provide detailed information regarding the drivers, restraints, opportunities, and challenges influencing the growth of the market
- To provide a detailed overview of the combined heat and power value chain analysis, use case analysis, key stakeholders and buying criteria, patent analysis, trade analysis, tariff analysis, regulations and codes, pricing analysis, Porter’s five forces analysis, impact of AI, and US Tariff impact
- To strategically analyze micromarkets1 with respect to individual growth trends, prospects, and contributions to the total market
- To analyze opportunities in the market for various stakeholders by identifying high-growth segments
- To strategically profile key players and comprehensively analyze their market position in terms of ranking and core competencies2, along with detailing the market’s competitive landscape
- To analyze growth strategies adopted by market players, such as joint ventures, partnerships, mergers & acquisitions, contracts, agreements, and product launches in the combined heat and power market
Micromarkets1 are defined as the segments and subsegments of the combined heat and power market included in the report.
Core competencies2 of companies are captured in terms of their key developments and product portfolios, as well as the key strategies adopted by them to sustain their position in the combined heat and power market.
Available Customizations
MarketsandMarkets offers customizations according to the specific needs of the companies with the given market data.
The following customization options are available for the report:
Product Analysis
- Product matrix, which gives a detailed comparison of the product portfolio of each company
Geographic Analysis as per Feasibility
- Further breakdown of the eFuse, by country
Company Information
- Detailed analysis and profiling of additional market players (up to five)
Key Questions Addressed by the Report
What was the combined heat and power market size in 2024?
The combined heat and power market size was USD 30.54 billion in 2024.
What are the major drivers for the combined heat and power market?
The combined heat and power market is mainly driven by favorable government programs and incentives to promote the adoption of CHP systems and the rise in the use of natural gas for power generation.
Which region is projected to be the fastest-growing combined heat and power market during the forecast period?
Asia Pacific is expected to be the fastest-growing market between 2025 and 2030, fueled by rapid urbanization, industrial expansion, and the escalating need for energy efficiency.
Which will be the largest segment, by prime mover, in the combined heat and power market during the forecast period?
The reciprocating engine segment is expected to hold the dominant share of the combined heat and power market.
Which segment is projected to be the largest end user in the combined heat and power market during the forecast period?
The industrial segment is estimated to account for the largest market share during the forecast period.
Need a Tailored Report?
Customize this report to your needs
Get 10% FREE Customization
Customize This ReportPersonalize This Research
- Triangulate with your Own Data
- Get Data as per your Format and Definition
- Gain a Deeper Dive on a Specific Application, Geography, Customer or Competitor
- Any level of Personalization
Let Us Help You
- What are the Known and Unknown Adjacencies Impacting the Combined Heat and Power Market
- What will your New Revenue Sources be?
- Who will be your Top Customer; what will make them switch?
- Defend your Market Share or Win Competitors
- Get a Scorecard for Target Partners

Custom Market Research Services
We Will Customise The Research For You, In Case The Report Listed Above Does Not Meet With Your Requirements
Get 10% Free CustomisationTESTIMONIALS

Kimberly Murphy
GLOBAL MARKETING DIRECTOR
Bently Nevada,
Leading Condition Monitoring & Asset Protectionwww.bakerhughesds.com/bently-nevada

MarketsandMarkets™ showed consistent rigor for success and relentlessly worked with Bently Nevada stakeholders to positively impact go-to-market strategy. Their proactiveness and flexibility has been instrumental in achieving the objectives to grow our sales pipeline in key industrial markets.

DARRICK HUEBER
Business Development Leader
Nexus Controls LLC,
Leading Manufacturer of Automation System & Electrical Panelswww.bakerhughesds.com/nexus-controls

We partnered with MarketsandMarkets to expand our business further by tapping into new industrial segments. It was critical for us to gather crucial business insights about specific markets to achieve this goal. MarketsandMarkets engagement model and client services helped us provide those insights, it was really impressive and valuable for my business. The team was extremely flexible and helpful.

Mike Schoff
Global Industrial Commercial Strategy Leader
Nexus Controls LLC
Leading Manufacturer of Automation System & Electrical Panelswww.bakerhughesds.com/nexus-controls
We consulted MarketsandMarkets for potential Partner Identification. Overall, it was a good experience. The insights provided through interviews conducted by the team helped us put together the questionnaire required for discussion with the selected partners. Their ability to provide insights through interviews with customers in a timely manner was quite impressive.


Growth opportunities and latent adjacency in Combined Heat and Power Market