Waterproofing Admixture Market by Type (Crystalline, Pore Blocking and Others), by Application (Building & Construction, Public Infrastructure, and Commercial Space) - Global Forecast to 2020
The waterproofing admixture market, along with its applications, has witnessed a high growth in the past few years which is estimated to increase in the coming years. This growth is largely fueled by the increasing applications, technological advancements, and growing demand in the Asia-Pacific region.
Asia-Pacific is the biggest and the fastest-growing region due to the growing demand for waterproofing admixture in India, China, Japan, and South Korea. North America and Europe are matured markets and are expected to grow at a low CAGR in comparison with Asia-Pacific till 2020.
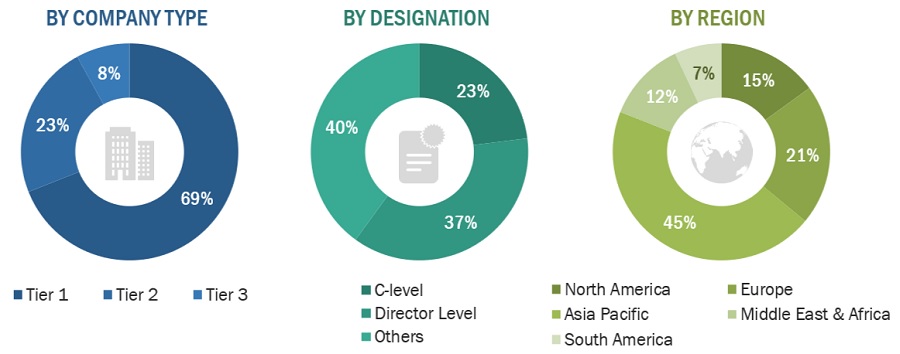
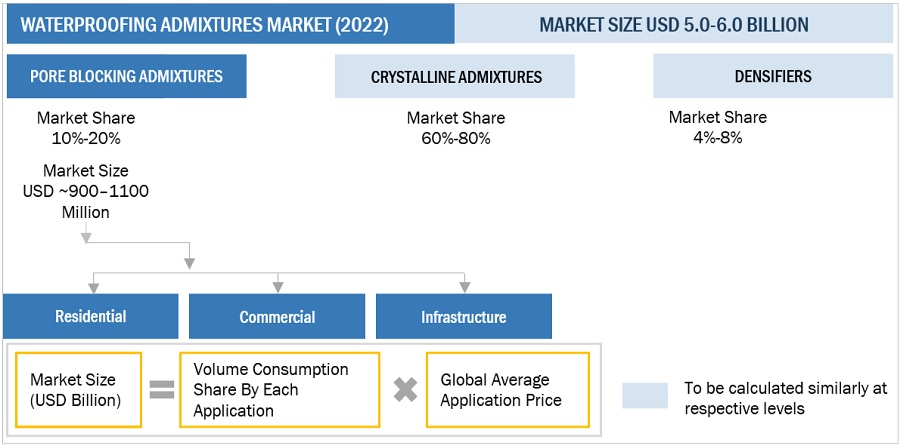
This study basically aims to estimate the market of waterproofing admixtures for 2015 and to project its demand by 2020. This market research study provides a detailed qualitative and quantitative analysis of the waterproofing admixtures market. Various secondary sources have been used such as directories, industry journals, and databases to identify and collect information useful for this extensive commercial study of the waterproofing admixture market. The primary sources experts from related industries and suppliershave been interviewed to obtain and verify critical information as well as to assess prospects of waterproofing admixtures.
Competitive scenarios of the top players in the waterproofing admixture market have been discussed in detail. Leading players of this industry have also been profiled with their recent developments and other strategic industry activities. These include key waterproofing admixtures manufacturers such as BASF SE (Germany), W.R. Grace (U.S.), RPM International (U.S.), Sika A.G. (Switzerland), Fosroc International (U.K.), Dow Corning Corporation (U.S.), Wacker Chemie A.G (Germany), Xypex Chemical Corporation (U.S.), Evonik A.G. (Germany), Mapei S.p.A (Italy), and Pidilite Industries (India).
Get online access to the report on the World's First Market Intelligence Cloud
Request Sample Scope of the Report
The waterproofing admixture market is segmented as follows:
The waterproofing admixture market has been covered in detail in this report. In order to provide an all-round picture, the current market demand and forecasts have also been included.
By type:
- Crystalline
- Pore Blocking
- Others
On the basis of application:
- Building & Construction
- Public Infrastructure
- Commercial Space
On the basis of region:
- North America
- Europe
- Asia-Pacific
- Middle East and Africa
- South America
The market is further analyzed for key countries in each of these regions.
The global waterproofing admixture market (20152020) is estimated to reach USD 3.77 Billion by 2020 growing at a rate of 8.16% between 2015 and 2020.
The waterproofing admixtures market, along with its applications, registered a high growth in the past few years which is estimated to continue in the coming years supported by growing construction industry in Asia-pacific and Middle East & Africa regions. The demand for waterproofing admixtures depends on new construction and its maintenance and repair activities. The demand for these admixtures is mainly driven by growing requirements for housing and infrastructure. It is also influenced by consumer awareness, need for durable and aesthetic civil structure, and other benefits achieved in making concrete structure more economical for contractors and other interest holders
Currently, the Asia-Pacific region is the largest consumer of waterproofing admixtures and is estimated to grow at the highest CAGR. Countries such as China, Japan, and India are expected to lead the Asia-Pacific waterproofing admixtures market, with China having the largest share in the regional demand of waterproofing admixtures. The market size, in terms of volume, of waterproofing admixtures is comparatively low in the South American region, but the estimated growth of the region is the third highest after Asia-Pacific and Middle East & Africa.
The Asia-Pacific and Middle East & Africa regions are the most active markets in terms of strategic initiatives, owing to their market demands. The construction industry has led the rapid growth in the waterproofing admixture market.
The significant waterproofing admixture manufacturers include BASF SE (Germany), W.R. Grace (U.S.), RPM International (U.S.), Sika A.G. (Switzerland), Fosroc International (U.K.), Dow Corning Corporation (U.S.), Wacker Chemie A.G (Germany), Xypex Chemical Corporation (U.S.), Evonik A.G. (Germany), Mapei S.p.A (Italy), and Pidilite Industries (India) and other local players.
This report covers the waterproofing admixture market by key regions and important countries in each of these regions. It also provides a detailed segmentation of the market on the basis of different types along with their key applications up to 2020.
Table of Contents
1 Introduction (Page No. - 15)
1.1 Objectives of the Study
1.2 Market Definition
1.3 Scope of the Study
1.3.1 Regional Scope
1.3.2 Markets Covered
1.3.3 Years Considered in the Report
1.4 Currency & Pricing
1.5 Limitations
1.6 Stakeholders
2 Research Methodology (Page No. - 19)
2.1 Research Data
2.2 Secondary Data
2.2.1.1 Key Data From Secondary Sources
2.3 Primary Data
2.3.1.1 Key Data From Primary Sources
2.3.1.2 Key Industry Insights
2.3.1.3 Breakdown of Primary Interviews
2.4 Market Size Estimation
2.4.1 Bottom-Up Approach
2.4.2 Top-Down Approach
2.5 Market Breakdown & Data Triangulation
2.6 Research Assumptions & Limitations
2.6.1 Assumptions
2.6.2 Limitations
3 Executive Summary (Page No. - 31)
4 Premium Insights (Page No. - 35)
4.1 Attractive Opportunities in Waterproofing Admixtures Market
4.2 Waterproofing Admixtures: Lifecycle Analysis, By Region
5 Market Overview (Page No. - 40)
5.1 Introduction
5.1.1 Market Segmentation
5.2.1 Waterproofing Admixtures Market, By Type
5.2 Market Dynamics.
5.2.2 Drivers
5.2.1.1 High Demand in Developing Countries
5.2.1.2 Improving Quality & Economics of Construction
5.2.1.3 Growing Urbanization Trend
5.2.3 Restraints
5.2.1.5 Established Infrastructure in Developed Countries
5.2.1.6 Unstable Economic Cycles
5.2.4 Opportunities
5.2.1.7 Utilization of Ready-To-Mix Concrete (Rmc) in Developing Countries
5.2.1.8 Development of New Products & Services
5.2.5 Challenges
5.2.1.9 Unstable Cost of Raw Materials and Energy
6 Industry Trends (Page No. - 47)
6.1 Introduction
6.2 Value-Chain Analysis
6.3 Porters Five Forces Analysis
6.3.1 Threat 0f New Entrants
6.3.2 Threat of Substitutes
6.3.3 Bargaining Power of Buyers
6.3.4 Bargaining Power of Suppliers
6.3.5 Degree of Competition
6.4 Regulatory Framework
7 Waterproofing Admixtures Market Analysis, By Type (Page No. - 53)
7.1 Introduction
7.2 Pore Blocking Admixture
7.3 Crystalline Waterproofing Admixture
7.4 Others Waterproofing Admixture
8 Waterproofing Admixtures Market, By Application (Page No. - 61)
8.1 Introduction
8.2 Building & Construction
8.3 Public Infrastructure
8.4 Commercial Space
9 Waterproofing Admixtures Market, By Region (Page No. - 69)
9.1 Introduction
9.2 Asia-Pacific
9.2.1 China
9.2.2 India
9.2.4 South Korea
9.3 Middle East & Africa
9.3.1 Egypt
9.3.2 Iran
9.3.3 Saudi Arabia
9.3.4 U.A.E.
9.4 Europe
9.4.1 Turkey
9.4.2 Italy
9.4.3 Poland
9.4.4 Spain
9.4.5 Germany
9.4.6 France
9.5 North America
9.5.1 U.S.
9.5.2 Mexico
9.5.3 Canada
10 Competitive Landscape (Page No. - 104)
10.1 Introduction
10.2 Maximum Developments Between 2012 and 2015
10.3 Growth Strategies in the Waterproofing Admixtures Market
10.4 BASF SE & Pidilite Industries: the Most Active Participants
10.5 Competitive Situation & Trends
10.5.1 New Product Development & Launch
10.5.2 Partnerships, Agreements & Collaborations
10.5.3 Expansions
10.5.4 Mergers & Acquisitions
11 Company Profiles (Page No. - 112)
11.1 BASF SE
11.1.1 Overview
11.1.2 Products Offered
11.1.3 Key Strategy
11.1.4 Recent Developments
11.1.5 SWOT Analysis
11.2 SIKA AG
11.2.1 Overview
11.2.2 Products Offered
11.2.3 Key Strategy
11.2.4 Recent Developments
11.2.5 SWOT Analysis
11.3 W.R. Grace & Co.
11.3.1 Overview
11.3.2 Products Offered
11.3.3 Key Strategy
11.3.4 Recent Developments
11.3.5 SWOT Analysis
11.4 Wacker Chemie AG
1.1.1 Business Overview
1.1.2 Products Offered
1.1.3 Key Strategy
1.1.4 Recent Developments
1.1.5 SWOT Analysis
11.5 DOW Corning Corporation.
1.1.6 Business Overview
1.1.7 Products Offered
1.1.8 Key Strategy
1.1.9 SWOT Analysis
11.6 RPM International Inc.
11.6.1 Overview
11.6.2 Products Offered
11.6.3 Key Strategy
11.6.4 Recent Developments
11.7 Pidilite Industries
11.7.1 Overview
11.7.2 Products Offered
11.7.3 Strategy & Insights
11.7.4 Recent Developments
11.8 Evonik Industries
11.8.1 Overview
11.8.2 Products Offered
11.8.3 Strategy & Insights
11.9 Fosroc International Ltd
11.9.1 Overview
11.9.2 Products Offered
11.9.3 Strategy & Insights
11.9.4 Recent Developments
11.10 Mapei S.P.A.
11.10.1 Overview
11.10.2 Products Offered
11.10.3 Strategy & Insights
11.10.4 Recent Developments
11.11 Xypex Chemical Corporation
11.11.1 Overview
11.11.2 Products Offered
11.11.3 Strategy
12 Appendix (Page No. - 139)
12.1 Industry Insights
12.2 Developments
12.3 Discussion Guide
12.4 Introducing RT: Real Time Market Intelligence
12.5 Available Customizations
12.6 Related Reports
List of Tables (63 Tables)
Table 1 Quality of Overall Infrastructure, By Country
Table 2 Waterproofing Admixtures Market Size, By Type, 20132020 (Kiloton)
Table 3 Waterproofing Admixtures Market Size, By Type, 20132020 (USD Million)
Table 4 Pore Blocking Admixture Market Size, By Region, 20132020 (Kiloton)
Table 5 Pore Blocking Admixture Market Size, By Region, 20132020 (USD Million)
Table 6 Crystalline Waterproofing Admixtures Market Size, By Region, 20132020 (Kiloton)
Table 7 Crystalline Waterproofing Admixtures Market Size, By Region, 20132020 (USD Million)
Table 8 Others Waterproofing Market Size, By Region, 20132020 (Kiloton)
Table 9 Others Waterproofing Admixtures Market Size, By Region, 20132020 (USD Million)
Table 10 Waterproofing Admixtures Market Size, By Application, 20132020 (Kiloton)
Table 11 Waterproofing Admixtures Market Size, By Application, 20132020 (USD Million)
Table 12 Waterproofing Admixtures Market Size in Building & Construction, By Region, 20132020 (Kiloton)
Table 13 Waterproofing Admixtures Market Size in Building & Construction, By Region, 20132020 (USD Million)
Table 14 Waterproofing Admixtures Market Size in Public Infrastructure, By Region, 20132020 (Kiloton)
Table 15 Waterproofing Admixtures Market Size in Public Infrastructure, By Region, 20132020 (USD Million)
Table 16 Waterproofing Admixtures Market Size in Commercial Space, By Region, 20132020 (Kiloton)
Table 17 Waterproofing Admixtures Market Size in Commercial Space, By Region, 20132020 (USD Million)
Table 18 Waterproofing Admixtures Market Size, By Region, 20132020 (Kiloton)
Table 19 Waterproofing Admixtures Market Size, By Region, 20132020 (USD Million)
Table 20 Asia-Pacific: By Market Size, By Country, 20132020 (Kiloton)
Table 21 Asia-Pacific: By Market Size, By Country, 20132020 (USD Million)
Table 22 China: By Market Size, By Type, 20132020 (Kiloton)
Table 23 China: By Market Size, By Type, 20132020 (USD Million)
Table 24 India: By Market Size, By Type, 20132020 (Kiloton)
Table 25 India: By Market Size, By Type, 20132020 (USD Million)
Table 26 Japan: By Market Size, By Type, 20132020 (Kiloton)
Table 27 Japan: By Market Size, By Type, 20132020 (USD Million)
Table 28 South Korea: By Market Size, By Type, 20132020 (Kiloton)
Table 29 South Korea: By Market Size, By Type, 20132020 (USD Million)
Table 30 Middle East & Africa: By Market Size, By Country, 20132020 (Kiloton)
Table 31 Middle East & Africa: By Market Size, By Country, 20132020 (USD Million)
Table 32 Egypt: By Market Size, By Type, 20132020 (Kiloton)
Table 33 Egypt: By Market Size, By Type, 20132020 USD Million)
Table 34 Iran: By Market Size, By Type, 20132020 (Kiloton)
Table 35 Iran: By Market Size, By Type, 20132020 (USD Million)
Table 36 Saudi Arabia: By Market Size, By Type, 20132020 (Kiloton)
Table 37 Saudi Arabia: By Market Size, By Type, 20132020 (USD Million)
Table 38 U.A.E.: By Market Size, By Type, 20132020 (Kiloton)
Table 39 U.A.E.: By Market Size, By Type, 20132020 (USD Million)
Table 40 Europe: By Market Size, By Country, 20132020 (Kiloton)
Table 41 Europe: By Market Size, By Country, 20132020 (USD Million)
Table 42 Turkey: By Market Size, By Type, 20132020 (Kiloton)
Table 43 Turkey: By Market Size, By Type 20132020 (USD Million)
Table 44 Italy: By Market Size, By Type, 20132020 (Kiloton)
Table 45 Italy: By Market Size, By Type, 20132020 (USD Million)
Table 46 Poland: By Market Size, By Type, 20132020 (Kiloton)
Table 47 Poland: By Market Size, By Type, 20132020 (USD Million)
Table 48 Spain: By Market Size, By Type, 20132020 (Kiloton)
Table 49 Spain: By Market Size, By Type, 20132020 (USD Million)
Table 50 Germany: By Market Size, By Type, 20132020 (Kiloton)
Table 51 Germany: By Market Size, By Type, 20132020 (USD Million)
Table 52 France: By Market Size, By Type, 20132020 (Kiloton)
Table 53 France: By Market Size, By Type, 20132020 (USD Million)
Table 54 North America: By Market Size, By Country, 20132020 (Kiloton)
Table 55 North America: Concrete Admixtures Market Size, By Country, 20122019 (USD Million)
Table 56 U.S.: By Market Size, By Type, 20132020 (Kiloton)
Table 57 U.S.: By Market Size, By Type, 20132020 (USD Million)
Table 58 Mexico: Waterproofing Admixtures Market Size, By Type, 20132020 (Kiloton)
Table 59 Mexico: Waterproofing Admixtures Market Size, By Type, 20132020 (USD Million)
Table 60 Canada: Waterproofing Admixtures Market Size, By Type, 20132020 (Kiloton)
Table 61 Canada: Waterproofing Admixtures Market Size, By Type, 20132020 (USD Million)
Table 62 New Product Development & Launch, 20122015
Table 63 Agreements & Collaborations, 20122015
List of Figures (47 Figures)
Figure 1 Waterproofing Admixtures: Market Segmentation
Figure 2 Research Design
Figure 3 Bottom-Up Approach
Figure 4 Top-Down Approach
Figure 5 Data Triangulation
Figure 6 Assumptions of the Research Study
Figure 7 Limitations of the Research Study
Figure 8 Waterproofing Admixtures Market Snapshot, By Type (2015 vs. 2020)
Figure 9 Waterproofing Admixtures Market, 20152020
Figure 10 Waterproofing Market Share, (Volume), 2014
Figure 11 Waterproofing Admixtures Market to Grow at Higher Rate Between 2015 and 2020
Figure 12 Public Infrastructure to Grow at the Fastest Rate Among All Applications of Waterproofing Admixture
Figure 13 China Accounts for the Largest Market Share in Asia-Pacific, 2014
Figure 14 Waterproofing Admixture Market Attractiveness
Figure 15 Asia-Pacific Market Projected to Witness the Highest Growth Between 2015 and 2020 for Waterproofing Admixture
Figure 16 Waterproofing Admixtures Market, By Type
Figure 17 Overview of the Market Forces Governing the Concrete Admixtures Market
Figure 18 Overview of Waterproofing Admixtures Value Chain
Figure 19 Porters Five Forces Analysis of the Waterproofing Admixtures Market
Figure 20 Waterproofing Admixtures Market, By Type, 2015 vs. 2020 (USD Million)
Figure 21 Public Infrastructure Growth to Be the Highest in the Waterproofing Admixtures Market, By Application, 2015 vs. 2020 (USD Million)
Figure 22 Cement Market Size, 20112015 (Million Ton)
Figure 23 Regional Snapshot (2015-2020)Rapidly Growing Markets are Emerging as Strategic Locations
Figure 24 China and India Were the Major Markets for Waterproofing Admixtures in the Asia-Pacific Market (2014)
Figure 25 Spain and Germany Were the Key European Markets for Waterproofing Admixtures (2014)
Figure 26 The U.S. Was the Major Market for Waterproofing Admixtures in the North American Market (2014)
Figure 27 Companies Adopted Expansions and Mergers & Acquisition as Their Key Growth Strategy
Figure 28 Waterproofing Admixtures Market Witnessed Maximum Developments in 2014
Figure 29 Expansions: the Most Popular Growth Strategy
Figure 30 BASF SE & Pidilite Industries to Lead in Terms of Market Development Activities Between 2012 and 2015
Figure 31 Regional Revenue Mix of the Key Market Players
Figure 32 BASF SE: Company Snapshot
Figure 33 BASF: SWOT Analysis
Figure 34 SIKA AG: Company Snapshot
Figure 35 SIKA AG: SWOT Analysis
Figure 36 W.R. Grace & Co.: Company Snapshot
Figure 37 W.R Grace Co.: SWOT Analysis
Figure 38 Wacker Chemie AG.: Company Snapshot
Figure 39 Wacker Chemie AG: SWOT Analysis
Figure 40 DOW Corning Corporation: Company Snapshot
Figure 41 DOW Corning Corporation: SWOT Analysis
Figure 42 RPM International: Company Snapshot
Figure 43 Pidilite Industries: Company Snapshot
Figure 44 Evonik Industries: Company Snapshot
Figure 45 Fosroc International Ltd.: Company Snapshot
Figure 46 Mapei S.P.A.: Company Snapshot
Figure 47 Xypex Chemical Corporation: Company Snapshot
Growth opportunities and latent adjacency in Waterproofing Admixture Market