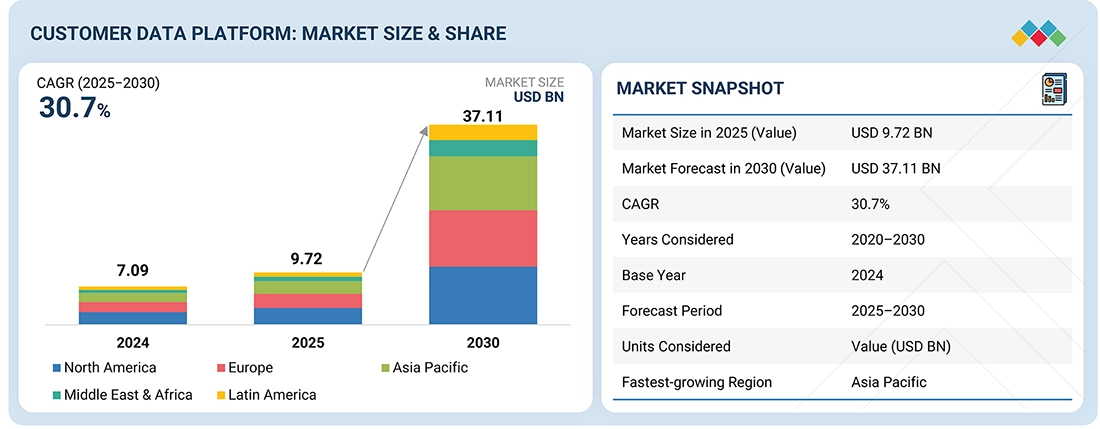
2
RESEARCH METHODOLOGY
47
5
MARKET OVERVIEW AND INDUSTRY TRENDS
Omnichannel integration and AI-driven personalization redefine CDP strategies amid regulatory and cost challenges.
67
5.2.1.1
SEAMLESS CUSTOMER EXPERIENCES THROUGH OMNICHANNEL CDP INTEGRATION
5.2.1.2
THIRD-PARTY COOKIE DEPRECATION IS ACCELERATING THE SHIFT TOWARD FIRST-PARTY DATA VIA CDPS
5.2.1.3
INTEGRATION WITH JOURNEY ORCHESTRATION TOOLS MAKING CDPS VITAL FOR INTENT-BASED ENGAGEMENT
5.2.2.1
REGULATORY COMPLIANCE COMPLEXITY DUE TO GLOBAL DATA PRIVACY LAWS
5.2.2.2
PERSISTENT INTERNAL DATA SILOS REDUCE EFFECTIVENESS OF CDP-GENERATED PROFILES
5.2.2.3
HIGH SETUP AND INTEGRATION COSTS HINDER CDP ADOPTION AMONG MID-SIZED COMPANIES
5.2.3.1
EMPOWERING CUSTOMIZATION AND AGILITY WITH COMPOSABLE CDPS
5.2.3.2
SAAS INTEGRATIONS INCREASING DEMAND FOR CDPS WITH STRONG NATIVE CONNECTORS
5.2.3.3
AI-POWERED CDPS CAN DRIVE HYPER-PERSONALIZATION
5.2.4.1
VENDOR LOCK-IN AND INTEROPERABILITY UNDERMINING ADAPTABILITY IN CDP ADOPTION
5.2.4.2
SCALING DATA HYGIENE ACROSS MILLIONS OF PROFILES TO BE PERSISTENT OPERATIONAL CHALLENGE
5.2.4.3
ACCURATELY RESOLVING IDENTITIES ACROSS DEVICES AND SESSIONS REMAINS TECHNICALLY COMPLEX
5.3
IMPACT OF 2025 US TARIFF – CUSTOMER DATA PLATFORM MARKET
5.3.3
PRICE IMPACT ANALYSIS
5.3.3.1
STRATEGIC SHIFTS AND EMERGING TRENDS
5.3.4
IMPACT ON COUNTRY/REGION
5.3.5
IMPACT ON END-USE INDUSTRIES
5.3.5.1
RETAIL AND E-COMMERCE
5.3.5.2
BANKING, FINANCIAL SERVICES, AND INSURANCE (BFSI)
5.3.5.3
HEALTHCARE AND LIFE SCIENCES
5.3.5.4
MEDIA AND ENTERTAINMENT
5.4
EVOLUTION OF CUSTOMER DATA PLATFORM
5.5
CUSTOMER DATA PLATFORM MARKET: ARCHITECTURE
5.6
SUPPLY CHAIN ANALYSIS
5.7.1
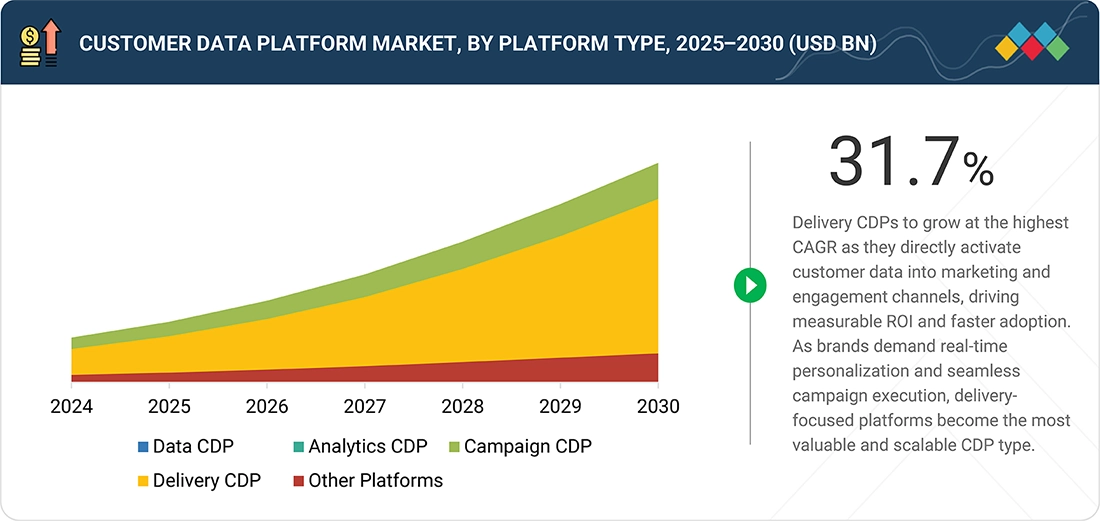
CUSTOMER DATA PLATFORM MARKET, PLATFORM TYPE
5.8.1.3
BIG DATA AND ANALYTICS
5.8.2
COMPLEMENTARY TECHNOLOGIES
5.8.2.1
DATA QUALITY AND ENRICHMENT
5.8.3
ADJACENT TECHNOLOGIES
5.9.1.1
ORANGE PARTNERED WITH TEALIUM TO ADOPT DATA-DRIVEN APPROACH TOWARD CUSTOMER INSIGHT AND ENGAGEMENT
5.9.1.2
LEADSPACE’S B2B CDP HELPED ONELOGIN IMPROVE EMAIL OPEN RATES AND MAKE SALES OUTREACH FASTER
5.9.2.1
TERADATA VANTAGE PLATFORM UNIFIED AND SIMPLIFIED ANALYTICS ECOSYSTEM OF SWEDBANK TO UNDERSTAND CONSUMER BEHAVIOR
5.9.3.1
ALLERGAN PLC RELAUNCHED ITS PERSONALIZED CUSTOMER LOYALTY PROGRAM, ALLE, BY PARTNERING WITH SEGMENT, TWILIO, AND SNOWFLAKE
5.9.4
RETAIL & E-COMMERCE
5.9.4.1
BOUNTY IMPROVED AUDIENCE SEGMENTATION AND CUSTOMER ENGAGEMENT BY IMPLEMENTING BLUEVENN CDP FROM UPLAND SOFTWARE
5.9.5.1
LEADSPACE CDP HELPED SOVOS RE-ARRANGE ITS DATABASE WITH REAL-TIME DATA ENRICHMENT AND BUILD HIGHLY PREDICTIVE MODELS
5.9.5.2
DYNAMIC SIGNAL USED LEADSPACE B2B CDP TO ENABLE HIGHLY PERSONALIZED, TARGETED ACCOUNT-BASED MARKETING CAMPAIGNS
5.10
PORTER’S FIVE FORCES ANALYSIS
5.10.1
THREAT OF NEW ENTRANTS
5.10.2
THREAT OF SUBSTITUTES
5.10.3
BARGAINING POWER OF SUPPLIERS
5.10.4
BARGAINING POWER OF BUYERS
5.10.5
INTENSITY OF COMPETITIVE RIVALRY
5.11
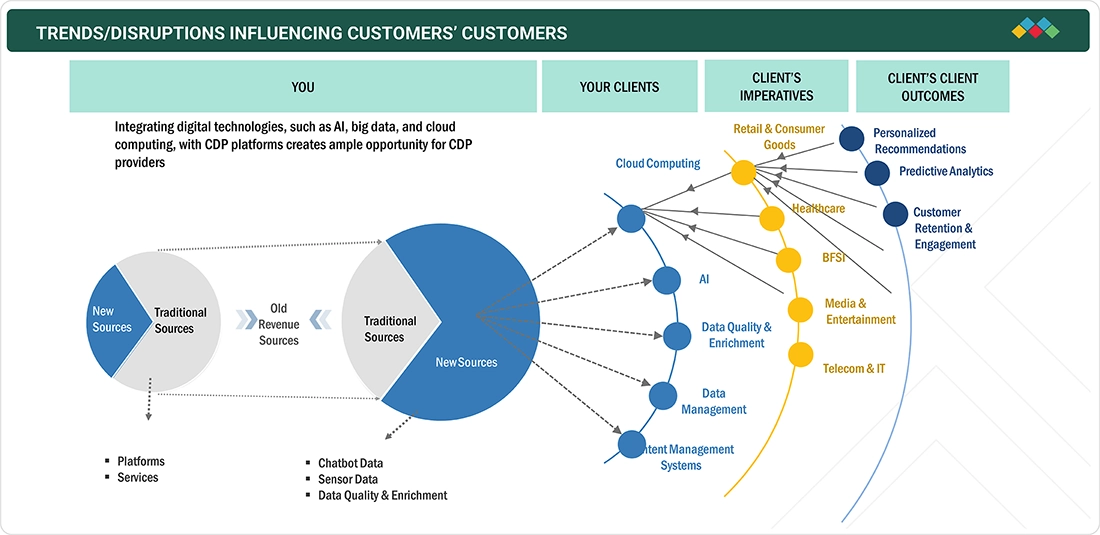
TRENDS/DISRUPTIONS IMPACTING CUSTOMERS’ BUSINESSES
5.12
REGULATORY LANDSCAPE
5.12.1
REGULATORY BODIES, GOVERNMENT AGENCIES, AND OTHER ORGANIZATIONS
5.12.2.4
MIDDLE EAST & AFRICA
5.13.2
PATENTS FILED, BY DOCUMENT TYPE
5.13.3
INNOVATION AND PATENT APPLICATIONS
5.14
INVESTMENT AND FUNDING SCENARIO
5.15.1
AVERAGE SELLING PRICE OF OFFERING, BY KEY PLAYER, 2025
5.15.2
INDICATIVE PRICING ANALYSIS, BY APPLICATION, 2025
5.15.3
KEY CONFERENCES AND EVENTS (2025–2026)
5.16
KEY STAKEHOLDERS AND BUYING CRITERIA
5.16.1
KEY STAKEHOLDERS IN BUYING PROCESS
6
CUSTOMER DATA PLATFORM MARKET, BY OFFERING
Market Size & Growth Rate Forecast Analysis to 2030 in USD Million | 26 Data Tables
114
6.1.1
OFFERING: CUSTOMER DATA PLATFORM MARKET DRIVERS
6.2.1.1
NEED FOR EASIER INTEGRATION WITH EXISTING SYSTEMS AND REAL-TIME DATA PROCESSING CAPABILITIES TO FUEL DEMAND FOR DATA
6.2.2.1
ANALYTICS CDPS TO HELP AGGREGATE, ANALYZE, AND DERIVE ACTIONABLE INSIGHTS FROM VAST CUSTOMER DATA
6.2.3.1
CAMPAIGN CDPS TO OFFER ADVANCED SEGMENTATION CAPABILITIES AND REAL-TIME DATA
6.2.4.1
INCREASING DEMAND TO MANAGE AND UTILIZE CUSTOMER DATA TO PERSONALIZE EXPERIENCES AND IMPROVE CUSTOMER ENGAGEMENT ACROSS VARIOUS CHANNELS TO DRIVE MARKET
6.3.1
PROFESSIONAL SERVICES
6.3.1.1
CDP PROFESSIONAL SERVICES TO HELP CLIENTS IN DECISION-MAKING
6.3.1.2
CONSULTING & TRAINING
6.3.1.3
SYSTEM INTEGRATION & IMPLEMENTATION
6.3.1.4
SUPPORT & MAINTENANCE
6.3.2.1
MANAGED SERVICES TO HELP ORGANIZATIONS STREAMLINE CDP OPERATIONS, IMPROVE DATA QUALITY AND SECURITY, AND ENHANCE CUSTOMER ENGAGEMENT STRATEGIES
7
CUSTOMER DATA PLATFORM MARKET, BY DEPLOYMENT MODE
Market Size & Growth Rate Forecast Analysis to 2030 in USD Million | 6 Data Tables
131
7.1.1
DEPLOYMENT MODE: CUSTOMER DATA PLATFORM MARKET DRIVERS
7.2.1
NEED FOR FLEXIBILITY AND DATA SECURITY & PRIVACY ISSUES TO FUEL DEMAND FOR ON-PREMISES CDPS
7.3.1
COST-EFFECTIVENESS, SCALABILITY, SPEED, 24X7 SERVICE, AND ENHANCED IT SECURITY TO BOOST ADOPTION OF CLOUD-BASED CDPS
8
CUSTOMER DATA PLATFORM MARKET, BY DATA TYPE
Market Size & Growth Rate Forecast Analysis to 2030 in USD Million | 10 Data Tables
136
8.1.1
DATA TYPE: CUSTOMER DATA PLATFORM MARKET DRIVERS
8.2.1
FIRST-PARTY DATA EMERGING AS CORNERSTONE OF CUSTOMER INTELLIGENCE STRATEGIES, OFFERING RELIABLE, PRIVACY-COMPLIANT INSIGHTS COLLECTED DIRECTLY FROM USER INTERACTIONS
8.3.1
SECOND-PARTY DATA OFFERS EXTENDED CUSTOMER INSIGHTS THROUGH TRUSTED PARTNERSHIPS, WITH CDPS ENABLING SECURE INTEGRATION AND ACTIVATION ACROSS MARKETING ECOSYSTEMS
8.4.1
THIRD-PARTY DATA FACING DECLINING RELEVANCE DUE TO PRIVACY CONCERNS, WITH CDPS HELPING BUSINESSES PIVOT TOWARD MORE COMPLIANT AND ACCURATE DATA STRATEGIES
8.5.1
ZERO-PARTY DATA EMPOWERS BRANDS WITH EXPLICIT, CONSENTED CUSTOMER INSIGHTS, WITH CDPS ENABLING SECURE CAPTURE AND PERSONALIZED ENGAGEMENT AT SCALE
9
CUSTOMER DATA PLATFORM MARKET, BY DATA CHANNEL
Market Size & Growth Rate Forecast Analysis to 2030 in USD Million | 10 Data Tables
143
9.1.1
DATA CHANNEL: CUSTOMER DATA PLATFORM MARKET DRIVERS
9.2.1
RISING FOCUS ON PERSONALIZED MARKETING STRATEGIES VIA EMAILS TO TAILOR COMMUNICATIONS AND ENHANCE CUSTOMER ENGAGEMENT
9.3.1
GROWING EMPHASIS ON SOCIAL LISTENING AND SENTIMENT ANALYSIS, AND INTEGRATION OF AI AND ML TECHNOLOGIES TO DRIVE MARKET
9.4
SMS & MOBILE MESSAGING
9.4.1
INCREASING RELIANCE ON MOBILE DEVICES, GROWING POPULARITY OF SMS, AND ADOPTION OF AI AND ML TECHNOLOGIES TO PROPEL MARKET
9.5.1
RISING ECOMMERCE AND DIGITAL INTERACTIONS, AND NEED TO AGGREGATE AND ANALYZE WEB DATA TO SPUR MARKET GROWTH
10
CUSTOMER DATA PLATFORM MARKET, BY APPLICATION
Market Size & Growth Rate Forecast Analysis to 2030 in USD Million | 24 Data Tables
150
10.1.1
APPLICATION: CUSTOMER DATA PLATFORM MARKET DRIVERS
10.2
PERSONALIZED RECOMMENDATIONS
10.2.1
RETAILERS TO LEVERAGE IOT AND DEPLOY SENSORS AND BEACONS TO DRAW CUSTOMER DATA INTO THEIR CDPS
10.3
PREDICTIVE ANALYTICS & MODELING
10.3.1
PREDICTING CUSTOMER BEHAVIOR USING ADVANCED ANALYTICS AND MODELING
10.4
CUSTOMER RETENTION & JOURNEY ORCHESTRATION
10.4.1
ORCHESTRATING SEAMLESS CUSTOMER JOURNEYS TO DRIVE RETENTION AND LOYALTY
10.5
PROFILE UNIFICATION & IDENTITY RESOLUTION
10.5.1
UNIFYING CUSTOMER PROFILES AND RESOLVING IDENTITIES ACROSS ALL TOUCHPOINTS
10.6
AUDIENCE SEGMENTATION & BEHAVIORAL TARGETING
10.6.1
SEGMENTING AUDIENCES AND TARGETING BEHAVIORS IN REAL-TIME FOR PRECISION MARKETING
10.7
DATA ACTIVATION & REAL-TIME EXECUTION
10.7.1
ACTIVATING DATA AND EXECUTING CAMPAIGNS INSTANTLY ACROSS CHANNELS
10.8
RISK & COMPLIANCE MANAGEMENT
10.8.1
CDPS TO HELP PROVIDE BETTER ROI IN FINANCIAL SERVICES AND SAFEGUARD HUGE AMOUNTS OF DATA GENERATED WHILE ANALYZING CUSTOMER DATA
10.9
OMNICHANNEL CAMPAIGN MANAGEMENT
10.9.1
MANAGING OMNICHANNEL CAMPAIGNS WITH CONSISTENT AND CONTEXTUAL MESSAGING
10.10
CHURN PREDICTION & PROPENSITY MODELING
10.10.1
PREDICTING CHURN AND MODELING PROPENSITY TO IMPROVE CUSTOMER RETENTION
10.12
CONTACT CENTERS & CRM SYSTEMS
10.12.1
LEVERAGING CONTACT CENTER AND CRM DATA FOR UNIFIED, INSIGHT-DRIVEN CUSTOMER ENGAGEMENT
11
CUSTOMER DATA PLATFORM MARKET, BY VERTICAL
Market Size & Growth Rate Forecast Analysis to 2030 in USD Million | 24 Data Tables
166
11.1.1
VERTICAL: CUSTOMER DATA PLATFORM MARKET DRIVERS
11.2.1.1
DELIVERING PERSONALIZED, OMNICHANNEL BANKING EXPERIENCES THROUGH UNIFIED CUSTOMER INTELLIGENCE
11.2.2
FINANCIAL SERVICES
11.2.2.1
DRIVING TAILORED FINANCIAL ADVICE AND CLIENT ENGAGEMENT WITH REAL-TIME DATA INTEGRATION
11.2.3.1
ENHANCING POLICYHOLDER EXPERIENCE AND RISK MANAGEMENT THROUGH CENTRALIZED DATA INSIGHTS
11.3.1
NEED FOR HIGH-QUALITY AND PROPERLY MANAGED DATA FOR DECISION-MAKING TO BOOST DEMAND FOR CDPS
11.4
MEDIA & ENTERTAINMENT
11.4.1
NEED TO DRIVE DIGITAL TRANSFORMATION, REDUCE OPERATING COSTS, AND GENERATE REVENUE FROM COMPETITIVE AND UNCERTAIN MARKETS TO DRIVE MARKET
11.5
TRAVEL & HOSPITALITY
11.5.1
CDP TO HELP ENGAGE CUSTOMERS WITH PERSONALIZED MESSAGES AND OFFER TAILOR-MADE SOLUTIONS FOR USERS’ PREFERENCES
11.6.1
ENHANCING STUDENT ENGAGEMENT THROUGH UNIFIED DATA AND PERSONALIZED LEARNING PATHS
11.7.1
REDUCING CHURN AND PERSONALIZING PLANS THROUGH REAL-TIME CUSTOMER INSIGHTS
11.8.1
ENABLING D2C GROWTH AND POST-SALES SERVICE WITH CENTRALIZED CUSTOMER INTELLIGENCE
11.9
TECHNOLOGY & SOFTWARE
11.9.1
DRIVING PRODUCT-LED GROWTH WITH REAL-TIME USER BEHAVIOR AND PERSONALIZATION
11.10
CONSTRUCTION & REAL ESTATE
11.10.1
STREAMLINING LEAD MANAGEMENT AND BUYER JOURNEYS WITH DATA-DRIVEN ENGAGEMENT
11.11
HEALTHCARE & LIFE SCIENCES
11.11.1
CDP TOOLS TO ENABLE HEALTHCARE ANALYSTS AND DATA SCIENTISTS TO EXTRACT INFORMATION FROM VARIOUS DATA SOURCES
12
CUSTOMER DATA PLATFORM MARKET, BY REGION
Comprehensive coverage of 7 Regions with country-level deep-dive of 20 Countries | 268 Data Tables.
183
12.2.1
NORTH AMERICA: CUSTOMER DATA PLATFORM MARKET DRIVERS
12.2.2
NORTH AMERICA: MACROECONOMIC OUTLOOK
12.2.3.1
US ENTERPRISES LEADING CDP ADOPTION BY INTEGRATING AI-DRIVEN INSIGHTS AND PRIORITIZING CUSTOMER-CENTRIC PERSONALIZATION
12.2.4.1
RISING KNOWLEDGE OF BENEFITS OF CLOUD TO FUEL DEMAND FOR CDP
12.3.1
EUROPE: CUSTOMER DATA PLATFORM MARKET DRIVERS
12.3.2
EUROPE: MACROECONOMIC OUTLOOK
12.3.3.1
UK ORGANIZATIONS LEVERAGING CDPS TO UNIFY DATA, ENHANCE PERSONALIZATION, AND ENSURE REGULATORY COMPLIANCE
12.3.4.1
PRESENCE OF MAJOR VENDORS AND RISING USE OF ADVANCED ANALYTICS TOOLS FOR STRATEGIC DECISION-MAKING, DIGITAL MOBILITY TO ACCELERATE MARKET GROWTH
12.3.5.1
DIGITAL TRANSFORMATION, GROWTH OF INDUSTRIAL SECTOR, AND FAVORABLE INVESTMENT CLIMATE TO BOOST DEMAND FOR CDP
12.3.6.1
ITALIAN ENTERPRISES EMBRACING CDPS TO UNIFY DATA, IMPROVE PERSONALIZATION, AND MEET EVOLVING REGULATORY STANDARDS
12.3.7.1
SPANISH COMPANIES LEVERAGING CDPS TO UNIFY CUSTOMER DATA, IMPROVE PERSONALIZATION, AND MAINTAIN REGULATORY COMPLIANCE
12.4.1
ASIA PACIFIC: CUSTOMER DATA PLATFORM MARKET DRIVERS
12.4.2
ASIA PACIFIC: MACROECONOMIC OUTLOOK
12.4.3.1
ORGANIZATIONS TO LEVERAGE CDP TO DETECT FINANCIAL FRAUD, RECOMMEND PRODUCTS TO CONSUMERS, AND STREAMLINE INDUSTRIAL OPERATIONS
12.4.4.1
RISING ADOPTION OF ADVANCED TECHNOLOGIES, GOVERNMENT FUNDING, AND INCREASED R&D INVESTMENTS TO PROPEL MARKET
12.4.5.1
NEED TO INCREASE PROFITABILITY AND GROW CUSTOMER ENGAGEMENT TO FUEL DEMAND FOR CDPS
12.4.6.1
FOCUS ON DELIVERING TAILORED EXPERIENCES, DATA PRIVACY, AND COMPLIANCE WITH REGULATIONS TO SPUR MARKET GROWTH
12.4.7
AUSTRALIA & NEW ZEALAND
12.4.7.1
RISING AWARENESS OF DATA PRIVACY AND SECURITY CONCERNS AND INCREASING DIGITALIZATION OF BUSINESSES TO DRIVE MARKET
12.4.8
REST OF ASIA PACIFIC
12.5
MIDDLE EAST & AFRICA
12.5.1
MIDDLE EAST & AFRICA: CUSTOMER DATA PLATFORM MARKET DRIVERS
12.5.2
MIDDLE EAST & AFRICA: MACROECONOMIC OUTLOOK
12.5.3
SAUDI ARABIA (KSA)
12.5.3.1
SAUDI ARABIA’S DIGITAL TRANSFORMATION AND REGULATORY REFORMS ACCELERATING ADOPTION OF CUSTOMER DATA PLATFORMS
12.5.4.1
UAE’S TECH-FORWARD POLICIES AND DATA PRIVACY REGULATIONS FUELING ADOPTION OF CUSTOMER DATA PLATFORMS ACROSS KEY SECTORS
12.5.5.1
TURKEY’S DIGITAL GROWTH, TECH-SAVVY POPULATION, AND CUSTOMER EXPERIENCE FOCUS ACCELERATING CDP ADOPTION ACROSS INDUSTRIES
12.5.6.1
SOUTH AFRICA’S EXPANDING DIGITAL LANDSCAPE AND CUSTOMER-CENTRIC BUSINESS PRIORITIES DRIVING STRONG ADOPTION OF CUSTOMER DATA PLATFORMS
12.5.7
REST OF MIDDLE EAST
12.6.1
LATIN AMERICA: CUSTOMER DATA PLATFORM MARKET DRIVERS
12.6.2
LATIN AMERICA: MACROECONOMIC OUTLOOK
12.6.3.1
EVOLUTION OF ONLINE ADVERTISING, GROWTH OF AUTOMATED MARKETING, AND NEED FOR QUICK AND REAL-TIME ACCESS TO DATA TO PROPEL MARKET
12.6.4.1
GROWING ADOPTION OF ADVANCED TECHNOLOGIES AND CLOUD TO ACCELERATE DEMAND FOR CDPS
12.6.5.1
PROLIFERATION OF E-COMMERCE AND DIGITAL MARKETING AND NEED FOR ENHANCING CUSTOMER LOYALTY TO BOOST DEMAND FOR CDPS
12.6.6
REST OF LATIN AMERICA
13
COMPETITIVE LANDSCAPE
Discover top strategies and market leaders shaping the customer data platform landscape.
292
13.2
KEY PLAYER STRATEGIES/RIGHT TO WIN, 2022–2025
13.3
REVENUE ANALYSIS, 2020–2024
13.4
MARKET SHARE ANALYSIS, 2024
13.4.1
MARKET RANKING ANALYSIS
13.5
PRODUCT COMPARATIVE ANALYSIS
13.5.1
PRODUCT COMPARATIVE ANALYSIS OF CUSTOMER DATA PLATFORM
13.5.1.1
SALESFORCE DATA CLOUD (SALESFORCE)
13.5.1.2
TEALIUM AUDIENCESTREAM CDP (TEALIUM)
13.5.1.3
ORACLE UNITY CUSTOMER DATA PLATFORM (ORACLE)
13.5.1.4
ADOBE REAL-TIME CDP (ADOBE)
13.5.1.5
TREASURE DATA CDP (TREASURE DATA)
13.6
COMPANY VALUATION AND FINANCIAL METRICS
13.7
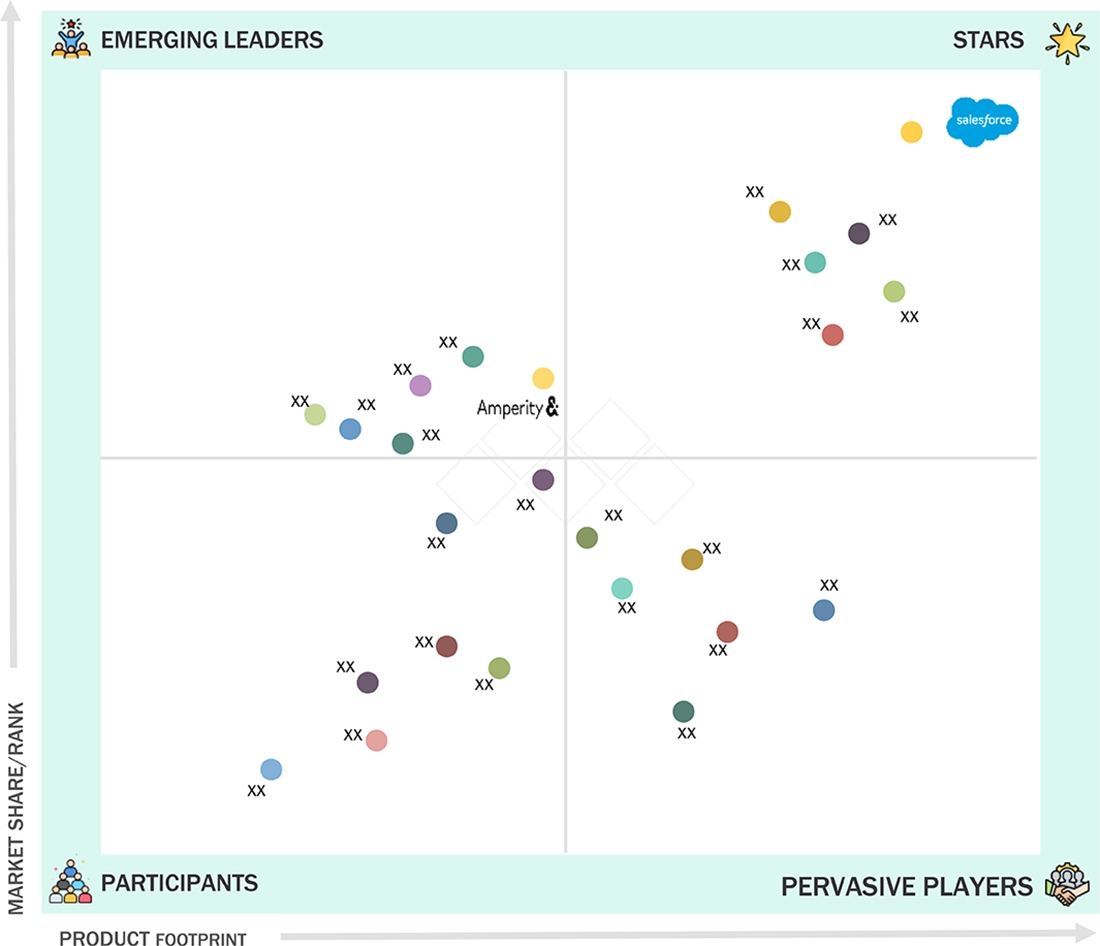
COMPANY EVALUATION MATRIX: KEY PLAYERS, 2024
13.7.5
COMPANY FOOTPRINT: KEY PLAYERS, 2024
13.7.5.1
COMPANY FOOTPRINT
13.7.5.2
REGIONAL FOOTPRINT
13.7.5.3
PLATFORM TYPE FOOTPRINT
13.7.5.4
DATA TYPE FOOTPRINT
13.7.5.5
APPLICATION FOOTPRINT
13.8
COMPANY EVALUATION MATRIX: STARTUPS/SMES, 2024
13.8.1
PROGRESSIVE COMPANIES
13.8.2
RESPONSIVE COMPANIES
13.8.5
COMPETITIVE BENCHMARKING: STARTUPS/SMES, 2024
13.8.5.1
DETAILED LIST OF KEY STARTUPS/SMES
13.8.5.2
COMPETITIVE BENCHMARKING OF KEY STARTUPS/SMES
13.9
COMPETITIVE SCENARIO AND TRENDS
13.9.1
PRODUCT LAUNCHES AND ENHANCEMENTS
14
COMPANY PROFILES
In-depth Company Profiles of Leading Market Players with detailed Business Overview, Product and Service Portfolio, Recent Developments, and Unique Analyst Perspective (MnM View)
315
14.2.1.1
BUSINESS OVERVIEW
14.2.1.2
PRODUCTS/SOLUTIONS/SERVICES OFFERED
14.2.1.3
RECENT DEVELOPMENTS
14.2.20
CELEBRUS TECHNOLOGIES
15
ADJACENT AND RELATED MARKETS
381
15.2
CUSTOMER EXPERIENCE MANAGEMENT MARKET - GLOBAL FORECAST TO 2028
15.2.2.1
CUSTOMER EXPERIENCE MANAGEMENT MARKET, BY OFFERING
15.2.2.2
CUSTOMER EXPERIENCE MANAGEMENT MARKET, BY DEPLOYMENT TYPE
15.2.2.3
CUSTOMER EXPERIENCE MANAGEMENT MARKET, BY ORGANIZATION SIZE
15.2.2.4
CUSTOMER EXPERIENCE MANAGEMENT MARKET, BY VERTICAL
15.2.2.5
CUSTOMER EXPERIENCE MANAGEMENT MARKET, BY REGION
15.3
CUSTOMER INTELLIGENCE PLATFORM MARKET - GLOBAL FORECAST TO 2027
15.3.2.1
CUSTOMER INTELLIGENCE PLATFORM MARKET, BY COMPONENT
15.3.2.2
CUSTOMER INTELLIGENCE PLATFORM MARKET, BY DEPLOYMENT MODE
15.3.2.3
CUSTOMER INTELLIGENCE PLATFORM MARKET, BY ORGANIZATION SIZE
15.3.2.4
CUSTOMER INTELLIGENCE PLATFORM MARKET, BY DATA CHANNEL
15.3.2.5
CUSTOMER INTELLIGENCE PLATFORM MARKET, BY APPLICATION
15.3.2.6
CUSTOMER INTELLIGENCE PLATFORM MARKET, BY VERTICAL
15.3.2.7
CUSTOMER INTELLIGENCE PLATFORM MARKET, BY REGION
16.2
KNOWLEDGESTORE: MARKETSANDMARKETS’ SUBSCRIPTION PORTAL
16.3
CUSTOMIZATION OPTIONS
TABLE 1
UNITED STATES DOLLAR EXCHANGE RATE, 2020–2024
TABLE 3
GLOBAL CUSTOMER DATA PLATFORM MARKET SIZE AND GROWTH RATE, 2020–2024 (USD MILLION, Y-O-Y %)
TABLE 4
GLOBAL CUSTOMER DATA PLATFORM MARKET SIZE AND GROWTH RATE, 2025–2030 (USD MILLION, Y-O-Y %)
TABLE 5
US-ADJUSTED RECIPROCAL TARIFF RATES
TABLE 6
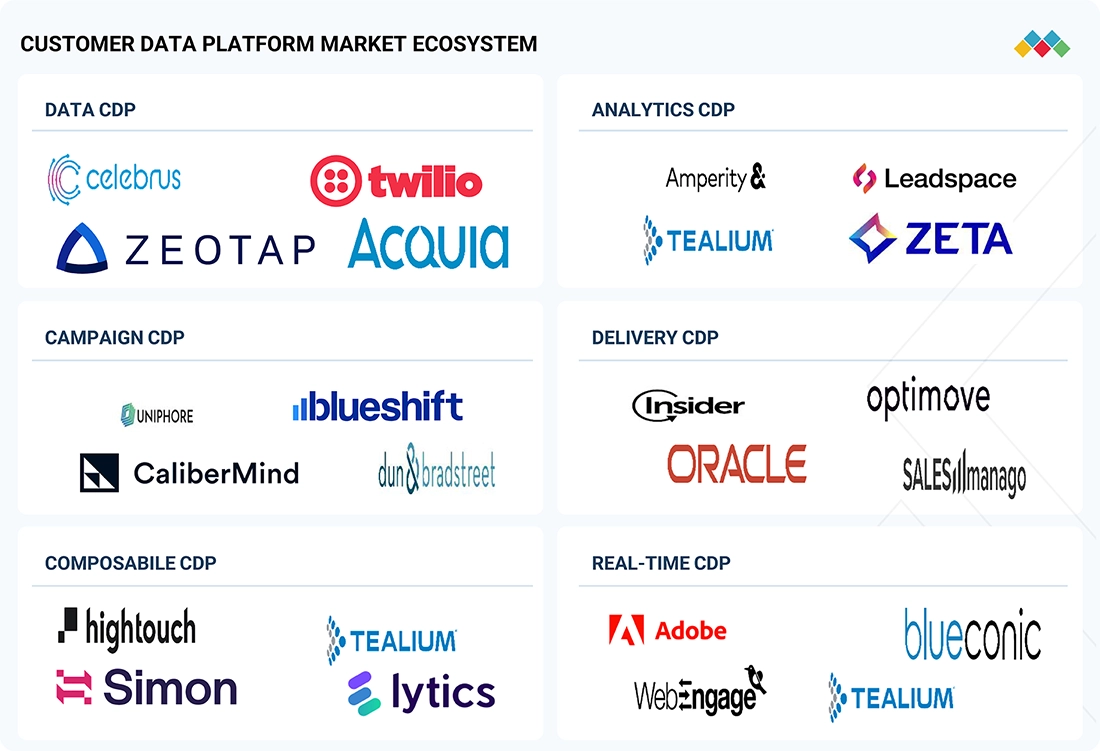
CUSTOMER DATA PLATFORM MARKET: ECOSYSTEM
TABLE 7
IMPACT OF PORTER’S FIVE FORCES ON CUSTOMER DATA PLATFORM MARKET
TABLE 8
NORTH AMERICA: LIST OF REGULATORY BODIES, GOVERNMENT AGENCIES, AND OTHER ORGANIZATIONS
TABLE 9
EUROPE: LIST OF REGULATORY BODIES, GOVERNMENT AGENCIES, AND OTHER ORGANIZATIONS
TABLE 10
ASIA PACIFIC: LIST OF REGULATORY BODIES, GOVERNMENT AGENCIES, AND OTHER ORGANIZATIONS
TABLE 11
MIDDLE EAST & AFRICA: LIST OF REGULATORY BODIES, GOVERNMENT AGENCIES, AND OTHER ORGANIZATIONS
TABLE 12
LATIN AMERICA: LIST OF REGULATORY BODIES, GOVERNMENT AGENCIES, AND OTHER ORGANIZATIONS
TABLE 13
PATENTS FILED, 2016–2025
TABLE 14
LIST OF TOP PATENTS IN CUSTOMER DATA PLATFORM MARKET, 2024-2025
TABLE 15
PRICING DATA OF CUSTOMER DATA PLATFORM MARKET, BY OFFERING
TABLE 16
PRICING DATA OF CUSTOMER DATA PLATFORM, BY APPLICATION
TABLE 17
CUSTOMER DATA PLATFORM MARKET: DETAILED LIST OF CONFERENCES AND EVENTS
TABLE 18
INFLUENCE OF STAKEHOLDERS ON BUYING PROCESS FOR TOP THREE VERTICALS
TABLE 19
KEY BUYING CRITERIA FOR TOP THREE VERTICALS
TABLE 20
CUSTOMER DATA PLATFORM MARKET, BY OFFERING, 2020–2024 (USD MILLION)
TABLE 21
CUSTOMER DATA PLATFORM MARKET, BY OFFERING, 2025–2030 (USD MILLION)
TABLE 22
CUSTOMER DATA PLATFORM MARKET, BY PLATFORM, 2020–2024 (USD MILLION)
TABLE 23
CUSTOMER DATA PLATFORM MARKET, BY PLATFORM, 2025–2030 (USD MILLION)
TABLE 24
DATA CDP: CUSTOMER DATA PLATFORM MARKET, BY REGION, 2020–2024 (USD MILLION)
TABLE 25
DATA CDP: CUSTOMER DATA PLATFORM MARKET, BY REGION, 2025–2030 (USD MILLION)
TABLE 26
ANALYTICS CDP: CUSTOMER DATA PLATFORM MARKET, BY REGION, 2020–2024 (USD MILLION)
TABLE 27
ANALYTICS CDP: CUSTOMER DATA PLATFORM MARKET, BY REGION, 2025–2030 (USD MILLION)
TABLE 28
CAMPAIGN CDP: CUSTOMER DATA PLATFORM MARKET, BY REGION, 2020–2024 (USD MILLION)
TABLE 29
CAMPAIGN CDP: CUSTOMER DATA PLATFORM MARKET, BY REGION, 2025–2030 (USD MILLION)
TABLE 30
DELIVERY CDP: CUSTOMER DATA PLATFORM MARKET, BY REGION, 2020–2024 (USD MILLION)
TABLE 31
DELIVERY CDP: CUSTOMER DATA PLATFORM MARKET, BY REGION, 2025–2030 (USD MILLION)
TABLE 32
OTHER PLATFORMS: CUSTOMER DATA PLATFORM MARKET, BY REGION, 2020–2024 (USD MILLION)
TABLE 33
OTHER PLATFORMS: CUSTOMER DATA PLATFORM MARKET, BY REGION, 2025–2030 (USD MILLION)
TABLE 34
CUSTOMER DATA PLATFORM MARKET, BY SERVICE, 2020–2024 (USD MILLION)
TABLE 35
CUSTOMER DATA PLATFORM MARKET, BY SERVICE, 2025–2030 (USD MILLION)
TABLE 36
CUSTOMER DATA PLATFORM MARKET, BY PROFESSIONAL SERVICE, 2020–2024 (USD MILLION)
TABLE 37
CUSTOMER DATA PLATFORM MARKET, BY PROFESSIONAL SERVICE, 2025–2030 (USD MILLION)
TABLE 38
CONSULTING & TRAINING: CUSTOMER DATA PLATFORM MARKET, BY REGION, 2020–2024 (USD MILLION)
TABLE 39
CONSULTING & TRAINING: CUSTOMER DATA PLATFORM MARKET, BY REGION, 2025–2030 (USD MILLION)
TABLE 40
SYSTEM INTEGRATION & IMPLEMENTATION: CUSTOMER DATA PLATFORM MARKET, BY REGION, 2020–2024 (USD MILLION)
TABLE 41
SYSTEM INTEGRATION & IMPLEMENTATION: CUSTOMER DATA PLATFORM MARKET, BY REGION, 2025–2030 (USD MILLION)
TABLE 42
SUPPORT & MAINTENANCE: CUSTOMER DATA PLATFORM MARKET, BY REGION, 2020–2024 (USD MILLION)
TABLE 43
SUPPORT & MAINTENANCE: CUSTOMER DATA PLATFORM MARKET, BY REGION, 2025–2030 (USD MILLION)
TABLE 44
MANAGED SERVICES: CUSTOMER DATA PLATFORM MARKET, BY REGION, 2020–2024 (USD MILLION)
TABLE 45
MANAGED SERVICES: CUSTOMER DATA PLATFORM MARKET, BY REGION, 2025–2030 (USD MILLION)
TABLE 46
CUSTOMER DATA PLATFORM MARKET, BY DEPLOYMENT MODE, 2020–2024 (USD MILLION)
TABLE 47
CUSTOMER DATA PLATFORM MARKET, BY DEPLOYMENT MODE, 2025–2030 (USD MILLION)
TABLE 48
ON-PREMISES: CUSTOMER DATA PLATFORM MARKET, BY REGION, 2020–2024 (USD MILLION)
TABLE 49
ON-PREMISES: CUSTOMER DATA PLATFORM MARKET, BY REGION, 2025–2030 (USD MILLION)
TABLE 50
CLOUD: CUSTOMER DATA PLATFORM MARKET, BY REGION, 2020–2024 (USD MILLION)
TABLE 51
CLOUD: CUSTOMER DATA PLATFORM MARKET, BY REGION, 2025–2030 (USD MILLION)
TABLE 52
CUSTOMER DATA PLATFORM MARKET, BY DATA TYPE, 2020–2024 (USD MILLION)
TABLE 53
CUSTOMER DATA PLATFORM MARKET, BY DATA TYPE, 2025–2030 (USD MILLION)
TABLE 54
FIRST-PARTY DATA: CUSTOMER DATA PLATFORM MARKET, BY REGION, 2020–2024 (USD MILLION)
TABLE 55
FIRST-PARTY DATA: CUSTOMER DATA PLATFORM MARKET, BY REGION, 2025–2030 (USD MILLION)
TABLE 56
SECOND-PARTY DATA: CUSTOMER DATA PLATFORM MARKET, BY REGION, 2020–2024 (USD MILLION)
TABLE 57
SECOND-PARTY DATA: CUSTOMER DATA PLATFORM MARKET, BY REGION, 2025–2030 (USD MILLION)
TABLE 58
THIRD-PARTY DATA: CUSTOMER DATA PLATFORM MARKET, BY REGION, 2020–2024 (USD MILLION)
TABLE 59
THIRD-PARTY DATA: CUSTOMER DATA PLATFORM MARKET, BY REGION, 2025–2030 (USD MILLION)
TABLE 60
ZERO-PARTY DATA: CUSTOMER DATA PLATFORM MARKET, BY REGION, 2020–2024 (USD MILLION)
TABLE 61
ZERO-PARTY DATA: CUSTOMER DATA PLATFORM MARKET, BY REGION, 2025–2030 (USD MILLION)
TABLE 62
CUSTOMER DATA PLATFORM MARKET, BY DATA CHANNEL, 2020–2024 (USD MILLION)
TABLE 63
CUSTOMER DATA PLATFORM MARKET, BY DATA CHANNEL, 2025–2030 (USD MILLION)
TABLE 64
EMAIL: CUSTOMER DATA PLATFORM MARKET, BY REGION, 2020–2024 (USD MILLION)
TABLE 65
EMAIL: CUSTOMER DATA PLATFORM MARKET, BY REGION, 2025–2030 (USD MILLION)
TABLE 66
SOCIAL MEDIA: CUSTOMER DATA PLATFORM MARKET, BY REGION, 2020–2024 (USD MILLION)
TABLE 67
SOCIAL MEDIA: CUSTOMER DATA PLATFORM MARKET, BY REGION, 2025–2030 (USD MILLION)
TABLE 68
SMS & MOBILE MESSAGING: CUSTOMER DATA PLATFORM MARKET, BY REGION, 2020–2024 (USD MILLION)
TABLE 69
SMS & MOBILE MESSAGING: CUSTOMER DATA PLATFORM MARKET, BY REGION, 2025–2030 (USD MILLION)
TABLE 70
WEB: CUSTOMER DATA PLATFORM MARKET, BY REGION, 2020–2024 (USD MILLION)
TABLE 71
WEB: CUSTOMER DATA PLATFORM MARKET, BY REGION, 2025–2030 (USD MILLION)
TABLE 72
CUSTOMER DATA PLATFORM MARKET, BY APPLICATION, 2020–2024 (USD MILLION)
TABLE 73
CUSTOMER DATA PLATFORM MARKET, BY APPLICATION, 2025–2030 (USD MILLION)
TABLE 74
PERSONALIZED RECOMMENDATIONS: CUSTOMER DATA PLATFORM MARKET, BY REGION, 2020–2024 (USD MILLION)
TABLE 75
PERSONALIZED RECOMMENDATIONS: CUSTOMER DATA PLATFORM MARKET, BY REGION, 2025–2030 (USD MILLION)
TABLE 76
PREDICTIVE ANALYTICS & MODELING: CUSTOMER DATA PLATFORM MARKET, BY REGION, 2020–2024 (USD MILLION)
TABLE 77
PREDICTIVE ANALYTICS & MODELING: CUSTOMER DATA PLATFORM MARKET, BY REGION, 2025–2030 (USD MILLION)
TABLE 78
CUSTOMER RETENTION & JOURNEY ORCHESTRATION: CUSTOMER DATA PLATFORM MARKET, BY REGION, 2020–2024 (USD MILLION)
TABLE 79
CUSTOMER RETENTION & JOURNEY ORCHESTRATION: CUSTOMER DATA PLATFORM MARKET, BY REGION, 2025–2030 (USD MILLION)
TABLE 80
PROFILE UNIFICATION & IDENTITY RESOLUTION: CUSTOMER DATA PLATFORM MARKET, BY REGION, 2020–2024 (USD MILLION)
TABLE 81
PROFILE UNIFICATION & IDENTITY RESOLUTION: CUSTOMER DATA PLATFORM MARKET, BY REGION, 2025–2030 (USD MILLION)
TABLE 82
AUDIENCE SEGMENTATION & BEHAVIORAL TARGETING: CUSTOMER DATA PLATFORM MARKET, BY REGION, 2020–2024 (USD MILLION)
TABLE 83
AUDIENCE SEGMENTATION & BEHAVIORAL TARGETING: CUSTOMER DATA PLATFORM MARKET, BY REGION, 2025–2030 (USD MILLION)
TABLE 84
DATA ACTIVATION & REAL-TIME EXECUTION: CUSTOMER DATA PLATFORM MARKET, BY REGION, 2020–2024 (USD MILLION)
TABLE 85
DATA ACTIVATION & REAL-TIME EXECUTION: CUSTOMER DATA PLATFORM MARKET, BY REGION, 2025–2030 (USD MILLION)
TABLE 86
RISK & COMPLIANCE MANAGEMENT: CUSTOMER DATA PLATFORM MARKET, BY REGION, 2020–2024 (USD MILLION)
TABLE 87
RISK & COMPLIANCE MANAGEMENT: CUSTOMER DATA PLATFORM MARKET, BY REGION, 2025–2030 (USD MILLION)
TABLE 88
OMNICHANNEL CAMPAIGN MANAGEMENT: CUSTOMER DATA PLATFORM MARKET, BY REGION, 2020–2024 (USD MILLION)
TABLE 89
OMNICHANNEL CAMPAIGN MANAGEMENT: CUSTOMER DATA PLATFORM MARKET, BY REGION, 2025–2030 (USD MILLION)
TABLE 90
CHURN PREDICTION & PROPENSITY MODELING: CUSTOMER DATA PLATFORM MARKET, BY REGION, 2020–2024 (USD MILLION)
TABLE 91
CHURN PREDICTION & PROPENSITY MODELING: CUSTOMER DATA PLATFORM MARKET, BY REGION, 2025–2030 (USD MILLION)
TABLE 92
OTHER APPLICATIONS: CUSTOMER DATA PLATFORM MARKET, BY REGION, 2020–2024 (USD MILLION)
TABLE 93
OTHER APPLICATIONS: CUSTOMER DATA PLATFORM MARKET, BY REGION, 2025–2030 (USD MILLION)
TABLE 94
CONTACT CENTERS & CRM SYSTEMS: CUSTOMER DATA PLATFORM MARKET, BY REGION, 2020–2024 (USD MILLION)
TABLE 95
CONTACT CENTERS & CRM SYSTEMS: CUSTOMER DATA PLATFORM MARKET, BY REGION, 2025–2030 (USD MILLION)
TABLE 96
CUSTOMER DATA PLATFORM MARKET, BY VERTICAL, 2020–2024 (USD MILLION)
TABLE 97
CUSTOMER DATA PLATFORM MARKET, BY VERTICAL, 2025–2030 (USD MILLION)
TABLE 98
BFSI: CUSTOMER DATA PLATFORM MARKET, BY REGION, 2020–2024 (USD MILLION)
TABLE 99
BFSI: CUSTOMER DATA PLATFORM MARKET, BY REGION, 2025–2030 (USD MILLION)
TABLE 100
RETAIL & E-COMMERCE: CUSTOMER DATA PLATFORM MARKET, BY REGION, 2020–2024 (USD MILLION)
TABLE 101
RETAIL & E-COMMERCE: CUSTOMER DATA PLATFORM MARKET, BY REGION, 2025–2030 (USD MILLION)
TABLE 102
MEDIA & ENTERTAINMENT: CUSTOMER DATA PLATFORM MARKET, BY REGION, 2020–2024 (USD MILLION)
TABLE 103
MEDIA & ENTERTAINMENT: CUSTOMER DATA PLATFORM MARKET, BY REGION, 2025–2030 (USD MILLION)
TABLE 104
TRAVEL & HOSPITALITY: CUSTOMER DATA PLATFORM MARKET, BY REGION, 2020–2024 (USD MILLION)
TABLE 105
TRAVEL & HOSPITALITY: CUSTOMER DATA PLATFORM MARKET, BY REGION, 2025–2030 (USD MILLION)
TABLE 106
EDUCATION: CUSTOMER DATA PLATFORM MARKET, BY REGION, 2020–2024 (USD MILLION)
TABLE 107
EDUCATION: CUSTOMER DATA PLATFORM MARKET, BY REGION, 2025–2030 (USD MILLION)
TABLE 108
TELECOMMUNICATIONS: CUSTOMER DATA PLATFORM MARKET, BY REGION, 2020–2024 (USD MILLION)
TABLE 109
TELECOMMUNICATIONS: CUSTOMER DATA PLATFORM MARKET, BY REGION, 2025–2030 (USD MILLION)
TABLE 110
MANUFACTURING: CUSTOMER DATA PLATFORM MARKET, BY REGION, 2020–2024 (USD MILLION)
TABLE 111
MANUFACTURING: CUSTOMER DATA PLATFORM MARKET, BY REGION, 2025–2030 (USD MILLION)
TABLE 112
TECHNOLOGY & SOFTWARE: CUSTOMER DATA PLATFORM MARKET, BY REGION, 2020–2024 (USD MILLION)
TABLE 113
TECHNOLOGY & SOFTWARE: CUSTOMER DATA PLATFORM MARKET, BY REGION, 2025–2030 (USD MILLION)
TABLE 114
CONSTRUCTION & REAL ESTATE: CUSTOMER DATA PLATFORM MARKET, BY REGION, 2020–2024 (USD MILLION)
TABLE 115
CONSTRUCTION & REAL ESTATE: CUSTOMER DATA PLATFORM MARKET, BY REGION, 2025–2030 (USD MILLION)
TABLE 116
HEALTHCARE & LIFE SCIENCES: CUSTOMER DATA PLATFORM MARKET, BY REGION, 2020–2024 (USD MILLION)
TABLE 117
HEALTHCARE & LIFE SCIENCES: CUSTOMER DATA PLATFORM MARKET, BY REGION, 2025–2030 (USD MILLION)
TABLE 118
OTHER VERTICALS: CUSTOMER DATA PLATFORM MARKET, BY REGION, 2020–2024 (USD MILLION)
TABLE 119
OTHER VERTICALS: CUSTOMER DATA PLATFORM MARKET, BY REGION, 2025–2030 (USD MILLION)
TABLE 120
CUSTOMER DATA PLATFORM MARKET, BY REGION, 2020–2024 (USD MILLION)
TABLE 121
CUSTOMER DATA PLATFORM MARKET, BY REGION, 2025–2030 (USD MILLION)
TABLE 122
NORTH AMERICA: CUSTOMER DATA PLATFORM MARKET, BY OFFERING, 2020–2024 (USD MILLION)
TABLE 123
NORTH AMERICA: CUSTOMER DATA PLATFORM MARKET, BY OFFERING, 2025–2030 (USD MILLION)
TABLE 124
NORTH AMERICA: CUSTOMER DATA PLATFORM MARKET, BY PLATFORM TYPE, 2020–2024 (USD MILLION)
TABLE 125
NORTH AMERICA: CUSTOMER DATA PLATFORM MARKET, BY PLATFORM TYPE, 2025–2030 (USD MILLION)
TABLE 126
NORTH AMERICA: CUSTOMER DATA PLATFORM MARKET, BY SERVICE, 2020–2024 (USD MILLION)
TABLE 127
NORTH AMERICA: CUSTOMER DATA PLATFORM MARKET, BY SERVICE, 2025–2030 (USD MILLION)
TABLE 128
NORTH AMERICA: CUSTOMER DATA PLATFORM MARKET, BY PROFESSIONAL SERVICE, 2020–2024 (USD MILLION)
TABLE 129
NORTH AMERICA: CUSTOMER DATA PLATFORM MARKET, BY PROFESSIONAL SERVICE, 2025–2030 (USD MILLION)
TABLE 130
NORTH AMERICA: CUSTOMER DATA PLATFORM MARKET, BY DEPLOYMENT MODE, 2020–2024 (USD MILLION)
TABLE 131
NORTH AMERICA: CUSTOMER DATA PLATFORM MARKET, BY DEPLOYMENT MODE, 2025–2030 (USD MILLION)
TABLE 132
NORTH AMERICA: CUSTOMER DATA PLATFORM MARKET, BY DATA TYPE, 2020–2024 (USD MILLION)
TABLE 133
NORTH AMERICA: CUSTOMER DATA PLATFORM MARKET, BY DATA TYPE, 2025–2030 (USD MILLION)
TABLE 134
NORTH AMERICA: CUSTOMER DATA PLATFORM MARKET, BY DATA CHANNEL, 2020–2024 (USD MILLION)
TABLE 135
NORTH AMERICA: CUSTOMER DATA PLATFORM MARKET, BY DATA CHANNEL, 2025–2030 (USD MILLION)
TABLE 136
NORTH AMERICA: CUSTOMER DATA PLATFORM MARKET, BY APPLICATION, 2020–2024 (USD MILLION)
TABLE 137
NORTH AMERICA: CUSTOMER DATA PLATFORM MARKET, BY APPLICATION, 2025–2030 (USD MILLION)
TABLE 138
NORTH AMERICA: CUSTOMER DATA PLATFORM MARKET, BY VERTICAL, 2020–2024 (USD MILLION)
TABLE 139
NORTH AMERICA: CUSTOMER DATA PLATFORM MARKET, BY VERTICAL, 2025–2030 (USD MILLION)
TABLE 140
NORTH AMERICA: CUSTOMER DATA PLATFORM MARKET, BY COUNTRY, 2020–2024 (USD MILLION)
TABLE 141
NORTH AMERICA: CUSTOMER DATA PLATFORM MARKET, BY COUNTRY, 2025–2030 (USD MILLION)
TABLE 142
US: CUSTOMER DATA PLATFORM MARKET, BY OFFERING, 2020–2024 (USD MILLION)
TABLE 143
US: CUSTOMER DATA PLATFORM MARKET, BY OFFERING, 2025–2030 (USD MILLION)
TABLE 144
US: CUSTOMER DATA PLATFORM MARKET, BY PLATFORM TYPE, 2020–2024 (USD MILLION)
TABLE 145
US: CUSTOMER DATA PLATFORM MARKET, BY PLATFORM TYPE, 2025–2030 (USD MILLION)
TABLE 146
US: CUSTOMER DATA PLATFORM MARKET, BY SERVICE, 2020–2024 (USD MILLION)
TABLE 147
US: CUSTOMER DATA PLATFORM MARKET, BY SERVICE, 2025–2030 (USD MILLION)
TABLE 148
US: CUSTOMER DATA PLATFORM MARKET, BY PROFESSIONAL SERVICE, 2020–2024 (USD MILLION)
TABLE 149
US: CUSTOMER DATA PLATFORM MARKET, BY PROFESSIONAL SERVICE, 2025–2030 (USD MILLION)
TABLE 150
US: CUSTOMER DATA PLATFORM MARKET, BY DEPLOYMENT MODE, 2020–2024 (USD MILLION)
TABLE 151
US: CUSTOMER DATA PLATFORM MARKET, BY DEPLOYMENT MODE, 2025–2030 (USD MILLION)
TABLE 152
US: CUSTOMER DATA PLATFORM MARKET, BY APPLICATION, 2020–2024 (USD MILLION)
TABLE 153
US: CUSTOMER DATA PLATFORM MARKET, BY APPLICATION, 2025–2030 (USD MILLION)
TABLE 154
US: CUSTOMER DATA PLATFORM MARKET, BY VERTICAL, 2020–2024 (USD MILLION)
TABLE 155
US: CUSTOMER DATA PLATFORM MARKET, BY VERTICAL, 2025–2030 (USD MILLION)
TABLE 156
CANADA: CUSTOMER DATA PLATFORM MARKET, BY OFFERING, 2020–2024 (USD MILLION)
TABLE 157
CANADA: CUSTOMER DATA PLATFORM MARKET, BY OFFERING, 2025–2030 (USD MILLION)
TABLE 158
CANADA: CUSTOMER DATA PLATFORM MARKET, BY PLATFORM TYPE, 2020–2024 (USD MILLION)
TABLE 159
CANADA: CUSTOMER DATA PLATFORM MARKET, BY PLATFORM TYPE, 2025–2030 (USD MILLION)
TABLE 160
CANADA: CUSTOMER DATA PLATFORM MARKET, BY SERVICE, 2020–2024 (USD MILLION)
TABLE 161
CANADA: CUSTOMER DATA PLATFORM MARKET, BY SERVICE, 2025–2030 (USD MILLION)
TABLE 162
CANADA: CUSTOMER DATA PLATFORM MARKET, BY PROFESSIONAL SERVICE, 2020–2024 (USD MILLION)
TABLE 163
CANADA: CUSTOMER DATA PLATFORM MARKET, BY PROFESSIONAL SERVICE, 2025–2030 (USD MILLION)
TABLE 164
CANADA: CUSTOMER DATA PLATFORM MARKET, BY DEPLOYMENT MODE, 2020–2024 (USD MILLION)
TABLE 165
CANADA: CUSTOMER DATA PLATFORM MARKET, BY DEPLOYMENT MODE, 2025–2030 (USD MILLION)
TABLE 166
CANADA: CUSTOMER DATA PLATFORM MARKET, BY APPLICATION, 2020–2024 (USD MILLION)
TABLE 167
CANADA: CUSTOMER DATA PLATFORM MARKET, BY APPLICATION, 2025–2030 (USD MILLION)
TABLE 168
CANADA: CUSTOMER DATA PLATFORM MARKET, BY VERTICAL, 2020–2024 (USD MILLION)
TABLE 169
CANADA: CUSTOMER DATA PLATFORM MARKET, BY VERTICAL, 2025–2030 (USD MILLION)
TABLE 170
EUROPE: CUSTOMER DATA PLATFORM MARKET, BY OFFERING, 2020–2024 (USD MILLION)
TABLE 171
EUROPE: CUSTOMER DATA PLATFORM MARKET, BY OFFERING, 2025–2030 (USD MILLION)
TABLE 172
EUROPE: CUSTOMER DATA PLATFORM MARKET, BY PLATFORM TYPE, 2020–2024 (USD MILLION)
TABLE 173
EUROPE: CUSTOMER DATA PLATFORM MARKET, BY PLATFORM TYPE, 2025–2030 (USD MILLION)
TABLE 174
EUROPE: CUSTOMER DATA PLATFORM MARKET, BY SERVICE, 2020–2024 (USD MILLION)
TABLE 175
EUROPE: CUSTOMER DATA PLATFORM MARKET, BY SERVICE, 2025–2030 (USD MILLION)
TABLE 176
EUROPE: CUSTOMER DATA PLATFORM MARKET, BY PROFESSIONAL SERVICE, 2020–2024 (USD MILLION)
TABLE 177
EUROPE: CUSTOMER DATA PLATFORM MARKET, BY PROFESSIONAL SERVICE, 2025–2030 (USD MILLION)
TABLE 178
EUROPE: CUSTOMER DATA PLATFORM MARKET, BY DEPLOYMENT MODE, 2020–2024 (USD MILLION)
TABLE 179
EUROPE: CUSTOMER DATA PLATFORM MARKET, BY DEPLOYMENT MODE, 2025–2030 (USD MILLION)
TABLE 180
EUROPE: CUSTOMER DATA PLATFORM MARKET, BY DATA TYPE, 2020–2024 (USD MILLION)
TABLE 181
EUROPE: CUSTOMER DATA PLATFORM MARKET, BY DATA TYPE, 2025–2030 (USD MILLION)
TABLE 182
EUROPE: CUSTOMER DATA PLATFORM MARKET, BY DATA CHANNEL, 2020–2024 (USD MILLION)
TABLE 183
EUROPE: CUSTOMER DATA PLATFORM MARKET, BY DATA CHANNEL, 2025–2030 (USD MILLION)
TABLE 184
EUROPE: CUSTOMER DATA PLATFORM MARKET, BY APPLICATION, 2020–2024 (USD MILLION)
TABLE 185
EUROPE: CUSTOMER DATA PLATFORM MARKET, BY APPLICATION, 2025–2030 (USD MILLION)
TABLE 186
EUROPE: CUSTOMER DATA PLATFORM MARKET, BY VERTICAL, 2020–2024 (USD MILLION)
TABLE 187
EUROPE: CUSTOMER DATA PLATFORM MARKET, BY VERTICAL, 2025–2030 (USD MILLION)
TABLE 188
EUROPE: CUSTOMER DATA PLATFORM MARKET, BY COUNTRY, 2020–2024 (USD MILLION)
TABLE 189
EUROPE: CUSTOMER DATA PLATFORM MARKET, BY COUNTRY, 2025–2030 (USD MILLION)
TABLE 190
UK: CUSTOMER DATA PLATFORM MARKET, BY OFFERING, 2020–2024 (USD MILLION)
TABLE 191
UK: CUSTOMER DATA PLATFORM MARKET, BY OFFERING, 2025–2030 (USD MILLION)
TABLE 192
UK: CUSTOMER DATA PLATFORM MARKET, BY PLATFORM TYPE, 2020–2024 (USD MILLION)
TABLE 193
UK: CUSTOMER DATA PLATFORM MARKET, BY PLATFORM TYPE, 2025–2030 (USD MILLION)
TABLE 194
UK: CUSTOMER DATA PLATFORM MARKET, BY SERVICE, 2020–2024 (USD MILLION)
TABLE 195
UK: CUSTOMER DATA PLATFORM MARKET, BY SERVICE, 2025–2030 (USD MILLION)
TABLE 196
UK: CUSTOMER DATA PLATFORM MARKET, BY PROFESSIONAL SERVICE, 2020–2024 (USD MILLION)
TABLE 197
UK: CUSTOMER DATA PLATFORM MARKET, BY PROFESSIONAL SERVICE, 2025–2030 (USD MILLION)
TABLE 198
UK: CUSTOMER DATA PLATFORM MARKET, BY DEPLOYMENT MODE, 2020–2024 (USD MILLION)
TABLE 199
UK: CUSTOMER DATA PLATFORM MARKET, BY DEPLOYMENT MODE, 2025–2030 (USD MILLION)
TABLE 200
UK: CUSTOMER DATA PLATFORM MARKET, BY APPLICATION, 2020–2024 (USD MILLION)
TABLE 201
UK: CUSTOMER DATA PLATFORM MARKET, BY APPLICATION, 2025–2030 (USD MILLION)
TABLE 202
UK: CUSTOMER DATA PLATFORM MARKET, BY VERTICAL, 2020–2024 (USD MILLION)
TABLE 203
UK: CUSTOMER DATA PLATFORM MARKET, BY VERTICAL, 2025–2030 (USD MILLION)
TABLE 204
GERMANY: CUSTOMER DATA PLATFORM MARKET, BY OFFERING, 2020–2024 (USD MILLION)
TABLE 205
GERMANY: CUSTOMER DATA PLATFORM MARKET, BY OFFERING, 2025–2030 (USD MILLION)
TABLE 206
GERMANY: CUSTOMER DATA PLATFORM MARKET, BY PLATFORM TYPE, 2020–2024 (USD MILLION)
TABLE 207
GERMANY: CUSTOMER DATA PLATFORM MARKET, BY PLATFORM TYPE, 2025–2030 (USD MILLION)
TABLE 208
GERMANY: CUSTOMER DATA PLATFORM MARKET, BY SERVICE, 2020–2024 (USD MILLION)
TABLE 209
GERMANY: CUSTOMER DATA PLATFORM MARKET, BY SERVICE, 2025–2030 (USD MILLION)
TABLE 210
GERMANY: CUSTOMER DATA PLATFORM MARKET, BY PROFESSIONAL SERVICE, 2020–2024 (USD MILLION)
TABLE 211
GERMANY: CUSTOMER DATA PLATFORM MARKET, BY PROFESSIONAL SERVICE, 2025–2030 (USD MILLION)
TABLE 212
GERMANY: CUSTOMER DATA PLATFORM MARKET, BY DEPLOYMENT MODE, 2020–2024 (USD MILLION)
TABLE 213
GERMANY: CUSTOMER DATA PLATFORM MARKET, BY DEPLOYMENT MODE, 2025–2030 (USD MILLION)
TABLE 214
GERMANY: CUSTOMER DATA PLATFORM MARKET, BY APPLICATION, 2020–2024 (USD MILLION)
TABLE 215
GERMANY: CUSTOMER DATA PLATFORM MARKET, BY APPLICATION, 2025–2030 (USD MILLION)
TABLE 216
GERMANY: CUSTOMER DATA PLATFORM MARKET, BY VERTICAL, 2020–2024 (USD MILLION)
TABLE 217
GERMANY: CUSTOMER DATA PLATFORM MARKET, BY VERTICAL, 2025–2030 (USD MILLION)
TABLE 218
FRANCE: CUSTOMER DATA PLATFORM MARKET, BY OFFERING, 2020–2024 (USD MILLION)
TABLE 219
FRANCE: CUSTOMER DATA PLATFORM MARKET, BY OFFERING, 2025–2030 (USD MILLION)
TABLE 220
FRANCE: CUSTOMER DATA PLATFORM MARKET, BY PLATFORM TYPE, 2020–2024 (USD MILLION)
TABLE 221
FRANCE: CUSTOMER DATA PLATFORM MARKET, BY PLATFORM TYPE, 2025–2030 (USD MILLION)
TABLE 222
FRANCE: CUSTOMER DATA PLATFORM MARKET, BY SERVICE, 2020–2024 (USD MILLION)
TABLE 223
FRANCE: CUSTOMER DATA PLATFORM MARKET, BY SERVICE, 2025–2030 (USD MILLION)
TABLE 224
FRANCE: CUSTOMER DATA PLATFORM MARKET, BY PROFESSIONAL SERVICE, 2020–2024 (USD MILLION)
TABLE 225
FRANCE: CUSTOMER DATA PLATFORM MARKET, BY PROFESSIONAL SERVICE, 2025–2030 (USD MILLION)
TABLE 226
FRANCE: CUSTOMER DATA PLATFORM MARKET, BY DEPLOYMENT MODE, 2020–2024 (USD MILLION)
TABLE 227
FRANCE: CUSTOMER DATA PLATFORM MARKET, BY DEPLOYMENT MODE, 2025–2030 (USD MILLION)
TABLE 228
FRANCE: CUSTOMER DATA PLATFORM MARKET, BY APPLICATION, 2020–2024 (USD MILLION)
TABLE 229
FRANCE: CUSTOMER DATA PLATFORM MARKET, BY APPLICATION, 2025–2030 (USD MILLION)
TABLE 230
FRANCE: CUSTOMER DATA PLATFORM MARKET, BY VERTICAL, 2020–2024 (USD MILLION)
TABLE 231
FRANCE: CUSTOMER DATA PLATFORM MARKET, BY VERTICAL, 2025–2030 (USD MILLION)
TABLE 232
ITALY: CUSTOMER DATA PLATFORM MARKET, BY OFFERING, 2020–2024 (USD MILLION)
TABLE 233
ITALY: CUSTOMER DATA PLATFORM MARKET, BY OFFERING, 2025–2030 (USD MILLION)
TABLE 234
SPAIN: CUSTOMER DATA PLATFORM MARKET, BY OFFERING, 2020–2024 (USD MILLION)
TABLE 235
SPAIN: CUSTOMER DATA PLATFORM MARKET, BY OFFERING, 2025–2030 (USD MILLION)
TABLE 236
REST OF EUROPE: CUSTOMER DATA PLATFORM MARKET, BY OFFERING, 2020–2024 (USD MILLION)
TABLE 237
REST OF EUROPE: CUSTOMER DATA PLATFORM MARKET, BY OFFERING, 2025–2030 (USD MILLION)
TABLE 238
ASIA PACIFIC: CUSTOMER DATA PLATFORM MARKET, BY OFFERING, 2020–2024 (USD MILLION)
TABLE 239
ASIA PACIFIC: CUSTOMER DATA PLATFORM MARKET, BY OFFERING, 2025–2030 (USD MILLION)
TABLE 240
ASIA PACIFIC: CUSTOMER DATA PLATFORM MARKET, BY PLATFORM TYPE, 2020–2024 (USD MILLION)
TABLE 241
ASIA PACIFIC: CUSTOMER DATA PLATFORM MARKET, BY PLATFORM TYPE, 2025–2030 (USD MILLION)
TABLE 242
ASIA PACIFIC: CUSTOMER DATA PLATFORM MARKET, BY SERVICE, 2020–2024 (USD MILLION)
TABLE 243
ASIA PACIFIC: CUSTOMER DATA PLATFORM MARKET, BY SERVICE, 2025–2030 (USD MILLION)
TABLE 244
ASIA PACIFIC: CUSTOMER DATA PLATFORM MARKET, BY PROFESSIONAL SERVICE, 2020–2024 (USD MILLION)
TABLE 245
ASIA PACIFIC: CUSTOMER DATA PLATFORM MARKET, BY PROFESSIONAL SERVICE, 2025–2030 (USD MILLION)
TABLE 246
ASIA PACIFIC: CUSTOMER DATA PLATFORM MARKET, BY DEPLOYMENT MODE, 2020–2024 (USD MILLION)
TABLE 247
ASIA PACIFIC: CUSTOMER DATA PLATFORM MARKET, BY DEPLOYMENT MODE, 2025–2030 (USD MILLION)
TABLE 248
ASIA PACIFIC: CUSTOMER DATA PLATFORM MARKET, BY DATA TYPE, 2020–2024 (USD MILLION)
TABLE 249
ASIA PACIFIC: CUSTOMER DATA PLATFORM MARKET, BY DATA TYPE, 2025–2030 (USD MILLION)
TABLE 250
ASIA PACIFIC: CUSTOMER DATA PLATFORM MARKET, BY DATA CHANNEL, 2020–2024 (USD MILLION)
TABLE 251
ASIA PACIFIC: CUSTOMER DATA PLATFORM MARKET, BY DATA CHANNEL, 2025–2030 (USD MILLION)
TABLE 252
ASIA PACIFIC: CUSTOMER DATA PLATFORM MARKET, BY APPLICATION, 2020–2024 (USD MILLION)
TABLE 253
ASIA PACIFIC: CUSTOMER DATA PLATFORM MARKET, BY APPLICATION, 2025–2030 (USD MILLION)
TABLE 254
ASIA PACIFIC: CUSTOMER DATA PLATFORM MARKET, BY VERTICAL, 2020–2024 (USD MILLION)
TABLE 255
ASIA PACIFIC: CUSTOMER DATA PLATFORM MARKET, BY VERTICAL, 2025–2030 (USD MILLION)
TABLE 256
ASIA PACIFIC: CUSTOMER DATA PLATFORM MARKET, BY COUNTRY, 2020–2024 (USD MILLION)
TABLE 257
ASIA PACIFIC: CUSTOMER DATA PLATFORM MARKET, BY COUNTRY, 2025–2030 (USD MILLION)
TABLE 258
CHINA: CUSTOMER DATA PLATFORM MARKET, BY OFFERING, 2020–2024 (USD MILLION)
TABLE 259
CHINA: CUSTOMER DATA PLATFORM MARKET, BY OFFERING, 2025–2030 (USD MILLION)
TABLE 260
CHINA: CUSTOMER DATA PLATFORM MARKET, BY PLATFORM TYPE, 2020–2024 (USD MILLION)
TABLE 261
CHINA: CUSTOMER DATA PLATFORM MARKET, BY PLATFORM TYPE, 2025–2030 (USD MILLION)
TABLE 262
CHINA: CUSTOMER DATA PLATFORM MARKET, BY SERVICE, 2020–2024 (USD MILLION)
TABLE 263
CHINA: CUSTOMER DATA PLATFORM MARKET, BY SERVICE, 2025–2030 (USD MILLION)
TABLE 264
CHINA: CUSTOMER DATA PLATFORM MARKET, BY PROFESSIONAL SERVICE, 2020–2024 (USD MILLION)
TABLE 265
CHINA: CUSTOMER DATA PLATFORM MARKET, BY PROFESSIONAL SERVICE, 2025–2030 (USD MILLION)
TABLE 266
CHINA: CUSTOMER DATA PLATFORM MARKET, BY DEPLOYMENT MODE, 2020–2024 (USD MILLION)
TABLE 267
CHINA: CUSTOMER DATA PLATFORM MARKET, BY DEPLOYMENT MODE, 2025–2030 (USD MILLION)
TABLE 268
CHINA: CUSTOMER DATA PLATFORM MARKET, BY APPLICATION, 2020–2024 (USD MILLION)
TABLE 269
CHINA: CUSTOMER DATA PLATFORM MARKET, BY APPLICATION, 2025–2030 (USD MILLION)
TABLE 270
CHINA: CUSTOMER DATA PLATFORM MARKET, BY VERTICAL, 2020–2024 (USD MILLION)
TABLE 271
CHINA: CUSTOMER DATA PLATFORM MARKET, BY VERTICAL, 2025–2030 (USD MILLION)
TABLE 272
JAPAN: CUSTOMER DATA PLATFORM MARKET, BY OFFERING, 2020–2024 (USD MILLION)
TABLE 273
JAPAN: CUSTOMER DATA PLATFORM MARKET, BY OFFERING, 2025–2030 (USD MILLION)
TABLE 274
JAPAN: CUSTOMER DATA PLATFORM MARKET, BY PLATFORM TYPE, 2020–2024 (USD MILLION)
TABLE 275
JAPAN: CUSTOMER DATA PLATFORM MARKET, BY PLATFORM TYPE, 2025–2030 (USD MILLION)
TABLE 276
JAPAN: CUSTOMER DATA PLATFORM MARKET, BY SERVICE, 2020–2024 (USD MILLION)
TABLE 277
JAPAN: CUSTOMER DATA PLATFORM MARKET, BY SERVICE, 2025–2030 (USD MILLION)
TABLE 278
JAPAN: CUSTOMER DATA PLATFORM MARKET, BY PROFESSIONAL SERVICE, 2020–2024 (USD MILLION)
TABLE 279
JAPAN: CUSTOMER DATA PLATFORM MARKET, BY PROFESSIONAL SERVICE, 2025–2030 (USD MILLION)
TABLE 280
JAPAN: CUSTOMER DATA PLATFORM MARKET, BY DEPLOYMENT MODE, 2020–2024 (USD MILLION)
TABLE 281
JAPAN: CUSTOMER DATA PLATFORM MARKET, BY DEPLOYMENT MODE, 2025–2030 (USD MILLION)
TABLE 282
JAPAN: CUSTOMER DATA PLATFORM MARKET, BY APPLICATION, 2020–2024 (USD MILLION)
TABLE 283
JAPAN: CUSTOMER DATA PLATFORM MARKET, BY APPLICATION, 2025–2030 (USD MILLION)
TABLE 284
JAPAN: CUSTOMER DATA PLATFORM MARKET, BY VERTICAL, 2020–2024 (USD MILLION)
TABLE 285
JAPAN: CUSTOMER DATA PLATFORM MARKET, BY VERTICAL, 2025–2030 (USD MILLION)
TABLE 286
INDIA: CUSTOMER DATA PLATFORM MARKET, BY OFFERING, 2020–2024 (USD MILLION)
TABLE 287
INDIA: CUSTOMER DATA PLATFORM MARKET, BY OFFERING, 2025–2030 (USD MILLION)
TABLE 288
INDIA: CUSTOMER DATA PLATFORM MARKET, BY PLATFORM TYPE, 2020–2024 (USD MILLION)
TABLE 289
INDIA: CUSTOMER DATA PLATFORM MARKET, BY PLATFORM TYPE, 2025–2030 (USD MILLION)
TABLE 290
INDIA: CUSTOMER DATA PLATFORM MARKET, BY SERVICE, 2020–2024 (USD MILLION)
TABLE 291
INDIA: CUSTOMER DATA PLATFORM MARKET, BY SERVICE, 2025–2030 (USD MILLION)
TABLE 292
INDIA: CUSTOMER DATA PLATFORM MARKET, BY PROFESSIONAL SERVICE, 2020–2024 (USD MILLION)
TABLE 293
INDIA: CUSTOMER DATA PLATFORM MARKET, BY PROFESSIONAL SERVICE, 2025–2030 (USD MILLION)
TABLE 294
INDIA: CUSTOMER DATA PLATFORM MARKET, BY DEPLOYMENT MODE, 2020–2024 (USD MILLION)
TABLE 295
INDIA: CUSTOMER DATA PLATFORM MARKET, BY DEPLOYMENT MODE, 2025–2030 (USD MILLION)
TABLE 296
INDIA: CUSTOMER DATA PLATFORM MARKET, BY APPLICATION, 2020–2024 (USD MILLION)
TABLE 297
INDIA: CUSTOMER DATA PLATFORM MARKET, BY APPLICATION, 2025–2030 (USD MILLION)
TABLE 298
INDIA: CUSTOMER DATA PLATFORM MARKET, BY VERTICAL, 2020–2024 (USD MILLION)
TABLE 299
INDIA: CUSTOMER DATA PLATFORM MARKET, BY VERTICAL, 2025–2030 (USD MILLION)
TABLE 300
SOUTH KOREA: CUSTOMER DATA PLATFORM MARKET, BY OFFERING, 2020–2024 (USD MILLION)
TABLE 301
SOUTH KOREA: CUSTOMER DATA PLATFORM MARKET, BY OFFERING, 2025–2030 (USD MILLION)
TABLE 302
AUSTRALIA & NEW ZEALAND: CUSTOMER DATA PLATFORM MARKET, BY OFFERING, 2020–2024 (USD MILLION)
TABLE 303
AUSTRALIA & NEW ZEALAND: CUSTOMER DATA PLATFORM MARKET, BY OFFERING, 2025–2030 (USD MILLION)
TABLE 304
REST OF ASIA PACIFIC: CUSTOMER DATA PLATFORM MARKET, BY OFFERING, 2020–2024 (USD MILLION)
TABLE 305
REST OF ASIA PACIFIC: CUSTOMER DATA PLATFORM MARKET, BY OFFERING, 2025–2030 (USD MILLION)
TABLE 306
MIDDLE EAST & AFRICA: CUSTOMER DATA PLATFORM MARKET, BY OFFERING, 2020–2024 (USD MILLION)
TABLE 307
MIDDLE EAST & AFRICA: CUSTOMER DATA PLATFORM MARKET, BY OFFERING, 2025–2030 (USD MILLION)
TABLE 308
MIDDLE EAST & AFRICA: CUSTOMER DATA PLATFORM MARKET, BY PLATFORM TYPE, 2020–2024 (USD MILLION)
TABLE 309
MIDDLE EAST & AFRICA: CUSTOMER DATA PLATFORM MARKET, BY PLATFORM TYPE, 2025–2030 (USD MILLION)
TABLE 310
MIDDLE EAST & AFRICA: CUSTOMER DATA PLATFORM MARKET, BY SERVICE, 2020–2024 (USD MILLION)
TABLE 311
MIDDLE EAST & AFRICA: CUSTOMER DATA PLATFORM MARKET, BY SERVICE, 2025–2030 (USD MILLION)
TABLE 312
MIDDLE EAST & AFRICA: CUSTOMER DATA PLATFORM MARKET, BY PROFESSIONAL SERVICE, 2020–2024 (USD MILLION)
TABLE 313
MIDDLE EAST & AFRICA: CUSTOMER DATA PLATFORM MARKET, BY PROFESSIONAL SERVICE, 2025–2030 (USD MILLION)
TABLE 314
MIDDLE EAST & AFRICA: CUSTOMER DATA PLATFORM MARKET, BY DEPLOYMENT MODE, 2020–2024 (USD MILLION)
TABLE 315
MIDDLE EAST & AFRICA: CUSTOMER DATA PLATFORM MARKET, BY DEPLOYMENT MODE, 2025–2030 (USD MILLION)
TABLE 316
MIDDLE EAST & AFRICA: CUSTOMER DATA PLATFORM MARKET, BY DATA TYPE, 2020–2024 (USD MILLION)
TABLE 317
MIDDLE EAST & AFRICA: CUSTOMER DATA PLATFORM MARKET, BY DATA TYPE, 2025–2030 (USD MILLION)
TABLE 318
MIDDLE EAST & AFRICA: CUSTOMER DATA PLATFORM MARKET, BY DATA CHANNEL, 2020–2024 (USD MILLION)
TABLE 319
MIDDLE EAST & AFRICA: CUSTOMER DATA PLATFORM MARKET, BY DATA CHANNEL, 2025–2030 (USD MILLION)
TABLE 320
MIDDLE EAST & AFRICA: CUSTOMER DATA PLATFORM MARKET, BY APPLICATION, 2020–2024 (USD MILLION)
TABLE 321
MIDDLE EAST & AFRICA: CUSTOMER DATA PLATFORM MARKET, BY APPLICATION, 2025–2030 (USD MILLION)
TABLE 322
MIDDLE EAST & AFRICA: CUSTOMER DATA PLATFORM MARKET, BY VERTICAL, 2020–2024 (USD MILLION)
TABLE 323
MIDDLE EAST & AFRICA: CUSTOMER DATA PLATFORM MARKET, BY VERTICAL, 2025–2030 (USD MILLION)
TABLE 324
MIDDLE EAST: CUSTOMER DATA PLATFORM MARKET, BY COUNTRY, 2020–2024 (USD MILLION)
TABLE 325
MIDDLE EAST: CUSTOMER DATA PLATFORM MARKET, BY COUNTRY, 2025–2030 (USD MILLION)
TABLE 326
SAUDI ARABIA: CUSTOMER DATA PLATFORM MARKET, BY OFFERING, 2020–2024 (USD MILLION)
TABLE 327
SAUDI ARABIA: CUSTOMER DATA PLATFORM MARKET, BY OFFERING, 2025–2030 (USD MILLION)
TABLE 328
SAUDI ARABIA: CUSTOMER DATA PLATFORM MARKET, BY PLATFORM TYPE, 2020–2024 (USD MILLION)
TABLE 329
SAUDI ARABIA: CUSTOMER DATA PLATFORM MARKET, BY PLATFORM TYPE, 2025–2030 (USD MILLION)
TABLE 330
SAUDI ARABIA: CUSTOMER DATA PLATFORM MARKET, BY SERVICE, 2020–2024 (USD MILLION)
TABLE 331
SAUDI ARABIA: CUSTOMER DATA PLATFORM MARKET, BY SERVICE, 2025–2030 (USD MILLION)
TABLE 332
SAUDI ARABIA: CUSTOMER DATA PLATFORM MARKET, BY PROFESSIONAL SERVICE, 2020–2024 (USD MILLION)
TABLE 333
SAUDI ARABIA: CUSTOMER DATA PLATFORM MARKET, BY PROFESSIONAL SERVICE, 2025–2030 (USD MILLION)
TABLE 334
SAUDI ARABIA: CUSTOMER DATA PLATFORM MARKET, BY DEPLOYMENT MODE, 2020–2024 (USD MILLION)
TABLE 335
SAUDI ARABIA: CUSTOMER DATA PLATFORM MARKET, BY DEPLOYMENT MODE, 2025–2030 (USD MILLION)
TABLE 336
SAUDI ARABIA: CUSTOMER DATA PLATFORM MARKET, BY APPLICATION, 2020–2024 (USD MILLION)
TABLE 337
SAUDI ARABIA: CUSTOMER DATA PLATFORM MARKET, BY APPLICATION, 2025–2030 (USD MILLION)
TABLE 338
SAUDI ARABIA: CUSTOMER DATA PLATFORM MARKET, BY VERTICAL, 2020–2024 (USD MILLION)
TABLE 339
SAUDI ARABIA: CUSTOMER DATA PLATFORM MARKET, BY VERTICAL, 2025–2030 (USD MILLION)
TABLE 340
UAE: CUSTOMER DATA PLATFORM MARKET, BY OFFERING, 2020–2024 (USD MILLION)
TABLE 341
UAE: CUSTOMER DATA PLATFORM MARKET, BY OFFERING, 2025–2030 (USD MILLION)
TABLE 342
TURKEY: CUSTOMER DATA PLATFORM MARKET, BY OFFERING, 2020–2024 (USD MILLION)
TABLE 343
TURKEY: CUSTOMER DATA PLATFORM MARKET, BY OFFERING, 2025–2030 (USD MILLION)
TABLE 344
SOUTH AFRICA: CUSTOMER DATA PLATFORM MARKET, BY OFFERING, 2020–2024 (USD MILLION)
TABLE 345
SOUTH AFRICA: CUSTOMER DATA PLATFORM MARKET, BY OFFERING, 2025–2030 (USD MILLION)
TABLE 346
REST OF MIDDLE EAST: CUSTOMER DATA PLATFORM MARKET, BY OFFERING, 2020–2024 (USD MILLION)
TABLE 347
REST OF THE MIDDLE EAST: CUSTOMER DATA PLATFORM MARKET, BY OFFERING, 2025–2030 (USD MILLION)
TABLE 348
LATIN AMERICA: CUSTOMER DATA PLATFORM MARKET, BY OFFERING, 2020–2024 (USD MILLION)
TABLE 349
LATIN AMERICA: CUSTOMER DATA PLATFORM MARKET, BY OFFERING, 2025–2030 (USD MILLION)
TABLE 350
LATIN AMERICA: CUSTOMER DATA PLATFORM MARKET, BY PLATFORM TYPE, 2020–2024 (USD MILLION)
TABLE 351
LATIN AMERICA: CUSTOMER DATA PLATFORM MARKET, BY PLATFORM TYPE, 2025–2030 (USD MILLION)
TABLE 352
LATIN AMERICA: CUSTOMER DATA PLATFORM MARKET, BY SERVICE, 2020–2024 (USD MILLION)
TABLE 353
LATIN AMERICA: CUSTOMER DATA PLATFORM MARKET, BY SERVICE, 2025–2030 (USD MILLION)
TABLE 354
LATIN AMERICA: CUSTOMER DATA PLATFORM MARKET, BY PROFESSIONAL SERVICE, 2020–2024 (USD MILLION)
TABLE 355
LATIN AMERICA: CUSTOMER DATA PLATFORM MARKET, BY PROFESSIONAL SERVICE, 2025–2030 (USD MILLION)
TABLE 356
LATIN AMERICA: CUSTOMER DATA PLATFORM MARKET, BY DEPLOYMENT MODE, 2020–2024 (USD MILLION)
TABLE 357
LATIN AMERICA: CUSTOMER DATA PLATFORM MARKET, BY DEPLOYMENT MODE, 2025–2030 (USD MILLION)
TABLE 358
LATIN AMERICA: CUSTOMER DATA PLATFORM MARKET, BY DATA TYPE, 2020–2024 (USD MILLION)
TABLE 359
LATIN AMERICA: CUSTOMER DATA PLATFORM MARKET, BY DATA TYPE, 2025–2030 (USD MILLION)
TABLE 360
LATIN AMERICA: CUSTOMER DATA PLATFORM MARKET, BY DATA CHANNEL, 2020–2024 (USD MILLION)
TABLE 361
LATIN AMERICA: CUSTOMER DATA PLATFORM MARKET, BY DATA CHANNEL, 2025–2030 (USD MILLION)
TABLE 362
LATIN AMERICA: CUSTOMER DATA PLATFORM MARKET, BY APPLICATION, 2020–2024 (USD MILLION)
TABLE 363
LATIN AMERICA: CUSTOMER DATA PLATFORM MARKET, BY APPLICATION, 2025–2030 (USD MILLION)
TABLE 364
LATIN AMERICA: CUSTOMER DATA PLATFORM MARKET, BY VERTICAL, 2020–2024 (USD MILLION)
TABLE 365
LATIN AMERICA: CUSTOMER DATA PLATFORM MARKET, BY VERTICAL, 2025–2030 (USD MILLION)
TABLE 366
LATIN AMERICA: CUSTOMER DATA PLATFORM MARKET, BY COUNTRY, 2020–2024 (USD MILLION)
TABLE 367
LATIN AMERICA: CUSTOMER DATA PLATFORM MARKET, BY COUNTRY, 2025–2030 (USD MILLION)
TABLE 368
BRAZIL: CUSTOMER DATA PLATFORM MARKET, BY OFFERING, 2020–2024 (USD MILLION)
TABLE 369
BRAZIL: CUSTOMER DATA PLATFORM MARKET, BY OFFERING, 2025–2030 (USD MILLION)
TABLE 370
BRAZIL: CUSTOMER DATA PLATFORM MARKET, BY PLATFORM TYPE, 2020–2024 (USD MILLION)
TABLE 371
BRAZIL: CUSTOMER DATA PLATFORM MARKET, BY PLATFORM TYPE, 2025–2030 (USD MILLION)
TABLE 372
BRAZIL: CUSTOMER DATA PLATFORM MARKET, BY SERVICE, 2020–2024 (USD MILLION)
TABLE 373
BRAZIL: CUSTOMER DATA PLATFORM MARKET, BY SERVICE, 2025–2030 (USD MILLION)
TABLE 374
BRAZIL: CUSTOMER DATA PLATFORM MARKET, BY PROFESSIONAL SERVICE, 2020–2024 (USD MILLION)
TABLE 375
BRAZIL: CUSTOMER DATA PLATFORM MARKET, BY PROFESSIONAL SERVICE, 2025–2030 (USD MILLION)
TABLE 376
BRAZIL: CUSTOMER DATA PLATFORM MARKET, BY DEPLOYMENT MODE, 2020–2024 (USD MILLION)
TABLE 377
BRAZIL: CUSTOMER DATA PLATFORM MARKET, BY DEPLOYMENT MODE, 2025–2030 (USD MILLION)
TABLE 378
BRAZIL: CUSTOMER DATA PLATFORM MARKET, BY APPLICATION, 2020–2024 (USD MILLION)
TABLE 379
BRAZIL: CUSTOMER DATA PLATFORM MARKET, BY APPLICATION, 2025–2030 (USD MILLION)
TABLE 380
BRAZIL: CUSTOMER DATA PLATFORM MARKET, BY VERTICAL, 2020–2024 (USD MILLION)
TABLE 381
BRAZIL: CUSTOMER DATA PLATFORM MARKET, BY VERTICAL, 2025–2030 (USD MILLION)
TABLE 382
MEXICO: CUSTOMER DATA PLATFORM MARKET, BY OFFERING, 2020–2024 (USD MILLION)
TABLE 383
MEXICO: CUSTOMER DATA PLATFORM MARKET, BY OFFERING, 2025–2030 (USD MILLION)
TABLE 384
ARGENTINA: CUSTOMER DATA PLATFORM MARKET, BY OFFERING, 2020–2024 (USD MILLION)
TABLE 385
ARGENTINA: CUSTOMER DATA PLATFORM MARKET, BY OFFERING, 2025–2030 (USD MILLION)
TABLE 386
REST OF LATIN AMERICA: CUSTOMER DATA PLATFORM MARKET, BY OFFERING, 2020–2024 (USD MILLION)
TABLE 387
REST OF LATIN AMERICA: CUSTOMER DATA PLATFORM MARKET, BY OFFERING, 2025–2030 (USD MILLION)
TABLE 388
OVERVIEW OF STRATEGIES ADOPTED BY KEY CUSTOMER DATA PLATFORM VENDORS, 2022–2025
TABLE 389
CUSTOMER DATA PLATFORM MARKET: DEGREE OF COMPETITION
TABLE 390
REGIONAL FOOTPRINT (25 COMPANIES), 2024
TABLE 391
PLATFORM TYPE FOOTPRINT (25 COMPANIES), 2024
TABLE 392
DATA TYPE FOOTPRINT (25 COMPANIES), 2024
TABLE 393
APPLICATION FOOTPRINT (25 COMPANIES), 2024
TABLE 394
CUSTOMER DATA PLATFORM MARKET: KEY STARTUPS/SMES, 2024
TABLE 395
CUSTOMER DATA PLATFORM MARKET: COMPETITIVE BENCHMARKING OF KEY STARTUPS/SMES
TABLE 396
CUSTOMER DATA PLATFORM MARKET: PRODUCT LAUNCHES AND ENHANCEMENTS, 2022–2025
TABLE 397
CUSTOMER DATA PLATFORM MARKET: DEALS, 2022–2025
TABLE 398
ORACLE: COMPANY OVERVIEW
TABLE 399
ORACLE: PRODUCTS/SOLUTIONS/SERVICES OFFERED
TABLE 400
ORACLE: PRODUCT LAUNCHES AND ENHANCEMENTS
TABLE 402
SAP: COMPANY OVERVIEW
TABLE 403
SAP: PRODUCTS/SOLUTIONS/SERVICES OFFERED
TABLE 404
SAP: PRODUCT LAUNCHES AND ENHANCEMENTS
TABLE 406
ADOBE: COMPANY OVERVIEW
TABLE 407
ADOBE: PRODUCTS/SOLUTIONS/SERVICES OFFERED
TABLE 408
ADOBE: PRODUCT LAUNCHES AND ENHANCEMENTS
TABLE 410
SALESFORCE: COMPANY OVERVIEW
TABLE 411
SALESFORCE: PRODUCTS/SOLUTIONS/SERVICES OFFERED
TABLE 412
SALESFORCE: PRODUCT LAUNCHES AND ENHANCEMENTS
TABLE 413
SALESFORCE: DEALS
TABLE 414
TWILIO: COMPANY OVERVIEW
TABLE 415
TWILIO: PRODUCTS/SOLUTIONS/SERVICES OFFERED
TABLE 416
TWILIO: PRODUCT LAUNCHES AND ENHANCEMENTS
TABLE 418
MICROSOFT: COMPANY OVERVIEW
TABLE 419
MICROSOFT: PRODUCTS/SOLUTIONS/SERVICES OFFERED
TABLE 420
MICROSOFT: PRODUCT LAUNCHES AND ENHANCEMENTS
TABLE 421
MICROSOFT: DEALS
TABLE 422
SAS INSTITUTE: COMPANY OVERVIEW
TABLE 423
SAS INSTITUTE: PRODUCTS/SOLUTIONS/SERVICES OFFERED
TABLE 424
SAS INSTITUTE: PRODUCT LAUNCHES AND ENHANCEMENTS
TABLE 425
SAS INSTITUTE: DEALS
TABLE 426
TERADATA: COMPANY OVERVIEW
TABLE 427
TERADATA: PRODUCTS/SOLUTIONS/SERVICES OFFERED
TABLE 428
TERADATA: PRODUCT LAUNCHES AND ENHANCEMENTS
TABLE 429
TERADATA: DEALS
TABLE 430
CLOUDERA: COMPANY OVERVIEW
TABLE 431
CLOUDERA: PRODUCTS/SOLUTIONS/SERVICES OFFERED
TABLE 432
CLOUDERA: PRODUCT LAUNCHES AND ENHANCEMENTS
TABLE 433
CLOUDERA: DEALS
TABLE 434
DUN & BRADSTREET: COMPANY OVERVIEW
TABLE 435
DUN & BRADSTREET: PRODUCTS/SOLUTIONS/SERVICES OFFERED
TABLE 436
DUN & BRADSTREET: PRODUCT LAUNCHES AND ENHANCEMENTS
TABLE 437
DUN & BRADSTREET: DEALS
TABLE 438
LEADSPACE: COMPANY OVERVIEW
TABLE 439
LEADSPACE: PRODUCTS/SOLUTIONS/SERVICES OFFERED
TABLE 440
LEADSPACE: PRODUCT LAUNCHES AND ENHANCEMENTS
TABLE 441
LEADSPACE: DEALS
TABLE 442
UPLAND SOFTWARE: COMPANY OVERVIEW
TABLE 443
UPLAND SOFTWARE: PRODUCTS/SOLUTIONS/SERVICES OFFERED
TABLE 444
UPLAND SOFTWARE: DEALS
TABLE 445
CALIBERMIND: COMPANY OVERVIEW
TABLE 446
CALIBERMIND: PRODUCTS/SOLUTIONS/SERVICES OFFERED
TABLE 447
CALIBERMIND: PRODUCT LAUNCHES AND ENHANCEMENTS
TABLE 448
TEALIUM: COMPANY OVERVIEW
TABLE 449
TEALIUM: PRODUCTS/SOLUTIONS/SERVICES OFFERED
TABLE 450
TEALIUM: PRODUCT LAUNCHES AND ENHANCEMENTS
TABLE 452
ACQUIA: COMPANY OVERVIEW
TABLE 453
ACQUIA: PRODUCTS/SOLUTIONS/SERVICES OFFERED
TABLE 454
ACQUIA: PRODUCT LAUNCHES AND ENHANCEMENTS
TABLE 456
BLUECONIC: COMPANY OVERVIEW
TABLE 457
BLUECONIC: PRODUCTS/SOLUTIONS/SERVICES OFFERED
TABLE 458
BLUECONIC: PRODUCT LAUNCHES AND ENHANCEMENTS
TABLE 459
BLUECONIC: DEALS
TABLE 460
LYTICS: COMPANY OVERVIEW
TABLE 461
LYTICS: PRODUCTS/SOLUTIONS/SERVICES OFFERED
TABLE 462
LYTICS: PRODUCT LAUNCHES AND ENHANCEMENTS
TABLE 464
ZETA GLOBAL: COMPANY OVERVIEW
TABLE 465
ZETA GLOBAL: PRODUCTS/SOLUTIONS/SERVICES OFFERED
TABLE 466
ZETA GLOBAL: PRODUCT LAUNCHES AND ENHANCEMENTS
TABLE 467
ZETA GLOBAL: DEALS
TABLE 468
AMPERITY: COMPANY OVERVIEW
TABLE 469
AMPERITY: PRODUCTS/SOLUTIONS/SERVICES OFFERED
TABLE 470
AMPERITY: PRODUCT LAUNCHES AND ENHANCEMENTS
TABLE 471
AMPERITY: DEALS
TABLE 472
CUSTOMER EXPERIENCE MANAGEMENT MARKET, BY OFFERING, 2017–2022 (USD MILLION)
TABLE 473
CUSTOMER EXPERIENCE MANAGEMENT MARKET, BY OFFERING, 2023–2028 (USD MILLION)
TABLE 474
CUSTOMER EXPERIENCE MANAGEMENT MARKET, BY DEPLOYMENT TYPE, 2017–2022 (USD MILLION)
TABLE 475
CUSTOMER EXPERIENCE MANAGEMENT MARKET, BY DEPLOYMENT TYPE, 2023–2028 (USD MILLION)
TABLE 476
CUSTOMER EXPERIENCE MANAGEMENT MARKET, BY ORGANIZATION SIZE, 2017–2022 (USD MILLION)
TABLE 477
CUSTOMER EXPERIENCE MANAGEMENT MARKET, BY ORGANIZATION SIZE, 2023–2028 (USD MILLION)
TABLE 478
CUSTOMER EXPERIENCE MANAGEMENT MARKET, BY VERTICAL, 2017–2022 (USD MILLION)
TABLE 479
CUSTOMER EXPERIENCE MANAGEMENT MARKET, BY VERTICAL, 2023–2028 (USD MILLION)
TABLE 480
CUSTOMER EXPERIENCE MANAGEMENT MARKET, BY REGION, 2017–2022 (USD MILLION)
TABLE 481
CUSTOMER EXPERIENCE MANAGEMENT MARKET, BY REGION, 2023–2028 (USD MILLION)
TABLE 482
CUSTOMER INTELLIGENCE PLATFORM MARKET, BY COMPONENT, 2018–2021 (USD MILLION)
TABLE 483
CUSTOMER INTELLIGENCE PLATFORM MARKET, BY COMPONENT, 2022–2027 (USD MILLION)
TABLE 484
CUSTOMER INTELLIGENCE PLATFORM MARKET, BY DEPLOYMENT MODE, 2018–2021 (USD MILLION)
TABLE 485
CUSTOMER INTELLIGENCE PLATFORM MARKET, BY DEPLOYMENT MODE, 2022–2027 (USD MILLION)
TABLE 486
CUSTOMER INTELLIGENCE PLATFORM MARKET, BY ORGANIZATION SIZE, 2018–2021 (USD MILLION)
TABLE 487
CUSTOMER INTELLIGENCE PLATFORM MARKET, BY ORGANIZATION SIZE, 2022–2027 (USD MILLION)
TABLE 488
CUSTOMER INTELLIGENCE PLATFORM MARKET, BY DATA CHANNEL, 2018–2021 (USD MILLION)
TABLE 489
CUSTOMER INTELLIGENCE PLATFORM MARKET, BY DATA CHANNEL, 2022–2027 (USD MILLION)
TABLE 490
CUSTOMER INTELLIGENCE PLATFORM MARKET, BY APPLICATION, 2018–2021 (USD MILLION)
TABLE 491
CUSTOMER INTELLIGENCE PLATFORM MARKET, BY APPLICATION, 2022–2027 (USD MILLION)
TABLE 492
CUSTOMER INTELLIGENCE PLATFORM MARKET, BY VERTICAL, 2018–2021 (USD MILLION)
TABLE 493
CUSTOMER INTELLIGENCE PLATFORM MARKET, BY VERTICAL, 2022–2027 (USD MILLION)
TABLE 494
CUSTOMER INTELLIGENCE PLATFORM MARKET, BY REGION, 2018–2021 (USD MILLION)
TABLE 495
CUSTOMER INTELLIGENCE PLATFORM MARKET, BY REGION, 2022–2027 (USD MILLION)
FIGURE 1
CUSTOMER DATA PLATFORM MARKET: RESEARCH DESIGN
FIGURE 2
CUSTOMER DATA PLATFORM MARKET: DATA TRIANGULATION
FIGURE 3
CUSTOMER DATA PLATFORM MARKET: TOP-DOWN AND BOTTOM-UP APPROACHES
FIGURE 4
MARKET SIZE ESTIMATION METHODOLOGY—APPROACH 1, BOTTOM-UP (SUPPLY-SIDE): REVENUE FROM PLATFORMS AND SERVICES IN CUSTOMER DATA PLATFORM MARKET
FIGURE 5
MARKET SIZE ESTIMATION METHODOLOGY—APPROACH 2, BOTTOM-UP (SUPPLY-SIDE): COLLECTIVE REVENUE FROM KEY COMPANIES IN CUSTOMER DATA PLATFORM MARKET
FIGURE 6
MARKET SIZE ESTIMATION METHODOLOGY—APPROACH 3, BOTTOM-UP (SUPPLY-SIDE): COLLECTIVE REVENUE FROM BUSINESS UNITS (BU) OF KEY VENDORS IN CUSTOMER DATA PLATFORM MARKET
FIGURE 7
MARKET SIZE ESTIMATION METHODOLOGY—APPROACH 4, BOTTOM-UP (DEMAND-SIDE): SHARE OF CUSTOMER DATA PLATFORM THROUGH OVERALL IT SPENDING ON CUSTOMER DATA PLATFORMS
FIGURE 8
PLATFORMS SEGMENT TO HOLD LARGEST MARKET SIZE IN 2025
FIGURE 9
CLOUD TO BE LEADING SEGMENT IN 2025
FIGURE 10
FIRST-PARTY DATA SEGMENT TO HOLD LARGEST MARKET SIZE IN 2025
FIGURE 11
PERSONALIZED RECOMMENDATIONS SEGMENT TO HOLD LARGEST MARKET IN 2025
FIGURE 12
TRAVEL & HOSPITALITY TO WITNESS FASTEST GROWTH IN DURING FORECAST PERIOD
FIGURE 13
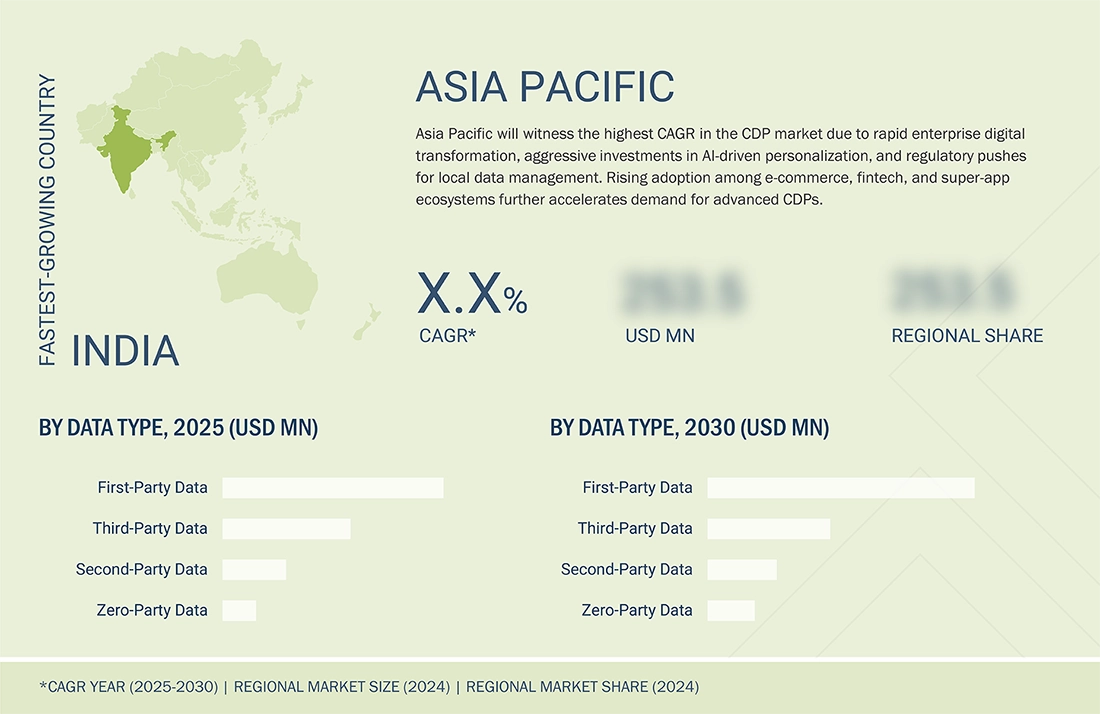
ASIA PACIFIC TO REGISTER FASTEST GROWTH BETWEEN 2025 AND 2030
FIGURE 14
ENTERPRISE INVESTMENTS IN CUSTOMER INTELLIGENCE, RISING DEMAND FOR PERSONALIZATION, AND STRONG FOCUS ON DATA GOVERNANCE TO DRIVE MARKET GROWTH
FIGURE 15
DATA ACTIVATION & REAL-TIME EXECUTION SEGMENT TO REGISTER HIGHEST GROWTH RATE DURING FORECAST PERIOD
FIGURE 16
CAMPAIGN CDP AND FIRST-PARTY DATA TO BE LARGEST SHAREHOLDERS IN NORTH AMERICAN CUSTOMER DATA PLATFORM MARKET IN 2025
FIGURE 17
NORTH AMERICA TO HOLD LARGEST MARKET SHARE IN 2025
FIGURE 18
DRIVERS, RESTRAINTS, OPPORTUNITIES, AND CHALLENGES: CUSTOMER DATA PLATFORM MARKET
FIGURE 19
CUSTOMER DATA PLATFORM MARKET EVOLUTION
FIGURE 20
CUSTOMER DATA PLATFORM FUNCTIONALITY
FIGURE 21
CUSTOMER DATA PLATFORM MARKET: SUPPLY CHAIN ANALYSIS
FIGURE 22
KEY PLAYERS IN CUSTOMER DATA PLATFORM MARKET ECOSYSTEM
FIGURE 23
CUSTOMER DATA PLATFORM MARKET: PORTER’S FIVE FORCES ANALYSIS
FIGURE 24
REVENUE SHIFT OF CUSTOMER DATA PLATFORM MARKET VENDORS
FIGURE 25
NUMBER OF PATENTS GRANTED IN LAST 10 YEARS, 2016–2025
FIGURE 26
REGIONAL ANALYSIS OF PATENTS GRANTED, 2016–2025
FIGURE 27
LEADING CUSTOMER DATA PLATFORM STARTUPS, BY FUNDING VALUE AND FUNDING ROUND, 2025
FIGURE 28
INFLUENCE OF STAKEHOLDERS ON BUYING PROCESS FOR TOP THREE VERTICALS
FIGURE 29
KEY BUYING CRITERIA FOR TOP THREE VERTICALS
FIGURE 30
SERVICES SEGMENT TO GROW AT HIGHER CAGR DURING FORECAST PERIOD
FIGURE 31
DELIVERY CDP TO GROW AT HIGHEST CAGR DURING FORECAST PERIOD
FIGURE 32
MANAGED SERVICES TO GROW AT HIGHER CAGR DURING FORECAST PERIOD
FIGURE 33
SYSTEM INTEGRATION & IMPLEMENTATION TO GROW AT HIGHEST CAGR DURING FORECAST PERIOD
FIGURE 34
CLOUD DEPLOYMENT MODE TO REGISTER HIGHER CAGR DURING FORECAST PERIOD
FIGURE 35
ZERO-PARTY DATA SEGMENT TO GROW AT HIGHEST CAGR DURING FORECAST PERIOD
FIGURE 36
SMS & MOBILE MESSAGING SEGMENT TO GROW AT HIGHEST CAGR DURING FORECAST PERIOD
FIGURE 37
DATA ACTIVATION & REAL-TIME EXECUTION SEGMENT TO GROW AT HIGHEST CAGR DURING FORECAST PERIOD
FIGURE 38
TRAVEL & HOSPITALITY SEGMENT TO GROW AT HIGHEST CAGR DURING FORECAST PERIOD
FIGURE 39
NORTH AMERICA TO BE LARGEST REGIONAL MARKET DURING FORECAST PERIOD
FIGURE 40
INDIA TO WITNESS FASTEST GROWTH DURING FORECAST PERIOD
FIGURE 41
NORTH AMERICA: CUSTOMER DATA PLATFORM MARKET SNAPSHOT
FIGURE 42
ASIA PACIFIC: CUSTOMER DATA PLATFORM MARKET SNAPSHOT
FIGURE 43
TOP FIVE PUBLIC PLAYERS IN CUSTOMER DATA PLATFORM MARKET, 2020–2024 (USD MILLION)
FIGURE 44
SHARE OF LEADING COMPANIES IN CUSTOMER DATA PLATFORM MARKET, 2024
FIGURE 45
PRODUCT COMPARATIVE ANALYSIS
FIGURE 46
FINANCIAL METRICS OF KEY VENDORS
FIGURE 47
YEAR-TO-DATE (YTD) PRICE TOTAL RETURN AND 5-YEAR STOCK BETA OF KEY VENDORS
FIGURE 48
CUSTOMER DATA PLATFORM MARKET: COMPANY EVALUATION MATRIX (KEY PLAYERS), 2024
FIGURE 49
COMPANY FOOTPRINT (25 COMPANIES), 2024
FIGURE 50
CUSTOMER DATA PLATFORM MARKET: COMPANY EVALUATION MATRIX (STARTUPS/SMES), 2024
FIGURE 51
ORACLE: COMPANY SNAPSHOT
FIGURE 52
SAP: COMPANY SNAPSHOT
FIGURE 53
ADOBE: COMPANY SNAPSHOT
FIGURE 54
SALESFORCE: COMPANY SNAPSHOT
FIGURE 55
TWILIO: COMPANY SNAPSHOT
FIGURE 56
MICROSOFT: COMPANY SNAPSHOT
FIGURE 57
TERADATA: COMPANY SNAPSHOT
FIGURE 58
DUN & BRADSTREET: COMPANY SNAPSHOT
FIGURE 59
UPLAND SOFTWARE: COMPANY SNAPSHOT
FIGURE 60
ZETA GLOBAL: COMPANY SNAPSHOT


 Exclusive indicates content/data unique to MarketsandMarkets and not available with any competitors.


Growth opportunities and latent adjacency in Customer Data Platform Market