Digital Asset Management Market by Component (Solutions and Services), Business Function (HR, Sales & Marketing, and IT), Deployment Type, Organization Size, Vertical, and Region - Global Forecast to 2027
Digital Asset Management Market Size, Global Industry Forecast
The global digital asset management market size is projected to reach USD 8.0 billion by 2027 from USD 4.2 billion in 2022, at a CAGR of 13.6% during the forecast period. DAM refers to both a business process and a form of information management technology, or a digital asset management system. DAM functionality helps several organizations create a centralized, well streamlined place where they can access their media assets. Enabling brand consistency through automatic asset updates and upgrades, reinforcing brand guidelines, providing a single source of truth within businesses, improving user experience for external audiences, reducing unnecessary production costs and duplicate workstreams associated with its invaluable search features are just a few of the major driving forces driving digital asset management growth.
To know about the assumptions considered for the study, Request for Free Sample Report
Digital Asset Management Market Growth Dynamics
Driver: Increased digitalization of content and requirement for collaboration of corporate digital assets
With dynamic consumer behavior, the number of digital assets and speed of digital asset enrichment is rising significantly across organizations. With such an overwhelming increase in digital asset volume, companies are increasingly migrating to the cloud for the storage of their digital assets. This has led to the entrance of new cloud-based DAM solution providers and compelled traditional on-premises DAM solution providers to innovate and upgrade their solutions for cloud platforms. The digital boom driven by the adoption of the internet, mobile phones, and technological innovations has led organizations to digitalize content both internally and externally for enhancing the experiences of customers, employees, distributors, and other entities across the supply chain.
Restraint: High upfront costs associated with implementation and integration
Although DAM solutions offer various benefits, the cost associated with initial implementation and lifetime license costs for managing digital assets cannot be ignored. The annual price of digital asset management software ranges from less than USD 350 to upwards through USD 250,000. Prices depend on a variety of factors, including number of users, amount of storage, advanced features, brand reputation, implementation fees, maintenance cost, customization, services, and other setup considerations, such as whether the system is cloud-based or managed on an on-premise server. Cumulatively, those functional differences can add up to create a hefty range of prices. Some organizations have specific security requirements that may increase the complexity, and hence the cost of a system.
Opportunity: Infusion of advanced encryption methodologies to streamline digital trading
With the increase in digital trading using cryptocurrencies, the need to securely store token keys of cryptocurrencies is becoming an imminent need among fintech companies. As theft of token keys can cause hefty losses to individuals and the banking industry, the DAM companies are innovating their solutions to facilitate secure storage, alteration, and retrieval of private keys for secure online trading. In such cases, DAM systems are being innovated to certify the authenticity of information that requires costly third-party certificates. Blockchain-enabled DAM would provide built-in data integrity and confidence in authorship without the additional overhead of third-party verification and expand the DAM usage in core banking systems to ensure the safekeeping of private keys.
Challenge: Fulfilling metadata requirements for enabling quick access to digitally stored assets
Metadata is critical to any DAM system, as it helps DAM users to quickly locate and retrieve the assets they seek. Although, when it comes to using publicly available digital assets, such as images, text, and other digital content, the lack of metadata may cause companies to be subjected to copyright infringement lawsuits. In addition, excess of metadata may cause DAM systems to slow down when it comes to the discovery or navigation of digital assets. DAM solution allows enterprises to add metadata that involves product details, expiration date, usage rights, permissions, other information of each asset file. It ensures the teams can access only those assets for which they hold the access rights. Thus, there is nearly zero possibility for unauthenticated usage of any critical brand assets. To avoid slowing down of the process(es), companies need to assess that they have digital assets containing plenty of metadata to make their DAM systems work. This involves lots of manual work and professional skills. Many DAM companies also provide consulting, integration, and implementation services to assist their customers in their DAM implementation journey. To enable ease in digital assets search, DAM allows users to define taxonomy (grouping while maintaining a logical structure), categories, and metadata. Moreover, considering the advantages of DAM systems and the assistance being provided by the DAM providers, such challenges are short-lived.
Digital Asset Management Market Supply Chain
To know about the assumptions considered for the study, download the pdf brochure
Based on the deployment model, cloud segment to grow at a higher CAGR during the forecast period
Cloud-based DAM solutions enable organizations to lessen the cost pertaining to IT infrastructure, software, storage, and technical staff and help streamline DAM operations. Several benefits of the cloud solutions include 24x7 data accessibility, rapid implementation, reduced setup and operational cost, i.e., Capital Expenditure (CAPEX) and Operating Expense (OPEX), less maintenance cost, higher scalability, and ease-of-use for an organization with limited IT staff and budget. Replacing conventional on-premises methodology with cloud technology and practice has provided ample support and innovative implementation of DAM solutions and service provision. Major players that offer cloud solutions include Adobe, OpenText, Aprimo, Bynder, Cognizant, among others.
Based on business function, IT segment to showcase progressive growth during the forecast period
The popularity of content management Application Programming Interfaces (APIs) among developers and IT teams makes DAM an appropriate solution for enabling the creation of software designs. This helps them save time getting approval from higher management before initiating the design and development processes and facilitates effective collaboration with other departments. In collaboration with other departments, file tagging and referencing ensure non-duplicacy of media assets, such as logos, fonts, and photos across the organization’s digital asset repository. The developers' inevitable need for mapping images and videos and their variants to the applications in the development phase/pipeline drive the demand for DAM solution among developers, thus IT.
Based on vertical, Retail and e-commerce segment to grow at the highest CAGR among verticals during the forecast period
Companies across this industry vertical are adopting different penetration strategies and leveraging various industry-ready technologies to enhance customer experience, acquire new customer base and improve customer retention. Due to large number of players in this vertical, the IT budgets are usually huge as retail and eCommerce companies try to maintain a certain brand image, which is key to higher revenues. Many retailers and eCommerce companies leverage DAM solutions to facilitate internal collaboration and sharing digital assets and content. With the help of DAM solution, the management of digital assets in compliance with brand guidelines also helps ensure the easy presentation of organization’s goals, strategies, and product portfolio across online channels.
Asia Pacific to grow at the highest CAGR during the forecast period
Asia Pacific is expected to experience extensive growth opportunities due to higher consumer spending and internet penetration and the rising adoption of advanced technologies, such as automated digital solutions, AI, ML, and cloud. DAM solutions automate the curation of digital assets and e-content, enabling companies to distribute content across channels. Many organizations in the Asia Pacific are implementing DAM platforms to improve customer engagement and experience and attract new customers. Furthermore, wastage of resources due to manual management, enrichment of digital assets and content, lack of visibility into digital repositories, rising product launches with changing consumer demands, and increasing siloed systems have extensively given rise to asset and content duplicacy. These factors further compel organizations in this region to invest in the advanced DAM solutions. DAM offers various advanced features, including permission controls, the right management, and asset performance analytics to improve customer relations and increase end-user productivity, and these are crucial for enterprises operating in this region to incorporate and benefit from its usability. The implementation of regulatory framework by regional governments in Asia Pacific has prompted organizations to adopt DAM as well. Such solutions offer controlled access to authorized users and provision advanced security of digital assets to avoid copyright issues, which propels the market growth. Additionally, the advent of 5G networks and the large-scale integration of AI, ML, and the internet of things (IoT) supplement the market growth. Furthermore, the extensive utilization of DAM systems on e-commerce platforms to collect, store, catalog, and share digital content are expanding the market growth in the region a great deal.
Digital Asset Management Market - Key Players
Market players profiled in this report include Adobe (US), OpenText (Canada), Cognizant (US), Aprimo (US), Bynder (US), Sitecore (US), Widen (US), MediaBeacon (US), CELUM (Austria), Nuxeo (US), Canto (US), Wedia (France), Digizuite (Denmark), censhare (Germany), Cloudinary (US), MediaValet (Canada), Northplains (Canada), BrandMaker (Germany), Brandfolder (US), Bright (UK), MarcomCentral (US), Extensis (US), IntelligenceBank (Australia), Filecamp (Switzerland), Veeva (US), WoodWing (Netherlands), Pimcore (Austria), PhotoShelter (US), Image Relay (US), and Kontainer (Denmark). These players offer various DAM solutions to cater to the demands and needs of the market. Major growth strategies adopted by the players include product enhancements and partnerships.
Get online access to the report on the World's First Market Intelligence Cloud
- Easy to Download Historical Data & Forecast Numbers
- Company Analysis Dashboard for high growth potential opportunities
- Research Analyst Access for customization & queries
- Competitor Analysis with Interactive dashboard
- Latest News, Updates & Trend analysis
Request Sample Scope of the Report
Get online access to the report on the World's First Market Intelligence Cloud
- Easy to Download Historical Data & Forecast Numbers
- Company Analysis Dashboard for high growth potential opportunities
- Research Analyst Access for customization & queries
- Competitor Analysis with Interactive dashboard
- Latest News, Updates & Trend analysis
Report Metrics |
Details |
Market size value in 2022 |
USD 4.2 Billion |
Market size value for 2027 |
USD 8.0 Billion |
Growth rate |
CAGR of 13.6% |
Market size available for years |
2018–2027 |
Base year considered |
2021 |
Forecast period |
2022–2027 |
Forecast units |
Value (USD Billion) |
Segments covered |
Component, Business Function, Organization Size, Deployment Type, Vertical, and Region |
Digital Asset Management Market Drivers |
|
Digital Asset Management Market Opportunities |
|
Geographies covered |
North America, Europe, Asia Pacific, Middle East and Africa, and Latin America |
Companies covered |
Adobe (US), OpenText (Canada), Cognizant (US), Aprimo (US), Bynder (US), Sitecore (US), Widen (US), MediaBeacon (US), CELUM (Austria), Nuxeo (US), Canto (US), Wedia (France), Digizuite (Denmark), censhare (Germany), Cloudinary (US), MediaValet (Canada), Northplains (Canada), BrandMaker (Germany), Brandfolder (US), Bright (UK), MarcomCentral (US), Extensis (US), IntelligenceBank (Australia), Filecamp (Switzerland), Veeva (US), WoodWing (Netherlands), Pimcore (Austria), PhotoShelter (US), Image Relay (US), and Kontainer (Denmark). |
The research report categorizes the digital asset management market to forecast revenues and analyze trends in each of the following submarkets:
Digital Asset Management Market By Component:
- Solution
-
Services
- Consulting
- Integration and Implementation
- Training, Support, and Maintenance
Digital Asset Management Market By Business Function:
- Human Resource (HR)
- Sales and Marketing
- Information Technology (IT)
- Others (Website Management and Creative Operations)
By Organization Size:
- Large Enterprises
- Small and Medium-sized Enterprises (SMEs)
By Deployment Type:
- On-premises
- Cloud
By Vertical:
- Retail and eCommerce
- BFSI
- Manufacturing
- IT and Telecom
- Media and Entertainment
- Government and Public Sector
- Travel and Hospitality
- Healthcare
- Others (Education, Real Estate and Construction, and Energy and Utilities)
By region:
-
North America
- US
- Canada
-
Europe
- UK
- Rest of Europe
-
APAC
- China
- Rest of APAC
-
MEA
- Kingdom of Saudi Arabia (KSA)
- Rest of MEA
-
Latin America
- Brazil
- Rest of Latin America
Recent Developments
- In November 2021, OpenText announced the release of DAM Media management 21.4. From the 21.4 releases, the Media Widget is built into both OpenText TeamSite and OpenText Exstream as the default integration with Media Management. Company’s Solution consultants also thrive using the Media Widget to connect to all sorts of applications used by our customers. Hence, customers could use them in design applications such as Web CMS.
- In May 2021, Bynder launched the SAP Commerce Cloud Connector to enable brands to deliver relevant and timely product media to power engaging and personalized e-commerce experiences. The connector between Bynder’s DAM and SAP Cloud Commerce allows marketers to make on-brand, approved web and product assets—in the right size and format, available for use without leaving SAP Commerce Cloud.
- In May 2021, Widen launched sweeping upgrades to its combined DAM and PIM (Performance Information Management) solution. Widen’s combined DAM and PIM solution is designed for omnichannel brands that sell physical goods. Widen developed this technology because marketing teams often struggle to bring products to market efficiently when the required product data, marketing content, and digital assets are siloed in multiple systems and files. The manual steps required to aggregate, categorize, and publish that information on e-commerce sites were too time-consuming and hazardous with potential for errors and inconsistencies.
Frequently Asked Questions (FAQ):
What is the projected market value of the global Digital Asset Management market?
The global Digital Asset Management market size is expected to grow at a Compound Annual Growth Rate (CAGR) of 13.6% during the forecast period, to reach USD 8.0 billion by 2027 from USD 4.2 billion in 2022.
Which region has the highest market share in the Digital Asset Management market?
North America region has the highest market share in the Digital Asset Management market. Factors, such as strong economic landscape, early adoption of advanced technologies, high digital adoption at workplaces to improve business processes, and presence of a huge number of DAM solution providers drives the demand for DAM solutions in North America.
Which submarkets is expected to witness high adoption in the coming years?
The demand for Digital Asset Management is high from sales and marketing business function. Increasing need to optimize the effectiveness of sales and marketing campaigns and simplify the management of marketing and sales-associated digital assets and collaterals drive the demand for DAM solutions among sales and marketing teams.
Who are the major vendors in the Digital Asset Management market?
Despite the presence of a large number of vendors, the market is dominated mainly by vendors such as Adobe (US), OpenText (Canada), Cognizant (US), Aprimo (US), Bynder (US), Sitecore (US), Widen (US), MediaBeacon (US), CELUM (Austria), and Nuxeo (US).
What are some of the latest trends that will shape the Digital Asset Management market in the future?
The emergence of AI to automate processes, data intregrity and infusion of advanced encryption technologies to streamline digital trading are expected to create ample opportunities for Digital Asset Management vendors. .
To speak to our analyst for a discussion on the above findings, click Speak to Analyst
TABLE OF CONTENTS
1 INTRODUCTION (Page No. - 25)
1.1 INTRODUCTION TO COVID-19
1.2 COVID-19 HEALTH ASSESSMENT
FIGURE 1 COVID-19: THE GLOBAL PROPAGATION
FIGURE 2 COVID-19 PROPAGATION: SELECT COUNTRIES
1.3 COVID-19 ECONOMIC ASSESSMENT
FIGURE 3 REVISED GDP FORECASTS FOR SELECT G20 COUNTRIES IN 2020
1.3.1 COVID-19 ECONOMIC IMPACT—SCENARIO ASSESSMENT
FIGURE 4 CRITERIA IMPACTING THE GLOBAL ECONOMY
FIGURE 5 SCENARIOS IN TERMS OF RECOVERY OF THE GLOBAL ECONOMY
1.4 OBJECTIVES OF THE STUDY
1.5 MARKET DEFINITION
1.5.1 INCLUSIONS AND EXCLUSIONS
1.6 MARKET SCOPE
1.6.1 MARKET SEGMENTATION
1.6.2 REGIONS COVERED
1.6.3 YEARS CONSIDERED FOR THE STUDY
1.7 CURRENCY CONSIDERED
TABLE 1 UNITED STATES DOLLAR EXCHANGE RATE, 2018–2021
1.8 STAKEHOLDERS
1.9 SUMMARY OF CHANGES
2 RESEARCH METHODOLOGY (Page No. - 36)
2.1 RESEARCH DATA
FIGURE 6 DIGITAL ASSET MANAGEMENT MARKET: RESEARCH DESIGN
2.1.1 SECONDARY DATA
2.1.2 PRIMARY DATA
2.1.2.1 Breakup of primaries
2.1.2.2 Primary respondents
TABLE 2 PRIMARY RESPONDENTS: MARKET
2.1.2.3 Key industry insights
2.2 MARKET BREAKUP AND DATA TRIANGULATION
FIGURE 7 MARKET: DATA TRIANGULATION
2.3 MARKET SIZE ESTIMATION
FIGURE 8 DIGITAL ASSET MANAGEMENT MARKET: TOP-DOWN AND BOTTOM-UP APPROACH
2.3.1 SUPPLY SIDE APPROACH
FIGURE 9 MARKET SIZE ESTIMATION METHODOLOGY – APPROACH 1 (SUPPLY-SIDE): REVENUE OF DAM FROM VENDORS
FIGURE 10 SUPPLY SIDE MARKET SIZE ESTIMATION: REVENUE OF VENDORS OFFERING DIGITAL ASSET MANAGEMENT SOLUTION AND SERVICES
FIGURE 11 MARKET SIZE ESTIMATION METHODOLOGY: BOTTOM–UP APPROACH (SUPPLY SIDE): COLLECTIVE REVENUE OF DAM VENDORS
FIGURE 12 MARKET SIZE ESTIMATION METHODOLOGY – (SUPPLY SIDE): ILLUSTRATION OF VENDOR REVENUE ESTIMATION
2.3.2 DEMAND-SIDE APPROACH
FIGURE 13 MARKET SIZE ESTIMATION METHODOLOGY ? APPROACH 2 (DEMAND SIDE): REVENUE OF VENDORS FROM BUSINESS FUNCTIONS
FIGURE 14 MARKET PROJECTIONS FROM DEMAND SIDE
2.4 COMPANY EVALUATION MATRIX RESEARCH METHODOLOGY
FIGURE 15 DIGITAL ASSET MANAGEMENT COMPANY EVALUATION MATRIX: CRITERIA WEIGHTAGE
2.5 MARKET FORECAST
TABLE 3 FACTOR ANALYSIS
2.6 RESEARCH ASSUMPTIONS
TABLE 4 ASSUMPTIONS FOR THE STUDY
2.7 LIMITATIONS OF THE STUDY
3 EXECUTIVE SUMMARY (Page No. - 51)
FIGURE 16 DIGITAL ASSET MANAGEMENT MARKET: GLOBAL SNAPSHOT
FIGURE 17 LARGEST-GROWING SEGMENTS OF MARKET
FIGURE 18 SOLUTION SEGMENT TO ACCOUNT FOR THE LARGEST MARKET SIZE DURING THE FORECAST PERIOD
FIGURE 19 HR BUSINESS FUNCTION SEGMENT TO HOLD THE LARGEST MARKET SIZE DURING THE FORECAST PERIOD
FIGURE 20 ON-PREMISE DEPLOYMENT TYPE SEGMENT TO HOLD THE LARGEST MARKET SIZE DURING THE FORECAST PERIOD
FIGURE 21 LARGE ENTERPRISES SEGMENT TO ACCOUNT FOR A LARGER MARKET SIZE DURING THE FORECAST PERIOD
FIGURE 22 MEDIA AND ENTERTAINMENT VERTICAL TO HOLD THE LARGEST MARKET SIZE DURING THE FORECAST PERIOD
FIGURE 23 MARKET: REGIONAL SNAPSHOT
4 PREMIUM INSIGHTS (Page No. - 57)
4.1 ATTRACTIVE MARKET OPPORTUNITIES IN THE DIGITAL ASSET MANAGEMENT MARKET
FIGURE 24 DEMAND FOR EFFECTIVE COLLABORATION OF CORPORATE ASSETS AND THE NEED FOR ENHANCING CONSUMER EXPERIENCES TO DRIVE THE GROWTH OF THE MARKET
4.2 MARKET, BY COMPONENT, 2022 VS 2027
FIGURE 25 SOLUTIONS SEGMENT TO HOLD A LARGER MARKET SHARE IN 2022
4.3 MARKET, BY BUSINESS FUNCTION, 2022 VS 2027
FIGURE 26 HR SEGMENT TO HOLD THE LARGEST MARKET SHARE IN 2022
4.4 MARKET, BY DEPLOYMENT TYPE, 2022 VS 2027
FIGURE 27 ON-PREMISES SEGMENT TO HOLD A LARGER MARKET SHARE IN 2022
4.5 MARKET, BY ORGANIZATION SIZE, 2022 VS 2027
FIGURE 28 LARGE ENTERPRISES SEGMENT TO HOLD A LARGER MARKET SHARE IN 2022
4.6 MARKET, BY VERTICAL, 2022 VS 2027
FIGURE 29 MEDIA AND ENTERTAINMENT VERTICAL TO HOLD THE LARGEST MARKET SHARE IN 2022
4.7 MARKET REGIONAL SCENARIO, 2022–2027
FIGURE 30 ASIA PACIFIC TO EMERGE AS BEST MARKET FOR INVESTMENTS IN NEXT FIVE YEARS
FIGURE 31 DIGITAL ASSET MANAGEMENT MARKET IN CANADA TO GROW AT THE HIGHEST RATE DURING FORECAST PERIOD
5 MARKET OVERVIEW AND INDUSTRY TRENDS (Page No. - 62)
5.1 INTRODUCTION
5.2 MARKET DYNAMICS
FIGURE 32 DRIVERS, RESTRAINTS, OPPORTUNITIES, AND CHALLENGES: MARKET
5.2.1 DRIVERS
5.2.1.1 Increasing digitalization of content and need for effective collaboration of corporate assets
5.2.1.2 Emergence of cloud-based delivery options
5.2.1.3 Growing need for controlled access and better security of digital assets to avoid copyright issues
5.2.2 RESTRAINTS
5.2.2.1 High upfront costs associated with implementation and integration
5.2.3 OPPORTUNITIES
5.2.3.1 Emergence of AI to automate processes
5.2.3.2 Infusion of advanced encryption technologies to streamline digital trading
5.2.4 CHALLENGES
5.2.4.1 Fulfilling metadata requirements for enabling quick access to digitally stored assets
5.3 COVID-19-DRIVEN MARKET DYNAMICS
5.3.1 DRIVERS AND OPPORTUNITIES
5.3.2 RESTRAINTS AND CHALLENGES
5.4 SUPPLY CHAIN ANALYSIS
FIGURE 33 DIGITAL ASSET MANAGEMENT MARKET: SUPPLY CHAIN
5.5 ECOSYSTEM
TABLE 5 MARKET: ECOSYSTEM
5.6 PRICING ANALYSIS
TABLE 6 MARKET: PRICING LEVELS
5.6.1 AVERAGE SELLING PRICES OF KEY PLAYERS BY APPLICATION
FIGURE 34 AVERAGE SELLING PRICES OF KEY PLAYERS, BY APPLICATIONS
TABLE 7 AVERAGE SELLING PRICES OF KEY PLAYERS FOR TOP THREE APPLICATIONS (USD)
5.6.2 AVERAGE SELLING PRICE TREND
5.7 REGULATORY LANDSCAPE
5.7.1 REGULATORY BODIES, GOVERNMENT AGENCIES, AND OTHER ORGANIZATIONS
TABLE 8 NORTH AMERICA: LIST OF REGULATORY BODIES, GOVERNMENT AGENCIES, AND OTHER ORGANIZATIONS
TABLE 9 EUROPE: LIST OF REGULATORY BODIES, GOVERNMENT AGENCIES, AND OTHER ORGANIZATIONS
TABLE 10 ASIA-PACIFIC: LIST OF REGULATORY BODIES, GOVERNMENT AGENCIES AND OTHER ORGANIZATIONS
TABLE 11 REST OF WORLD: LIST OF REGULATORY BODIES, GOVERNMENT AGENCIES AND OTHER ORGANIZATIONS
5.7.2 REGULATORY IMPLICATIONS AND INDUSTRY STANDARDS
5.7.2.1 General data protection regulation (GDPR)
5.7.2.2 International Organization for Standardization (ISO) 9001 Quality Management
5.7.2.3 International Organization for Standardization (ISO)/International Electrotechnical Commission (IEC) 27000 Standards
5.7.2.4 Content management interoperability services (CMIS)
5.7.2.5 Health Insurance Portability and Accountability Act (HIPAA)
5.8 TECHNOLOGY ANALYSIS
5.8.1 ARTIFICIAL INTELLIGENCE
5.8.2 BLOCKCHAIN TECHNOLOGY
5.8.3 AUGMENTED AND VIRTUAL REALITY
5.9 PATENT ANALYSIS
FIGURE 35 NUMBER OF PATENTS PUBLISHED, 2011–2021
FIGURE 36 TOP FIVE PATENT OWNERS (GLOBAL)
TABLE 12 TOP TEN PATENT OWNERS (UNITED STATES)
TABLE 13 DIGITAL ASSET MANAGEMENT MARKET - PATENTS GRANTED TO DAM VENDORS
5.10 CASE STUDY ANALYSIS
5.10.1 CASE STUDY 1: ELIMINATING MANUAL DIGITAL ASSET MANAGEMENT TASKS FOR IMPROVED ASSET DISCOVERY, REDUCED DUPLICATION, AND FASTER TIME TO MARKET
5.10.2 CASE STUDY 2: SIMPLIFYING DIGITAL ASSET UPDATE AND APPROVAL FOR ACHIEVING CONTROLLED BRANDING ACROSS CHANNELS
5.10.3 CASE STUDY 3: ACHIEVING ASSET CENTRALIZATION AND CONSISTENT BRAND COMPLIANCE ACROSS GEOGRAPHIES TO IMPROVE MARKETING PERFORMANCE
5.10.4 CASE STUDY 4: ACCELERATING ACCESS TO MULTIMEDIA USING DIGITAL ASSET MANAGEMENT FOR SAP SOLUTIONS FOR HIGH VOLUME VIDEO PRODUCTION
5.10.5 CASE STUDY 5: BREAKING DOWN SILOS THEREBY INCREASING PRODUCTIVITY
5.10.6 CASE STUDY 6: SPEEDING UP CONTENT MANAGEMENT WITH PERSONALIZATION AT SCALE
5.11 PORTER’S FIVE FORCES MODEL
FIGURE 37 DIGITAL ASSET MANAGEMENT: PORTER’S FIVE FORCES ANALYSIS
TABLE 14 DIGITAL ASSET MANAGEMENT MARKET: PORTER’S FIVE FORCES ANALYSIS
5.11.1 DEGREE OF COMPETITION
5.11.2 BARGAINING POWER OF SUPPLIERS
5.11.3 BARGAINING POWER OF BUYERS
5.11.4 THREAT OF NEW ENTRANTS
5.11.5 THREAT OF SUBSTITUTES
5.12 KEY STAKEHOLDERS & BUYING CRITERIA
5.12.1 KEY STAKEHOLDERS IN BUYING PROCESS
FIGURE 38 INFLUENCE OF STAKEHOLDERS IN BUYING PROCESS FOR TOP BUSINESS FUNCTIONS
TABLE 15 INFLUENCE OF STAKEHOLDERS IN BUYING PROCESS FOR TOP BUSINESS FUNCTIONS (%)
5.12.2 BUYING CRITERIA
FIGURE 39 KEY BUYING CRITERIA FOR TOP THREE APPLICATIONS
TABLE 16 KEY BUYING CRITERIA FOR TOP THREE APPLICATIONS
5.13 KEY CONFERENCES AND EVENTS IN 2022-2023
TABLE 17 DIGITAL ASSET MANAGEMENT MARKET: DETAILED LIST OF CONFERENCES AND EVENTS
5.14 TRENDS/DISRUPTIONS IMPACTING BUYERS
FIGURE 40 MARKET: TRENDS/DISRUPTIONS IMPACTING BUYERS
6 DIGITAL ASSET MANAGEMENT MARKET, BY COMPONENT (Page No. - 94)
6.1 INTRODUCTION
6.1.1 COMPONENT: COVID-19 IMPACT ON THE MARKET
FIGURE 41 SERVICES SEGMENT TO GROW AT A HIGHER CAGR DURING THE FORECAST PERIOD
TABLE 18 MARKET SIZE, BY COMPONENT, 2018–2021 (USD MILLION)
TABLE 19 MARKET SIZE, BY COMPONENT, 2022–2027 (USD MILLION)
6.2 SOLUTION
6.2.1 SOLUTION: MARKET DRIVERS
TABLE 20 SOLUTION: MARKET SIZE, BY REGION, 2018–2021 (USD MILLION)
TABLE 21 SOLUTION: MARKET SIZE, BY REGION, 2022–2027 (USD MILLION)
6.3 SERVICES
TABLE 22 SERVICES: MARKET SIZE, BY REGION, 2018–2021 (USD MILLION)
TABLE 23 SERVICES: MARKET SIZE, BY REGION, 2022–2027 (USD MILLION)
6.3.1 CONSULTING
6.3.2 INTEGRATION AND IMPLEMENTATION
6.3.3 TRAINING, SUPPORT, AND MAINTENANCE
7 DIGITAL ASSET MANAGEMENT MARKET, BY BUSINESS FUNCTION (Page No. - 100)
7.1 INTRODUCTION
7.1.1 BUSINESS FUNCTION: COVID-19 IMPACT ON THE MARKET
FIGURE 42 SALES AND MARKETING SEGMENT TO GROW AT THE HIGHEST CAGR DURING THE FORECAST PERIOD
TABLE 24 MARKET SIZE, BY BUSINESS FUNCTION, 2018–2021 (USD MILLION)
TABLE 25 MARKET SIZE, BY BUSINESS FUNCTION, 2022–2027 (USD MILLION)
7.2 HUMAN RESOURCES
7.2.1 HUMAN RESOURCES: MARKET DRIVERS
TABLE 26 HUMAN RESOURCES: MARKET SIZE, BY REGION, 2018–2021 (USD MILLION)
TABLE 27 HUMAN RESOURCES: MARKET SIZE, BY REGION, 2022–2027 (USD MILLION)
7.3 SALES AND MARKETING
7.3.1 SALES AND MARKETING: MARKET DRIVER
TABLE 28 SALES AND MARKETING: MARKET SIZE, BY REGION, 2018–2021 (USD MILLION)
TABLE 29 SALES AND MARKETING: MARKET SIZE, BY REGION, 2022–2027 (USD MILLION)
7.4 INFORMATION TECHNOLOGY
7.4.1 INFORMATION TECHNOLOGY: DIGITAL ASSET MANAGEMENT MARKET DRIVER
TABLE 30 INFORMATION TECHNOLOGY: MARKET SIZE, BY REGION, 2018–2021 (USD MILLION)
TABLE 31 INFORMATION TECHNOLOGY: MARKET SIZE, BY REGION, 2022–2027 (USD MILLION)
7.5 OTHER BUSINESS FUNCTIONS
TABLE 32 OTHER BUSINESS FUNCTIONS: MARKET SIZE, BY REGION, 2018–2021 (USD MILLION)
TABLE 33 OTHER BUSINESS FUNCTIONS: MARKET SIZE, BY REGION, 2022–2027 (USD MILLION)
8 DIGITAL ASSET MANAGEMENT MARKET, BY ORGANIZATION SIZE (Page No. - 107)
8.1 INTRODUCTION
8.1.1 ORGANIZATION SIZE: COVID-19 IMPACT ON THE MARKET
FIGURE 43 SMALL AND MEDIUM-SIZED ENTERPRISES SEGMENT TO GROW AT A HIGHER CAGR DURING THE FORECAST PERIOD
TABLE 34 MARKET SIZE, BY ORGANIZATION SIZE, 2018–2021 (USD MILLION)
TABLE 35 MARKET SIZE, BY ORGANIZATION SIZE, 2022–2027 (USD MILLION)
8.2 LARGE ENTERPRISES
8.2.1 LARGE ENTERPRISES: MARKET DRIVER
TABLE 36 LARGE ENTERPRISES: MARKET SIZE, BY REGION, 2018–2021 (USD MILLION)
TABLE 37 LARGE ENTERPRISES: MARKET SIZE, BY REGION, 2022–2027 (USD MILLION)
TABLE 38 LARGE ENTERPRISES: NORTH AMERICA MARKET SIZE, BY COUNTRY, 2018–2021 (USD MILLION)
TABLE 39 LARGE ENTERPRISES: NORTH AMERICA MARKET SIZE, BY COUNTRY, 2022–2027 (USD MILLION)
8.3 SMALL AND MEDIUM-SIZED ENTERPRISES
8.3.1 SMALL AND MEDIUM-SIZED ENTERPRISES: DIGITAL ASSET MANAGEMENT MARKET DRIVER
TABLE 40 SMALL AND MEDIUM-SIZED ENTERPRISES: MARKET SIZE, BY REGION, 2018–2021 (USD MILLION)
TABLE 41 SMALL AND MEDIUM-SIZED ENTERPRISES: MARKET SIZE, BY REGION, 2022–2027 (USD MILLION)
TABLE 42 SMALL AND MEDIUM-SIZED ENTERPRISES: NORTH AMERICA MARKET SIZE, BY COUNTRY, 2018–2021 (USD MILLION)
TABLE 43 SMALL AND MEDIUM-SIZED ENTERPRISES: NORTH AMERICA MARKET SIZE, BY COUNTRY, 2022–2027 (USD MILLION)
9 DIGITAL ASSET MANAGEMENT MARKET, BY DEPLOYMENT TYPE (Page No. - 113)
9.1 INTRODUCTION
9.1.1 DEPLOYMENT TYPE: COVID-19 IMPACT ON THE MARKET
FIGURE 44 CLOUD SEGMENT TO GROW AT A HIGHER CAGR DURING THE FORECAST PERIOD
TABLE 44 MARKET SIZE, BY DEPLOYMENT TYPE, 2018–2021 (USD MILLION)
TABLE 45 MARKET SIZE, BY DEPLOYMENT TYPE, 2022–2027 (USD MILLION)
9.2 ON-PREMISES
9.2.1 ON-PREMISES: MARKET DRIVERS
TABLE 46 ON-PREMISES: MARKET SIZE, BY REGION, 2018–2021 (USD MILLION)
TABLE 47 ON-PREMISES: MARKET SIZE, BY REGION, 2022–2027 (USD MILLION)
TABLE 48 ON-PREMISES: NORTH AMERICA MARKET SIZE, BY COUNTRY, 2018–2021 (USD MILLION)
TABLE 49 ON-PREMISES: NORTH AMERICA MARKET SIZE, BY COUNTRY, 2022–2027 (USD MILLION)
9.3 CLOUD
9.3.1 CLOUD: MARKET DRIVERS
TABLE 50 CLOUD: MARKET SIZE, BY REGION, 2018–2021 (USD MILLION)
TABLE 51 CLOUD: MARKET SIZE, BY REGION, 2022–2027 (USD MILLION)
TABLE 52 CLOUD: NORTH AMERICA MARKET SIZE, BY COUNTRY, 2018–2021 (USD MILLION)
TABLE 53 CLOUD: NORTH AMERICA MARKET SIZE, BY COUNTRY, 2022–2027 (USD MILLION)
10 DIGITAL ASSET MANAGEMENT MARKET, BY VERTICAL (Page No. - 119)
10.1 INTRODUCTION
10.1.1 VERTICAL: COVID-19 IMPACT ON THE MARKET
FIGURE 45 RETAIL AND ECOMMERCE SEGMENT TO GROW AT THE HIGHEST CAGR DURING THE FORECAST PERIOD
TABLE 54 MARKET SIZE, BY VERTICAL, 2018–2021 (USD MILLION)
TABLE 55 MARKET SIZE, BY VERTICAL, 2022–2027 (USD MILLION)
10.2 RETAIL AND ECOMMERCE
10.2.1 RETAIL AND ECOMMERCE: MARKET DRIVERS
TABLE 56 RETAIL AND ECOMMERCE: MARKET SIZE, BY REGION, 2018–2021 (USD MILLION)
TABLE 57 RETAIL AND ECOMMERCE: MARKET SIZE, BY REGION, 2022–2027 (USD MILLION)
10.3 BANKING, FINANCIAL SERVICES, AND INSURANCE
10.3.1 BANKING, FINANCIAL SERVICES, AND INSURANCE: MARKET DRIVER
TABLE 58 BANKING, FINANCIAL SERVICES, AND INSURANCE: MARKET SIZE, BY REGION, 2018–2021 (USD MILLION)
TABLE 59 BANKING, FINANCIAL SERVICES, AND INSURANCE: MARKET SIZE, BY REGION, 2022–2027 (USD MILLION)
10.4 MANUFACTURING
10.4.1 MANUFACTURING: DIGITAL ASSET MANAGEMENT MARKET DRIVERS
TABLE 60 MANUFACTURING: MARKET SIZE, BY REGION, 2018–2021 (USD MILLION)
TABLE 61 MANUFACTURING: MARKET SIZE, BY REGION, 2022–2027 (USD MILLION)
10.5 INFORMATION TECHNOLOGY AND TELECOM
10.5.1 IT AND TELECOM: MARKET DRIVERS
TABLE 62 IT AND TELECOM: MARKET SIZE, BY REGION, 2018–2021 (USD MILLION)
TABLE 63 IT AND TELECOM: MARKET SIZE, BY REGION, 2022–2027 (USD MILLION)
10.6 MEDIA AND ENTERTAINMENT
10.6.1 MEDIA AND ENTERTAINMENT: MARKET DRIVER
TABLE 64 MEDIA AND ENTERTAINMENT: MARKET SIZE, BY REGION, 2018–2021 (USD MILLION)
TABLE 65 MEDIA AND ENTERTAINMENT: MARKET SIZE, BY REGION, 2022–2027 (USD MILLION)
10.7 GOVERNMENT AND PUBLIC SECTOR
10.7.1 GOVERNMENT AND PUBLIC SECTOR: MARKET DRIVERS
TABLE 66 GOVERNMENT AND PUBLIC SECTOR: MARKET SIZE, BY REGION, 2018–2021 (USD MILLION)
TABLE 67 GOVERNMENT AND PUBLIC SECTOR: MARKET SIZE, BY REGION, 2022–2027 (USD MILLION)
10.8 TRAVEL AND HOSPITALITY
10.8.1 TRAVEL AND HOSPITALITY: DIGITAL ASSET MANAGEMENT MARKET DRIVERS
TABLE 68 TRAVEL AND HOSPITALITY: MARKET SIZE, BY REGION, 2018–2021 (USD MILLION)
TABLE 69 TRAVEL AND HOSPITALITY: MARKET SIZE, BY REGION, 2022–2027 (USD MILLION)
10.9 HEALTHCARE
10.9.1 HEALTHCARE: MARKET DRIVERS
TABLE 70 HEALTHCARE: MARKET SIZE, BY REGION, 2018–2021 (USD MILLION)
TABLE 71 HEALTHCARE: MARKET SIZE, BY REGION, 2022–2027 (USD MILLION)
10.10 OTHER VERTICALS
TABLE 72 OTHER VERTICALS: MARKET SIZE, BY REGION, 2018–2021 (USD MILLION)
TABLE 73 OTHER VERTICALS: MARKET SIZE, BY REGION, 2022–2027 (USD MILLION)
11 DIGITAL ASSET MANAGEMENT MARKET, BY REGION (Page No. - 132)
11.1 INTRODUCTION
FIGURE 46 ASIA PACIFIC TO GROW AT THE HIGHEST GROWTH RATE DURING THE FORECAST PERIOD
TABLE 74 MARKET SIZE, BY REGION, 2018–2021 (USD MILLION)
TABLE 75 MARKET SIZE, BY REGION, 2022–2027 (USD MILLION)
11.2 NORTH AMERICA
11.2.1 NORTH AMERICA: COVID-19 IMPACT
11.2.2 NORTH AMERICA: MARKET DRIVERS
11.2.3 NORTH AMERICA: REGULATIONS
FIGURE 47 NORTH AMERICA: MARKET SNAPSHOT
TABLE 76 NORTH AMERICA: DIGITAL ASSET MANAGEMENT MARKET SIZE, BY COMPONENT, 2018–2021 (USD MILLION)
TABLE 77 NORTH AMERICA: MARKET SIZE, BY COMPONENT, 2022–2027 (USD MILLION)
TABLE 78 NORTH AMERICA: MARKET SIZE, BY BUSINESS FUNCTION, 2018–2021 (USD MILLION)
TABLE 79 NORTH AMERICA: MARKET SIZE, BY BUSINESS FUNCTION, 2022–2027 (USD MILLION)
TABLE 80 NORTH AMERICA: MARKET SIZE, BY ORGANIZATION SIZE, 2018–2021 (USD MILLION)
TABLE 81 NORTH AMERICA: MARKET SIZE, BY ORGANIZATION SIZE, 2022–2027 (USD MILLION)
TABLE 82 NORTH AMERICA: MARKET SIZE, BY DEPLOYMENT TYPE, 2018–2021 (USD MILLION)
TABLE 83 NORTH AMERICA: MARKET SIZE, BY DEPLOYMENT TYPE, 2022–2027 (USD MILLION)
TABLE 84 NORTH AMERICA: MARKET SIZE, BY VERTICAL, 2018–2021 (USD MILLION)
TABLE 85 NORTH AMERICA: MARKET SIZE, BY VERTICAL, 2022–2027 (USD MILLION)
TABLE 86 NORTH AMERICA: MARKET SIZE, BY COUNTRY, 2018–2021 (USD MILLION)
TABLE 87 NORTH AMERICA: MARKET SIZE, BY COUNTRY, 2022–2027 (USD MILLION)
FIGURE 48 NORTH AMERICA: COUNTRY ANALYSIS, 2022
11.2.4 UNITED STATES
TABLE 88 UNITED STATES: DIGITAL ASSET MANAGEMENT MARKET SIZE, BY ORGANIZATION SIZE, 2018–2021 (USD MILLION)
TABLE 89 UNITED STATES: MARKET SIZE, BY ORGANIZATION SIZE, 2022–2027 (USD MILLION)
TABLE 90 UNITED STATES: MARKET SIZE, BY DEPLOYMENT TYPE, 2018–2021 (USD MILLION)
TABLE 91 UNITED STATES: MARKET SIZE, BY DEPLOYMENT TYPE, 2022–2027 (USD MILLION)
11.2.5 CANADA
TABLE 92 CANADA: MARKET SIZE, BY ORGANIZATION SIZE, 2018–2021 (USD MILLION)
TABLE 93 CANADA: MARKET SIZE, BY ORGANIZATION SIZE, 2022–2027 (USD MILLION)
TABLE 94 CANADA: MARKET SIZE, BY DEPLOYMENT TYPE, 2018–2021 (USD MILLION)
TABLE 95 CANADA: MARKET SIZE, BY DEPLOYMENT TYPE, 2022–2027 (USD MILLION)
11.3 EUROPE
11.3.1 EUROPE: COVID-19 IMPACT
11.3.2 EUROPE: DIGITAL ASSET MANAGEMENT MARKET DRIVERS
11.3.3 EUROPE: REGULATIONS
TABLE 96 EUROPE: MARKET SIZE, BY COMPONENT, 2018–2021 (USD MILLION)
TABLE 97 EUROPE: MARKET SIZE, BY COMPONENT, 2022–2027 (USD MILLION)
TABLE 98 EUROPE: MARKET SIZE, BY BUSINESS FUNCTION, 2018–2021 (USD MILLION)
TABLE 99 EUROPE: MARKET SIZE, BY BUSINESS FUNCTION, 2022–2027 (USD MILLION)
TABLE 100 EUROPE: MARKET SIZE, BY ORGANIZATION SIZE, 2018–2021 (USD MILLION)
TABLE 101 EUROPE: MARKET SIZE, BY ORGANIZATION SIZE, 2022–2027 (USD MILLION)
TABLE 102 EUROPE: MARKET SIZE, BY DEPLOYMENT TYPE, 2018–2021 (USD MILLION)
TABLE 103 EUROPE: MARKET SIZE, BY DEPLOYMENT TYPE, 2022–2027 (USD MILLION)
TABLE 104 EUROPE: MARKET SIZE, BY VERTICAL, 2018–2021 (USD MILLION)
TABLE 105 EUROPE: MARKET SIZE, BY VERTICAL, 2022–2027 (USD MILLION)
TABLE 106 EUROPE: MARKET SIZE, BY COUNTRY, 2018–2021 (USD MILLION)
TABLE 107 EUROPE: MARKET SIZE, BY COUNTRY, 2022–2027 (USD MILLION)
FIGURE 49 EUROPE: COUNTRY ANALYSIS, 2022
11.3.4 UNITED KINGDOM
TABLE 108 UNITED KINGDOM: DIGITAL ASSET MANAGEMENT MARKET SIZE, BY ORGANIZATION SIZE, 2018–2021 (USD MILLION)
TABLE 109 UNITED KINGDOM: MARKET SIZE, BY ORGANIZATION SIZE, 2022–2027 (USD MILLION)
TABLE 110 UNITED KINGDOM: MARKET SIZE, BY DEPLOYMENT TYPE, 2018–2021 (USD MILLION)
TABLE 111 UNITED KINGDOM: MARKET SIZE, BY DEPLOYMENT TYPE, 2022–2027 (USD MILLION)
11.3.5 REST OF EUROPE
TABLE 112 REST OF EUROPE: MARKET SIZE, BY ORGANIZATION SIZE, 2018–2021 (USD MILLION)
TABLE 113 REST OF EUROPE: MARKET SIZE, BY ORGANIZATION SIZE, 2022–2027 (USD MILLION)
TABLE 114 REST OF EUROPE: MARKET SIZE, BY DEPLOYMENT TYPE, 2018–2021 (USD MILLION)
TABLE 115 REST OF EUROPE: MARKET SIZE, BY DEPLOYMENT TYPE, 2022–2027 (USD MILLION)
11.4 ASIA PACIFIC
11.4.1 ASIA PACIFIC: COVID-19 IMPACT
11.4.2 ASIA PACIFIC: DIGITAL ASSET MANAGEMENT MARKET DRIVERS
11.4.3 REGULATIONS
FIGURE 50 ASIA PACIFIC: REGIONAL SNAPSHOT
TABLE 116 ASIA PACIFIC: MARKET SIZE, BY COMPONENT, 2018–2021 (USD MILLION)
TABLE 117 ASIA PACIFIC: MARKET SIZE, BY COMPONENT, 2022–2027 (USD MILLION)
TABLE 118 ASIA PACIFIC: MARKET SIZE, BY BUSINESS FUNCTION, 2018–2021 (USD MILLION)
TABLE 119 ASIA PACIFIC: MARKET SIZE, BY BUSINESS FUNCTION, 2022–2027 (USD MILLION)
TABLE 120 ASIA PACIFIC: MARKET SIZE, BY ORGANIZATION SIZE, 2018–2021 (USD MILLION)
TABLE 121 ASIA PACIFIC: MARKET SIZE, BY ORGANIZATION SIZE, 2022–2027 (USD MILLION)
TABLE 122 ASIA PACIFIC: MARKET SIZE, BY DEPLOYMENT TYPE, 2018–2021 (USD MILLION)
TABLE 123 ASIA PACIFIC: MARKET SIZE, BY DEPLOYMENT TYPE, 2022–2027 (USD MILLION)
TABLE 124 ASIA PACIFIC: MARKET SIZE, BY VERTICAL, 2018–2021 (USD MILLION)
TABLE 125 ASIA PACIFIC: MARKET SIZE, BY VERTICAL, 2022–2027 (USD MILLION)
TABLE 126 ASIA PACIFIC: MARKET SIZE, BY COUNTRY, 2018–2021 (USD MILLION)
TABLE 127 ASIA PACIFIC: MARKET SIZE, BY COUNTRY, 2022–2027 (USD MILLION)
11.4.4 CHINA
TABLE 128 CHINA: DIGITAL ASSET MANAGEMENT MARKET SIZE, BY ORGANIZATION SIZE, 2018–2021 (USD MILLION)
TABLE 129 CHINA: MARKET SIZE, BY ORGANIZATION SIZE, 2022–2027 (USD MILLION)
TABLE 130 CHINA: MARKET SIZE, BY DEPLOYMENT TYPE, 2018–2021 (USD MILLION)
TABLE 131 CHINA: MARKET SIZE, BY DEPLOYMENT TYPE, 2022–2027 (USD MILLION)
11.4.5 REST OF ASIA PACIFIC
TABLE 132 REST OF ASIA PACIFIC: MARKET SIZE, BY ORGANIZATION SIZE, 2018–2021 (USD MILLION)
TABLE 133 REST OF ASIA PACIFIC: MARKET SIZE, BY ORGANIZATION SIZE, 2022–2027 (USD MILLION)
TABLE 134 REST OF ASIA PACIFIC: MARKET SIZE, BY DEPLOYMENT TYPE, 2018–2021 (USD MILLION)
TABLE 135 REST OF ASIA PACIFIC: MARKET SIZE, BY DEPLOYMENT TYPE, 2022–2027 (USD MILLION)
11.5 MIDDLE EAST AND AFRICA
11.5.1 MIDDLE EAST AND AFRICA: COVID-19 IMPACT
11.5.2 MIDDLE EAST AND AFRICA: DIGITAL ASSET MANAGEMENT MARKET DRIVERS
11.5.3 REGULATIONS
TABLE 136 MIDDLE EAST AND AFRICA: MARKET SIZE, BY COMPONENT, 2018–2021 (USD MILLION)
TABLE 137 MIDDLE EAST AND AFRICA: MARKET SIZE, BY COMPONENT, 2022–2027 (USD MILLION)
TABLE 138 MIDDLE EAST AND AFRICA: MARKET SIZE, BY BUSINESS FUNCTION, 2018–2021 (USD MILLION)
TABLE 139 MIDDLE EAST AND AFRICA: MARKET SIZE, BY BUSINESS FUNCTION, 2022–2027 (USD MILLION)
TABLE 140 MIDDLE EAST AND AFRICA: MARKET SIZE, BY ORGANIZATION SIZE, 2018–2021 (USD MILLION)
TABLE 141 MIDDLE EAST AND AFRICA: MARKET SIZE, BY ORGANIZATION SIZE, 2022–2027 (USD MILLION)
TABLE 142 MIDDLE EAST AND AFRICA: MARKET SIZE, BY DEPLOYMENT TYPE, 2018–2021 (USD MILLION)
TABLE 143 MIDDLE EAST AND AFRICA: MARKET SIZE, BY DEPLOYMENT TYPE, 2022–2027 (USD MILLION)
TABLE 144 MIDDLE EAST AND AFRICA: MARKET SIZE, BY VERTICAL, 2018–2021 (USD MILLION)
TABLE 145 MIDDLE EAST AND AFRICA: MARKET SIZE, BY VERTICAL, 2022–2027 (USD MILLION)
TABLE 146 MIDDLE EAST AND AFRICA: MARKET SIZE, BY COUNTRY, 2018–2021 (USD MILLION)
TABLE 147 MIDDLE EAST AND AFRICA: MARKET SIZE, BY COUNTRY, 2022–2027 (USD MILLION)
11.5.4 KINGDOM OF SAUDI ARABIA
TABLE 148 KINGDOM OF SAUDI ARABIA: DIGITAL ASSET MANAGEMENT MARKET SIZE, BY ORGANIZATION SIZE, 2018–2021 (USD MILLION)
TABLE 149 KINGDOM OF SAUDI ARABIA: MARKET SIZE, BY ORGANIZATION SIZE, 2022–2027 (USD MILLION)
TABLE 150 KINGDOM OF SAUDI ARABIA: MARKET SIZE, BY DEPLOYMENT TYPE, 2018–2021 (USD MILLION)
TABLE 151 KINGDOM OF SAUDI ARABIA: MARKET SIZE, BY DEPLOYMENT TYPE, 2022–2027 (USD MILLION)
11.5.5 REST OF MIDDLE EAST AND AFRICA
TABLE 152 REST OF MIDDLE EAST AND AFRICA: MARKET SIZE, BY ORGANIZATION SIZE, 2018–2021 (USD MILLION)
TABLE 153 REST OF MIDDLE EAST AND AFRICA: MARKET SIZE, BY ORGANIZATION SIZE, 2022–2027 (USD MILLION)
TABLE 154 REST OF MIDDLE EAST AND AFRICA: MARKET SIZE, BY DEPLOYMENT TYPE, 2018–2021 (USD MILLION)
TABLE 155 REST OF MIDDLE EAST AND AFRICA: MARKET SIZE, BY DEPLOYMENT TYPE, 2022–2027 (USD MILLION)
11.6 LATIN AMERICA
11.6.1 LATIN AMERICA: COVID-19 IMPACT
11.6.2 LATIN AMERICA: DIGITAL ASSET MANAGEMENT MARKET DRIVERS
11.6.3 REGULATIONS
TABLE 156 LATIN AMERICA: MARKET SIZE, BY COMPONENT, 2018–2021 (USD MILLION)
TABLE 157 LATIN AMERICA: MARKET SIZE, BY COMPONENT, 2022–2027 (USD MILLION)
TABLE 158 LATIN AMERICA: MARKET SIZE, BY BUSINESS FUNCTION, 2018–2021 (USD MILLION)
TABLE 159 LATIN AMERICA: MARKET SIZE, BY BUSINESS FUNCTION, 2022–2027 (USD MILLION)
TABLE 160 LATIN AMERICA: MARKET SIZE, BY ORGANIZATION SIZE, 2018–2021 (USD MILLION)
TABLE 161 LATIN AMERICA: MARKET SIZE, BY ORGANIZATION SIZE, 2022–2027 (USD MILLION)
TABLE 162 LATIN AMERICA: MARKET SIZE, BY DEPLOYMENT TYPE, 2018–2021 (USD MILLION)
TABLE 163 LATIN AMERICA: MARKET SIZE, BY DEPLOYMENT TYPE, 2022–2027 (USD MILLION)
TABLE 164 LATIN AMERICA: MARKET SIZE, BY VERTICAL, 2018–2021 (USD MILLION)
TABLE 165 LATIN AMERICA: MARKET SIZE, BY VERTICAL, 2022–2027 (USD MILLION)
TABLE 166 LATIN AMERICA: MARKET SIZE, BY COUNTRY, 2018–2021 (USD MILLION)
TABLE 167 LATIN AMERICA: MARKET SIZE, BY COUNTRY, 2022–2027 (USD MILLION)
11.6.4 BRAZIL
TABLE 168 BRAZIL: DIGITAL ASSET MANAGEMENT MARKET SIZE, BY ORGANIZATION SIZE, 2018–2021 (USD MILLION)
TABLE 169 BRAZIL: MARKET SIZE, BY ORGANIZATION SIZE, 2022–2027 (USD MILLION)
TABLE 170 BRAZIL: MARKET SIZE, BY DEPLOYMENT TYPE, 2018–2021 (USD MILLION)
TABLE 171 BRAZIL: MARKET SIZE, BY DEPLOYMENT TYPE, 2022–2027 (USD MILLION)
11.6.5 REST OF LATIN AMERICA
TABLE 172 REST OF LATIN AMERICA: MARKET SIZE, BY ORGANIZATION SIZE, 2018–2021 (USD MILLION)
TABLE 173 REST OF LATIN AMERICA: MARKET SIZE, BY ORGANIZATION SIZE, 2022–2027 (USD MILLION)
TABLE 174 REST OF LATIN AMERICA: MARKET SIZE, BY DEPLOYMENT TYPE, 2018–2021 (USD MILLION)
TABLE 175 REST OF LATIN AMERICA: MARKET SIZE, BY DEPLOYMENT TYPE, 2022–2027 (USD MILLION)
12 COMPETITIVE LANDSCAPE (Page No. - 176)
12.1 OVERVIEW
12.2 MARKET EVALUATION FRAMEWORK
FIGURE 51 MARKET EVALUATION FRAMEWORK
12.3 MARKET SHARE OF TOP PLAYERS
FIGURE 52 MARKET SHARE OF MAJOR PLAYERS IN THE DIGITAL ASSET MANAGEMENT MARKET, 2021
12.4 REVENUE ANALYSIS OF TOP PLAYERS
FIGURE 53 TOP FIVE PLAYERS TO HAVE DOMINATED THE MARKET IN THE LAST FOUR YEARS
12.5 COMPANY EVALUATION QUADRANT
12.5.1 MATRIX DEFINITIONS AND METHODOLOGY
TABLE 176 COMPANY EVALUATION MATRIX: CRITERIA
12.5.2 STARS
12.5.3 EMERGING LEADERS
12.5.4 PERVASIVE
12.5.5 PARTICIPANTS
TABLE 177 GLOBAL COMPANY FOOTPRINT
TABLE 178 COMPANY SOFTWARE FOOTPRINT
TABLE 179 COMPANY VERTICAL FOOTPRINT (1/2)
TABLE 180 COMPANY VERTICAL FOOTPRINT (2/2)
TABLE 181 COMPANY REGION FOOTPRINT
FIGURE 54 DIGITAL ASSET MANAGEMENT MARKET (GLOBAL): COMPANY EVALUATION QUADRANT, 2021
12.6 STARTUP/SME EVALUATION QUADRANT
12.6.1 DEFINITIONS AND METHODOLOGY
TABLE 182 STARTUP/SME COMPANY EVALUATION MATRIX: CRITERIA
12.6.2 PROGRESSIVE COMPANIES
12.6.3 RESPONSIVE COMPANIES
12.6.4 DYNAMIC COMPANIES
12.6.5 STARTING BLOCKS
FIGURE 55 DIGITAL ASSET MANAGEMENT (STARTUP/SME): COMPANY EVALUATION QUADRANT, 2021
12.7 COMPETITIVE BENCHMARKING
TABLE 183 DIGITAL ASSET MANAGEMENT MARKET: DETAILED LIST OF KEY STARTUPS/SMES
TABLE 184 MARKET: COMPETITIVE BENCHMARKING OF KEY PLAYERS [STARTUPS/SMES]
12.8 COMPETITIVE SCENARIO
12.8.1 PRODUCT LAUNCHES AND ENHANCEMENTS
TABLE 185 PRODUCT LAUNCHES AND ENHANCEMENTS, 2019-2021
12.8.2 ACQUISITIONS
TABLE 186 ACQUISITIONS, 2019–2021
12.8.3 PARTNERSHIPS, AGREEMENTS, AND COLLABORATIONS
TABLE 187 PARTNERSHIPS, AGREEMENTS, AND COLLABORATIONS, 2019-2021
13 COMPANY PROFILES (Page No. - 192)
13.1 INTRODUCTION
13.2 KEY COMPANIES
(Business Overview, Products, Solutions & Services, Recent Developments, MnM View)*
13.2.1 ADOBE
TABLE 188 ADOBE: BUSINESS OVERVIEW
FIGURE 56 ADOBE: COMPANY SNAPSHOT
TABLE 189 ADOBE: SOLUTIONS OFFERED
TABLE 190 ADOBE: PRODUCT LAUNCHES AND ENHANCEMENTS
13.2.2 OPENTEXT
TABLE 191 OPENTEXT: BUSINESS OVERVIEW
FIGURE 57 OPENTEXT: COMPANY SNAPSHOT
TABLE 192 OPENTEXT: SOLUTIONS OFFERED
TABLE 193 OPENTEXT: PRODUCT LAUNCHES AND ENHANCEMENTS
13.2.3 COGNIZANT
TABLE 194 COGNIZANT: BUSINESS OVERVIEW
FIGURE 58 COGNIZANT: COMPANY SNAPSHOT
TABLE 195 COGNIZANT: SOLUTIONS OFFERED
13.2.4 APRIMO
TABLE 196 APRIMO: BUSINESS OVERVIEW
TABLE 197 APRIMO: SOLUTIONS OFFERED
TABLE 198 APRIMO: PRODUCT LAUNCHES AND ENHANCEMENTS
TABLE 199 APRIMO: DEALS
13.2.5 BYNDER
TABLE 200 BYNDER: BUSINESS OVERVIEW
TABLE 201 BYNDER: SOLUTIONS OFFERED
TABLE 202 BYNDER: PRODUCT LAUNCHES AND ENHANCEMENTS
TABLE 203 BYNDER: DEALS
13.2.6 SITECORE
TABLE 204 SITECORE: BUSINESS OVERVIEW
TABLE 205 SITECORE: SOLUTIONS OFFERED
TABLE 206 SITECORE: PRODUCT LAUNCHES AND ENHANCEMENTS
TABLE 207 SITECORE: DEALS
13.2.7 WIDEN
TABLE 208 WIDEN: BUSINESS OVERVIEW
TABLE 209 WIDEN: SOLUTIONS OFFERED
TABLE 210 WIDEN: PRODUCT LAUNCHES AND ENHANCEMENTS
TABLE 211 WIDEN: DEALS
13.2.8 MEDIABEACON
TABLE 212 MEDIABEACON: BUSINESS OVERVIEW
TABLE 213 MEDIABEACON: SOLUTIONS OFFERED
TABLE 214 MEDIABEACON: PRODUCT LAUNCHES AND ENHANCEMENTS
TABLE 215 MEDIABEACON: DEALS
13.2.9 CELUM
TABLE 216 CELUM: BUSINESS OVERVIEW
TABLE 217 CELUM: SOLUTIONS OFFERED
TABLE 218 CELUM: PRODUCT LAUNCHES AND ENHANCEMENTS
13.2.10 NUXEO (HYLAND)
TABLE 219 NUXEO: BUSINESS OVERVIEW
TABLE 220 NUXEO: SOLUTIONS OFFERED
TABLE 221 NUXEO: PRODUCT LAUNCHES AND ENHANCEMENTS
TABLE 222 NUXEO: DEALS
*Details on Business Overview, Products, Solutions & Services, Recent Developments, MnM View might not be captured in case of unlisted companies.
13.3 SMES AND STARTUPS
13.3.1 CANTO
13.3.2 WEDIA
13.3.3 DIGIZUITE
13.3.4 CENSHARE
13.3.5 CLOUDINARY
13.3.6 MEDIAVALET
13.3.7 NORTHPLAINS
13.3.8 BRANDMAKER
13.3.9 BRANDFOLDER
13.3.10 BRIGHT
13.3.11 MARCOMCENTRAL
13.3.12 EXTENSIS
13.3.13 INTELLIGENCEBANK
13.3.14 FILECAMP
13.3.15 VEEVA SYSTEMS
13.3.16 WOODWING
13.3.17 PIMCORE
13.3.18 PHOTOSHELTER
13.3.19 IMAGE RELAY
13.3.20 KONTAINER
14 ADJACENT MARKET (Page No. - 239)
14.1 INTRODUCTION
14.1.1 RELATED MARKETS
TABLE 223 RELATED MARKETS
14.2 LIMITATIONS
14.3 ENTERPRISE CONTENT MANAGEMENT MARKET
14.3.1 INTRODUCTION
TABLE 224 ENTERPRISE ASSET MANAGEMENT MARKET SIZE, BY COMPONENT, 2016–2019 (USD MILLION)
TABLE 225 ENTERPRISE ASSET MANAGEMENT MARKET SIZE, BY COMPONENT, 2020–2026 (USD MILLION)
14.3.2 SOLUTIONS
TABLE 226 SOLUTIONS: ENTERPRISE ASSET MANAGEMENT MARKET SIZE, BY REGION, 2016–2019 (USD MILLION)
TABLE 227 SOLUTIONS: ENTERPRISE ASSET MANAGEMENT MARKET SIZE, BY REGION, 2020–2026 (USD MILLION)
14.3.3 SERVICES
TABLE 228 SERVICES: ENTERPRISE ASSET MANAGEMENT MARKET SIZE, BY REGION, 2016–2019 (USD MILLION)
TABLE 229 SERVICES: ENTERPRISE ASSET MANAGEMENT MARKET SIZE, BY REGION, 2020–2026 (USD MILLION)
14.3.4 VERTICALS
TABLE 230 ENTERPRISE ASSET MANAGEMENT MARKET SIZE, BY VERTICAL, 2016–2019 (USD MILLION)
TABLE 231 ENTERPRISE ASSET MANAGEMENT MARKET SIZE, BY VERTICAL, 2020–2026 (USD MILLION)
15 APPENDIX (Page No. - 245)
15.1 DISCUSSION GUIDE
15.2 KNOWLEDGE STORE: MARKETSANDMARKETS’ SUBSCRIPTION PORTAL
15.3 AVAILABLE CUSTOMIZATIONS
15.4 RELATED REPORTS
15.5 AUTHOR DETAILS
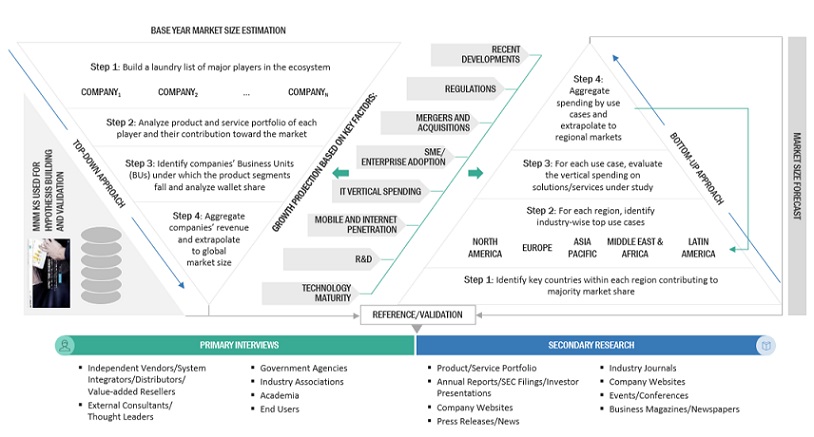
The study involved four major activities in estimating the current size of the Digital Asset Management market. Exhaustive secondary research was done to collect information on the market. The next step was to validate these findings, assumptions, and sizing with industry experts across the value chain using primary research. Both top-down and bottom-up approaches were employed to estimate the complete market size. Thereafter, the market breakup and data triangulation procedures were used to estimate the market size of the segments and subsegments of the Digital Asset Management market.
Secondary Research
In the secondary research process, various secondary sources, such as D&B Hoovers, Bloomberg BusinessWeek, and Factiva, have been referred to, to identify and collect information for this study. These secondary sources included annual reports, press releases and investor presentations of companies, whitepapers, and articles by recognized authors, industry standard organizations and associations, such as Content Marketing Institute (CMI), Association for Information and Image Management (AIIM), DAM Federation, and Multichain Asset Managers Association (MAMA).
Primary Research
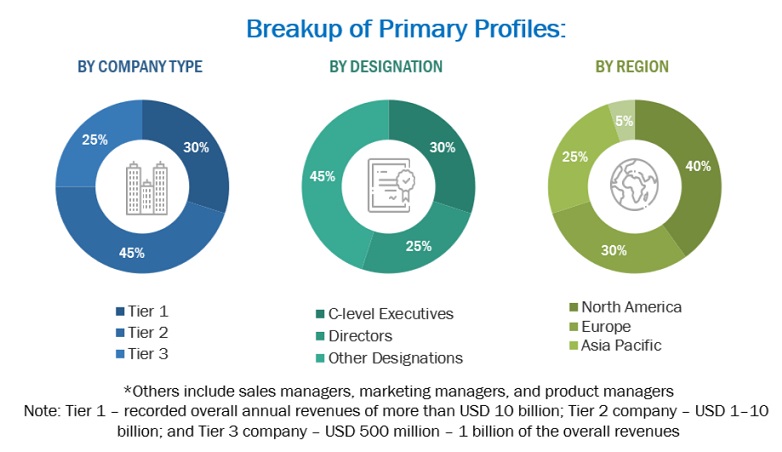
The digital asset management market comprises several stakeholders, such as DAM providers, Cloud Service Providers (CSP), System Integrators (SIs), professional service providers, resellers and distributors, government and research organizations, enterprise users, venture capitalists, private equity firms, and startup companies. The demand side of the digital asset management market consists of organizations from different verticals, such as Banking, Financial Services, and Insurance (BFSI), manufacturing, Information Technology (IT) and telecom, media and entertainment, government and public sector, travel and hospitality, healthcare, and others (education, real estate and construction, and energy and utilities). The supply-side includes DAM providers, offering DAM solution and services. Various primary sources from both the supply and demand sides of the market were interviewed to obtain qualitative and quantitative information. Following is the breakup of the primary respondents:
To know about the assumptions considered for the study, download the pdf brochure
Digital Asset Management Market Size Estimation
Both top-down and bottom-up approaches were used to estimate and validate the total size of the digital asset management market. The methods were also used extensively to estimate the size of various segments in the market. The research methodology used to estimate the market size includes the following:
- Key players in the market have been identified through extensive secondary research.
- The industry’s supply chain and market size, in terms of value, have been determined through primary and secondary research processes.
- All percentage shares, splits, and breakups have been determined using secondary sources and verified through primary sources.
Data Triangulation
After arriving at the overall market size using the market size estimation processes as explained above, the market was split into several segments and subsegments. To complete the overall market engineering process and arrive at the exact statistics of each market segment and subsegment, data triangulation, and market breakup procedures were employed, wherever applicable. The data was triangulated by studying various factors and trends from both the demand and supply sides.
Report Objectives
- To describe and forecast the digital asset management market based on components (solution and services), business functions, deployment types, organization size, verticals, and regions
- To forecast the market size of five main regions: North America, Europe, Asia Pacific (APAC), Middle East and Africa (MEA), and Latin America
- To analyze subsegments with respect to individual growth trends, prospects, and contributions to the total market
- To provide detailed information about the major factors (drivers, restraints, opportunities, and challenges) influencing the growth of the market
- To analyze the opportunities in the market for stakeholders and provide details of the competitive landscape of the major players
- To assess the impact of COVID-19 on the digital asset management market
- To comprehensively analyze the core competencies of the key players in the market
- To track and analyze the competitive developments, such as new product/solution launches and enhancements; business expansions; acquisitions; and partnerships, contracts, and collaborations, in the market
Available Customizations
With the given market data, MarketsandMarkets offers customizations as per the company’s specific needs. The following customization options are available for the report:
Company Information
- Detailed analysis and profiling of additional market players (up to 5)
Growth opportunities and latent adjacency in Digital Asset Management Market