
Web Content Management (WCM) Market

Web Content Management (WCM) Market by Product Type (Content Management (AI image generation, AI voice generation), Digital Asset Management, Content Marketing, Website Development), Architecture (Coupled, Decoupled, Hybrid) - Global Forecast to 2029


OVERVIEW
Source: Secondary Research, Interviews with Experts, MarketsandMarkets Analysis
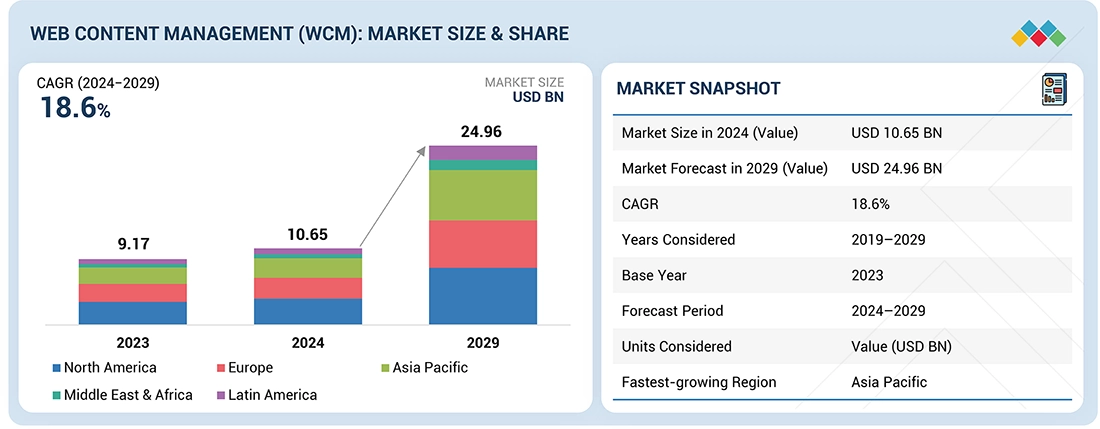
The Web Content Management (WCM) market is projected to grow from USD 10.65 billion in 2024 to USD 24.97 billion by 2029, at a CAGR of 18.6%. This growth is driven by enterprise demand for AI-powered personalization, cloud-native agility, and composable digital experience platforms (DXPs), fueled by the shift to cloud-native and headless CMS for scalability and omnichannel delivery, adoption of AI-driven content automation for faster creation, tagging, and personalization, and demand for SEO-optimized platforms that enhance search visibility and performance. Strategic trends include the rise of composable architectures enabling modular, API-first deployments, integration of generative AI and low-code/no-code workflows for marketing agility, and emphasis on digital asset governance, real-time analytics, and CDP integration.
Market Size and Forecast:
- Market Size in 2023: USD 9.17 Billion
- 2024 Market Size: USD 10.65 Billion
- 2029 Forecasted Market Size: USD 24.97 Billion
- Growth Rate (2024-2029): CAGR of 18.6%
- Forecast period: 2024–2029
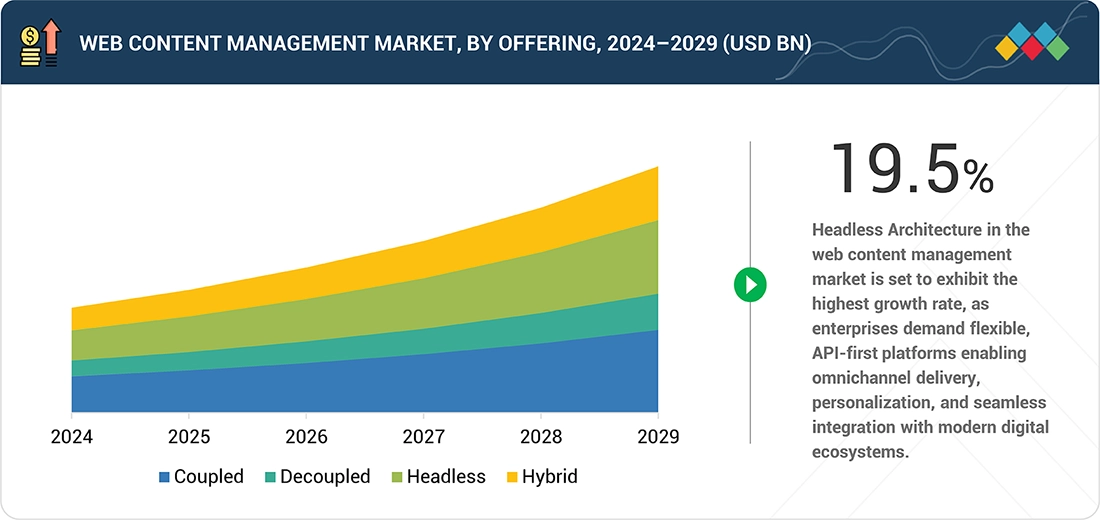
- Headless architecture is set to exhibit the highest growth rate of 19.5%.
Key Market Trends and Insights
- Growth Opportunities: Cloud-native WCM, omnichannel delivery, SEO optimization, and CDP integration drive adoption.
-
Future Outlook: Growth is driven by AI-powered personalization, cloud-native platforms, and composable DXPs.
- Key Trends: Headless CMS, generative AI, low-code workflows, and composable architectures reshape WCM.
- AI Transformation: AI drives transformation in the Web Content Management Market through personalized content delivery.
- Product Type: Content management leads the market, driven by AI adoption, while digital asset and workflow tools gain traction.
KEY TAKEAWAYS
- North America is estimated to account for the largest share (34.4%) of the web content management market in 2024.
- By product type, the content marketing segment is projected to register the highest CAGR of 21.9% during the forecast period,
- The cloud segment is projected to register a higher CAGR of 19.4% during the forecast period.
- By architecture, the coupled segment is expected to hold largest market share in 2025.
- By end user, healthcare & life sciences segment is projected to register the highest CAGR during the forecast period of 2024 - 2029.
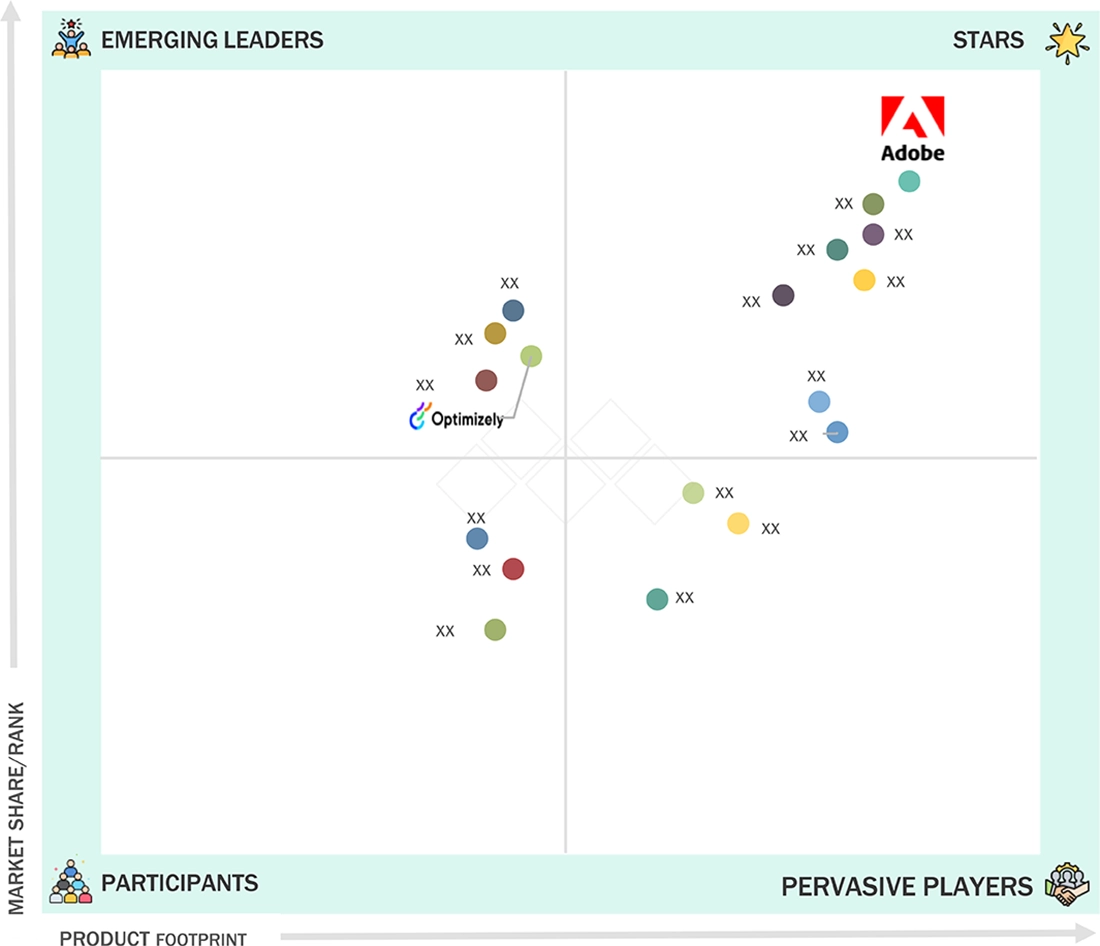
- Companies such as Adobe, OpenText, and Progress were identified as some of the star players in the web content management Market, given their strong market share and product footprint.
- Companies contentful, Bynder, and Webflow, among others, have distinguished themselves among startups and SMEs by securing strong footholds in specialized niche areas, underscoring their potential as emerging market leaders
The web content management (WCM) market is undergoing rapid transformation, driven by the shift toward cloud-native and headless platforms, growing demand for omnichannel digital experiences, and the integration of AI for personalization and automation. Enterprises are increasingly adopting composable digital experience platforms to enhance agility, while vendors emphasize faster content delivery, scalability, and workflow efficiency. These trends highlight WCM’s evolving role as a core enabler of modern customer engagement strategies
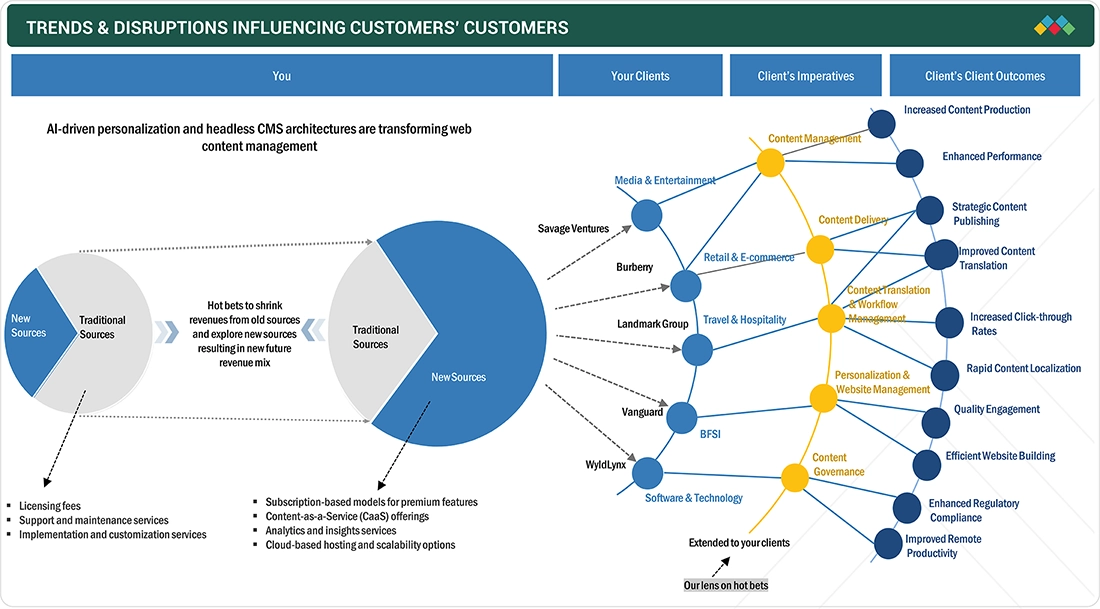
TRENDS & DISRUPTIONS IMPACTING CUSTOMERS' CUSTOMERS
The web content management market is experiencing a strategic revenue shift, with traditional on-premise CMS platforms and static web solutions currently representing 80% of revenue transitioning toward cloud-native platforms, omnichannel orchestration, advanced analytics, and content-as-a-service offerings expected to comprise 80% of future revenue mix
Source: Secondary Research, Interviews with Experts, MarketsandMarkets Analysis
MARKET DYNAMICS
Level
-
•Rising Demand for Omnichannel Digital Experience Management

-
•Rapid Adoption of Cloud-Native and Headless CMS Platforms

Level
-
•High Migration Costs from Legacy CMS Infrastructure

-
•Increasing Data Privacy and Regulatory Compliance Burdens

Level
-
•AI and Generative Content Creation for Scalable Publishing

-
•Integration of WCM into Composable Digital Experience Platforms

Level
-
•Balancing Personalization with Security and User Trust Concerns

-
•Talent Shortage for Managing Complex WCM Architectures

Source: Secondary Research, Interviews with Experts, MarketsandMarkets Analysis
Rapid Adoption of Cloud-Native and Headless CMS Platforms
Cloud-native and headless CMS platforms are accelerating digital transformation by offering agility, scalability, and API-first integration. These architectures support rapid deployment and ecosystem-wide content management, fueling growth in composable WCM systems.
High Migration Costs from Legacy CMS Infrastructure
High migration costs from legacy CMS infrastructure remain a major barrier. Re-platforming, retraining, and integration with existing IT systems require significant investment, especially for mid-sized enterprises with constrained digital budgets.
AI and Generative Content Creation for Scalable Publishing
AI and generative content creation are revolutionizing WCM by enabling scalable publishing, automated personalization, and multilingual content delivery. These capabilities reduce time-to-market and enhance engagement, positioning AI-integrated platforms for strong market capture.
Balancing Personalization with Security and User Trust Concerns
Balancing personalization with privacy and trust is increasingly complex. As WCM platforms collect more user data to deliver tailored experiences, enterprises must navigate growing concerns around data security and ethical use, especially in regulated environments.
Web Content Management (WCM) Market: COMMERCIAL USE CASES ACROSS INDUSTRIES
| COMPANY | USE CASE DESCRIPTION | BENEFITS |
|---|---|---|
 |
Savage Ventures partnered with WordPress VIP to address content management inefficiencies from disparate systems and slow creation. They implemented the platform to streamline content, development, and analytics | Achieved a 79% increase in content production and a 121% rise in visitor traffic. The platform improved operational efficiency and enabled faster, more strategic publishing |
 |
Burberry adopted Contentstack's headless CMS for digital transformation, challenging its legacy platform for managing multilingual, multi-channel content across the global market | Developer tickets dropped to fewer than one per week. Improved translation speed by 80%, enabling quicker content publication across global sites and supporting 50 languages |
 |
Landmark Group used Amplience to streamline content management across 2,200 stores and 150,000 products. The solution addressed slow updates and complex multi-language content issues | Reduced webpage launch times from 14 days to just 1 day. The improved flexibility helped increase click-through rates and conversions without needing a larger content team |
Logos and trademarks shown above are the property of their respective owners. Their use here is for informational and illustrative purposes only.
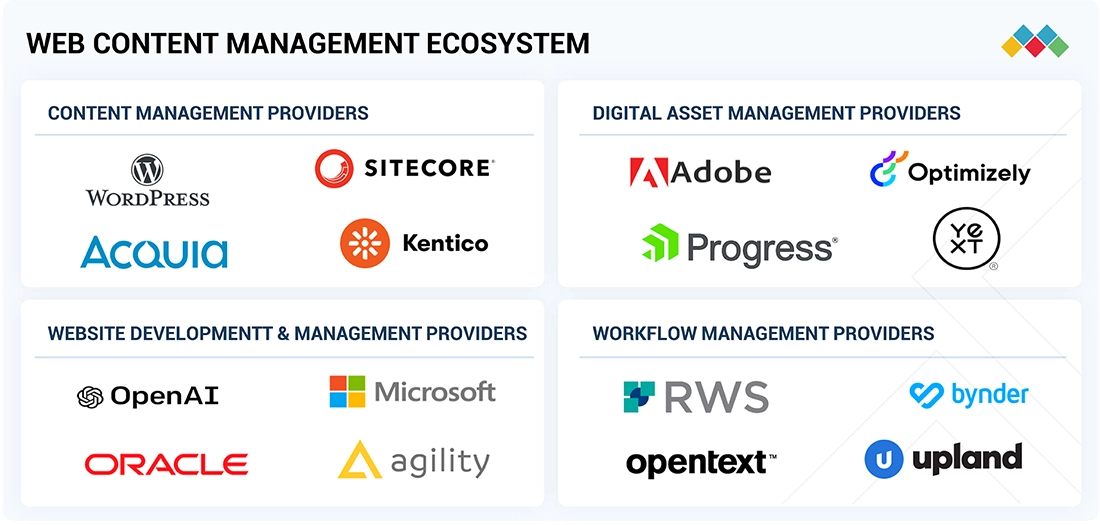
MARKET ECOSYSTEM
The web content management market ecosystem includes companies that provide content management, digital asset management, website development and management, and workflow management. These players collaborate with technology partners to deliver comprehensive WCM solutions. End users include key enterprises such as media & entertainment, healthcare & life sciences, and retail & e-commerce, among others, that are adopting these solutions to optimize digital experiences and deploy content optimally
Logos and trademarks shown above are the property of their respective owners. Their use here is for informational and illustrative purposes only.
MARKET SEGMENTS
Source: Secondary Research, Interviews with Experts, MarketsandMarkets Analysis
Web Content Management Market, By Product Type
Content marketing solutions represent the fastest growing product type segment as enterprises prioritize strategic content creation, distribution, and performance optimization to drive customer engagement and conversions. These platforms integrate content planning workflows, editorial calendars, SEO optimization tools, and analytics dashboards, enabling marketing teams to execute data-driven campaigns that deliver measurable ROI and audience growth
Web Content Management Market, By Architecture
Headless architecture emerges as the fastest growing segment, enabling API-driven content delivery across websites, mobile apps, IoT devices, and emerging digital channels. This decoupled approach separates content management from presentation, allowing developers flexibility in frontend frameworks while content teams work independently, delivering omnichannel consistency and future-proof infrastructure for evolving digital experiences
Web Content Management Market, By End User
Healthcare and life sciences represents the fastest growing end-user segment, driven by regulatory compliance requirements, patient engagement demands, and telehealth expansion. Healthcare organizations leverage WCM platforms to manage HIPAA-compliant patient portals, publish medical information across digital channels, streamline clinical content updates, and deliver personalized health education, enhancing patient communication while ensuring regulatory adherence and improving healthcare delivery efficiency
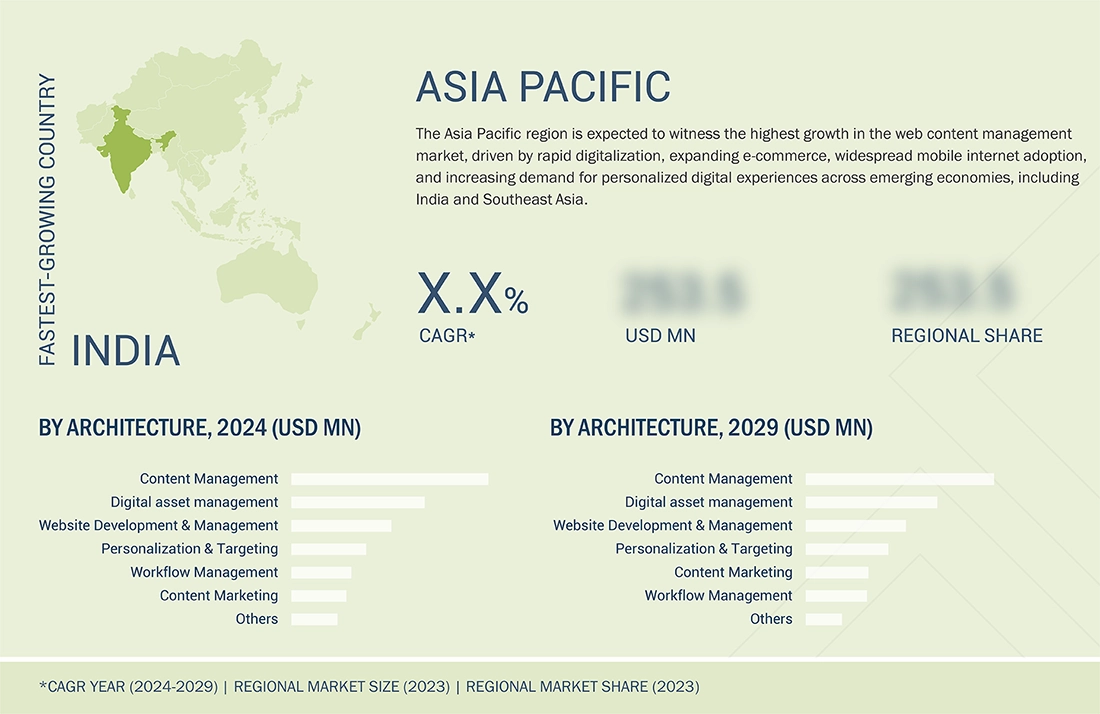
REGION
Asia Pacific to be fastest-growing region in global Oilfield Communications Market during forecast period
Asia Pacific is emerging as the fastest-growing region in the Web Content Management (WCM) market, driven by aggressive digital transformation initiatives, expanding e-commerce ecosystems, and rising mobile-first engagement across emerging economies. Countries like India, China, Southeast Asia, and Japan are investing heavily in cloud infrastructure, multilingual content delivery, and AI-powered personalization to meet the demands of a rapidly digitizing consumer base. Vendors are positioning their platforms to support scalable, cloud-native deployments, headless CMS architectures, and composable digital experience platforms (DXPs) tailored for regional localization and omnichannel delivery. The surge in smartphone adoption, coupled with increasing internet penetration, is accelerating the need for real-time content orchestration, SEO optimization, and low-code/no-code publishing workflows, making Asia Pacific a strategic priority for WCM providers seeking high-growth opportunities.
Web Content Management (WCM) Market: COMPANY EVALUATION MATRIX
In the web content management market matrix, Adobe (Star) leads with strong market share and extensive product footprint, driven by its Adobe Experience Manager platform, cloud-based digital experience solutions, and integrated tools widely adopted across enterprise content management and omnichannel publishing. Optimizely (Emerging Leader) is gaining visibility with specialized content experimentation capabilities and tailored digital experience platforms, strengthening its position through innovation in A/B testing, content recommendations, and visitor segmentation. While major enterprise software providers dominate through scale and diverse portfolios, Optimizely shows significant potential to move toward the leaders' quadrant as demand for data-driven content optimization, personalized customer experiences, and AI-powered content orchestration continues to rise.
Source: Secondary Research, Interviews with Experts, MarketsandMarkets Analysis
KEY MARKET PLAYERS
MARKET SCOPE
| REPORT METRIC | DETAILS |
|---|---|
| Market Size in 2024 (Value) | USD 10.65 Billion |
| Market Forecast in 2029 (value) | USD 24.96 Billion |
| Growth Rate | 18.60% |
| Years Considered | 2019–2029 |
| Base Year | 2023 |
| Forecast Period | 2024–2029 |
| Units Considered | USD Billion |
| Report Coverage | Revenue forecast, company ranking, competitive landscape, growth factors, and trends |
| Segments Covered |
|
| Regions Covered | North America, Asia Pacific, Europe, the Middle East & Africa, and Latin America |
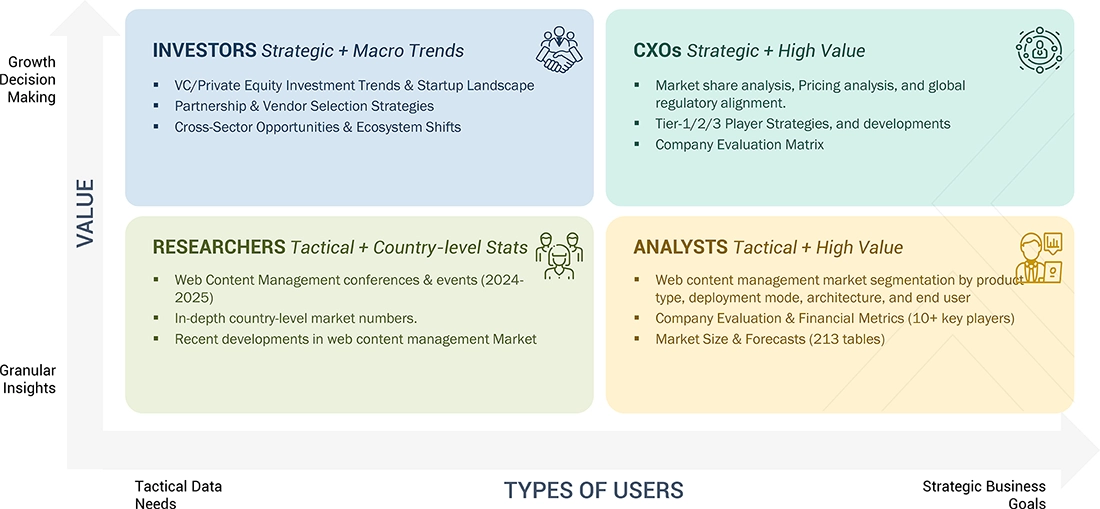
WHAT IS IN IT FOR YOU: Web Content Management (WCM) Market REPORT CONTENT GUIDE
DELIVERED CUSTOMIZATIONS
We have successfully delivered the following deep-dive customizations:
| CLIENT REQUEST | CUSTOMIZATION DELIVERED | VALUE ADDS |
|---|---|---|
| Leading WCM Enterprise Organization |
|
|
| Leading Digital Experience Platform Vendor |
|
|
RECENT DEVELOPMENTS
- September 2024 : Progress announced its acquisition of ShareFile, a SaaS-native, AI-powered collaboration platform from Cloud Software Group. ShareFile enhances document-centric workflows for industries like financial services, healthcare, and construction, reinforcing Progress’s positioning in secure, vertical-specific content collaboration.
- July 2024 : Lumen Technologies partnered with Microsoft to accelerate its digital transformation via the Microsoft Cloud. Microsoft also selected Lumen to expand its network infrastructure to support rising AI-driven data center demand, highlighting the strategic importance of cloud-native scalability and edge content delivery in the WCM ecosystem.
- June 2024 : RWS launched HAI, a self-service platform that combines AI-powered translation with linguistic expertise. Designed to simplify global expansion, HAI removes traditional barriers by offering secure, scalable multilingual content delivery, a key capability for enterprises pursuing international digital engagement.
- March 2024 : Adobe and Microsoft deepened their partnership by integrating Adobe Experience Cloud with Microsoft Copilot for Microsoft 365. This collaboration enhances marketing efficiency by connecting data silos and streamlining workflows across Outlook, Teams, and Word. The integration supports AI-driven content creation, approval, and delivery, reinforcing both vendors’ focus on connected digital experiences.
- January 2024 : OpenText launched Cloud Editions 24.1, introducing advanced capabilities in OpenText Aviator, an AI-powered platform for secure information governance across enterprise knowledge bases. Aviator enables AI use cases without data migration, aligning with enterprise needs for compliant, scalable content management and intelligent automation.
Table of Contents
 Exclusive indicates content/data unique to MarketsandMarkets and not available with any competitors.
Methodology
This comprehensive market research study on the web content management market involved the use of extensive secondary sources, directories, as well as several journals and magazines, such as WCM Journal, Institute of Electrical and Electronics Engineers (IEEE) journals and magazines, and journals/forums for Machine Learning (ML), WCM India magazine, and other magazines. The primary sources were mainly industry experts from the core and related industries, preferred web content management product providers, third-party service providers, consulting service providers, end users, and other commercial enterprises. In-depth interviews were conducted with various primary respondents, including key industry participants and subject-matter experts, to obtain and verify critical qualitative and quantitative information, as well as assess the prospects.
Secondary Research
The market size of companies across the globe offering WCM products was arrived at based on the secondary data available through paid and unpaid sources. It was also arrived at by analyzing the product portfolios of major companies and rating companies based on their performance and quality.
In the secondary research process, various sources were referred to for identifying and collecting information for this study. The secondary sources included annual reports, press releases, and investor presentations of companies; white papers, journals, and certified publications; and articles from recognized authors, directories, and databases. The WCM spending of various countries was extracted from respective sources. Secondary research was mainly used to obtain key information about the industry’s value chain and supply chain to identify key players based on products; services; market classification and segmentation according to offerings of major players; industry trends related to product types, deployment mode, architecture, end user and regions; and key developments from both market- and technology-oriented perspectives.
Primary Research
In the primary research process, various primary sources from both supply and demand sides were interviewed to obtain qualitative and quantitative information on the market. The primary sources from the supply side included various industry experts, such as Chief Experience Officers (CXOs), Vice Presidents (VPs), directors from the business development department, marketing experts, product development/innovation n teams, and related key executives from web content management product vendors, SIs, professional service providers, industry associations, and key opinion leaders.
Primary interviews were conducted to gather insights, such as market statistics, data of revenue collected from the solutions, and services, market breakups, market size estimations, market forecasting, and data triangulation. Primary research also helped in understanding the various trends related to technology, application, deployment, and region. Stakeholders from the demand side, such as Chief Information Officers (CIOs), Chief Technology Officers (CTOs), and Chief Strategy Officers (CSOs), and installation teams of the governments/end users using web content management products were interviewed to understand the buyers’ perspective on the suppliers, products, and service providers; and their current usage of web content management products and how it would affect the overall web content management market.
 Market Size, and Share")
Note 1: Others include sales managers, marketing managers, and product managers.
Note 2: Tier 1 companies’ revenues are more than USD 10 billion; tier 2 companies’ revenues range between USD 1 and 10 billion; and tier 3 companies’ revenues range between USD 500 million and USD 1 billion.
Source: Industry Experts
To know about the assumptions considered for the study, download the pdf brochure
Market Size Estimation
Multiple approaches were adopted for estimating and forecasting the web content management market. The first approach involves estimating the market size by companies’ revenue generated through the sale of WCM products.
Market Size Estimation Methodology- Top-down approach
In the top-down approach, an exhaustive list of all the vendors offering products in the WCM market was prepared. The revenue contribution of the market vendors was estimated through annual reports, press releases, funding, investor presentations, paid databases, and primary interviews. Each vendor's offerings were evaluated based on the breadth of product type, deployment mode, architecture, and end user. The aggregate of all the companies’ revenue was extrapolated to reach the overall market size. Each subsegment was studied and analyzed for its global market size and regional penetration. The markets were triangulated through both primary and secondary research. The primary procedure included extensive interviews for key insights from industry leaders, such as CIOs, CEOs, VPs, directors, and marketing executives. The market numbers were further triangulated with the existing MarketsandMarkets’ repository for validation.
Market Size Estimation Methodology-Bottom-up approach
In the bottom-up approach, the adoption rate of web content management products among different verticals in key countries with respect to their regions contributing the most to the market share was identified. For cross-validation, the adoption of WCM products among enterprises, along with different use cases with respect to their regions, was identified and extrapolated. Weightage was given to use cases identified in different regions for the market size calculation.
Based on the market numbers, the regional split was determined by primary and secondary sources. The procedure included the analysis of the WCM market’s regional penetration. Based on secondary research, the regional spending on Information and Communications Technology (ICT), socio-economic analysis of each country, strategic vendor analysis of major web content management providers, and organic and inorganic business development activities of regional and global players were estimated. With the data triangulation procedure and data validation through primaries, the exact values of the overall web content management market size and segments’ size were determined and confirmed using the study.
Web Content Management (WCM) Market : Top-Down and Bottom-Up Approach
 Market Top Down and Bottom Up Approach")
Data Triangulation
After arriving at the overall market size using the market size estimation processes as explained above, the market was split into several segments and subsegments. To complete the overall market engineering process and arrive at the exact statistics of each market segment and subsegment, data triangulation and market breakup procedures were employed, wherever applicable. The overall market size was then used in the top-down procedure to estimate the size of other individual markets via percentage splits of the market segmentation.
Market Definition
According to OpenText, WCM is a software application that enables enterprises to easily manage and publish digital content. WCM systems include various capabilities, including site design, content authoring, editing, and personalization. A robust WCM would enable organizations to manage multiple websites, support more than one language, as well as deliver omnichannel customer experiences.
According to Sitecore, WCM is a software application that allows users to collaborate in the creation, editing, and production of digital content: web pages and blog posts to manage the overall digital experience. WCM helps users upload or write content, format it, add headlines and images, and perform a number of backstage tasks such as Search Engine Optimization (SEO).
Stakeholders
- WCM product and service providers
- Independent Software Vendors (ISVs)
- Investors and Venture Capitalists (VCs)
- Managed service providers
- Support and maintenance service providers
- System Integrators (SIs)/migration service providers
- Value-Added Resellers (VARs) and distributors
Report Objectives
- To define, describe, and predict the web content management (WCM) market, by product type, deployment mode, architecture, end user and region.
- To describe and forecast the web content management (WCM) market, in terms of value, by region—North America, Europe, Asia Pacific, Middle East & Africa and Latin America
- To provide detailed information regarding major factors influencing the market growth (drivers, restraints, opportunities, and challenges)
- To strategically analyze micromarkets1 with respect to individual growth trends, prospects, and contribution to the overall web content management (WCM) market.
- To profile key players and comprehensively analyze their market positions in terms of ranking and core competencies2, along with detailing the competitive landscape for market leaders.
- To analyze competitive developments such as joint ventures, mergers and acquisitions, product developments, and ongoing research and development (R&D) in the web content management (WCM) market.
- To provide the illustrative segmentation, analysis, and projection of the main regional markets.
Available Customizations
With the given market data, MarketsandMarkets offers customizations as per the company’s specific needs. The following customization options are available for the report:
Product Analysis
- The product matrix provides a detailed comparison of the product portfolio of each company.
Geographic Analysis as per Feasibility
- Further breakup of the North American web content management (WCM) Market
- Further breakup of the European web content management (WCM) Market
- Further breakup of the Asia Pacific web content management (WCM) Market
- Further breakup of the Middle East & Africa web content management (WCM) Market
- Further breakup of the Latin American web content management (WCM) Market
Company Information
- Detailed analysis and profiling of additional market players (up to five)
Key Questions Addressed by the Report
Need a Tailored Report?
Customize this report to your needs
Get 10% FREE Customization
Customize This ReportPersonalize This Research
- Triangulate with your Own Data
- Get Data as per your Format and Definition
- Gain a Deeper Dive on a Specific Application, Geography, Customer or Competitor
- Any level of Personalization
Let Us Help You
- What are the Known and Unknown Adjacencies Impacting the Web Content Management (WCM) Market
- What will your New Revenue Sources be?
- Who will be your Top Customer; what will make them switch?
- Defend your Market Share or Win Competitors
- Get a Scorecard for Target Partners

Custom Market Research Services
We Will Customise The Research For You, In Case The Report Listed Above Does Not Meet With Your Requirements
Get 10% Free CustomisationTESTIMONIALS


Growth opportunities and latent adjacency in Web Content Management (WCM) Market