Display Driver Market by Driver Type (DDIC, TDDI), Package Type (COF, COG), Device (Smartphone, Television, Automotive, Smart Wearables, HMD, Monitor), Display Technology (LCD, OLED), Display Size, and Geography - Global Forecast to 2036


The display driver market was valued at USD 8.38 billion in 2024 and is estimated to reach USD 19.70 billion by 2036, at a CAGR of 7.2% between 2025 and 2036.
The global display driver market is driven by the rising demand for high-performance display solutions across smartphones, televisions, automotive systems, and emerging wearable devices. Growing adoption of OLED and high-resolution LCD panels, along with trends such as foldable and bezel-less designs, is fueling the need for advanced DDIC and TDDI solutions. Continuous innovation in COF (Chip On Film) and COG (Chip On Glass) packaging, higher refresh rates, and energy-efficient architectures are enhancing visual performance and supporting thinner, more compact displays. Furthermore, the expansion of AR/VR headsets, automotive digital clusters, and smart devices is broadening the application scope. Overall, the market is witnessing rapid technological advancement, with manufacturers focusing on integration, power efficiency, and OLED driver optimization to meet the evolving needs of premium and next-generation display technologies.

Display driver technology is expanding into automotive, industrial, and professional applications, where precision and reliability are vital. In vehicles, advanced drivers power instrument clusters, infotainment, and HUDs, while in industrial and medical systems, they ensure accurate visualization and stable performance. High-end monitors and public displays also leverage these ICs for brightness and color uniformity. Manufacturers are emphasizing automotive-grade reliability, AI-based optimization, and advanced interfaces to strengthen adoption across commercial and enterprise sectors.
Market by Display Technology
OLED
OLED displays dominate the display driver market, particularly in smartphones, wearables, televisions, and head-mounted displays. Their superior contrast, color accuracy, flexibility, and energy efficiency make them the preferred choice for premium and next-generation devices. OLED-compatible DDIC (Display Driver Integrated Circuit) and TDDI (Touch and Display Driver Integration) solutions support foldable and curved designs, high refresh rates, and thinner form factors. Rising consumer demand, technological advancements, and increasing adoption across high-end and emerging applications drive market growth.
LCD
LCD panels continue to hold a notable share in the market, mainly in televisions, monitors, and certain automotive and industrial applications. Advanced driver ICs enhance refresh rates, brightness uniformity, and energy efficiency for high-resolution LCDs. While adoption in smartphones is declining relative to OLED, demand persists for larger screens, cost-sensitive devices, and legacy applications requiring reliable and stable display performance.
Market by Device
Smartphones
Smartphones are a leading segment of the display driver market, propelled by demand for high-resolution OLED and LCD panels in premium and mid-range devices. Advanced DDIC and TDDI solutions enable thinner designs, higher refresh rates, and improved touch responsiveness. Rising adoption of foldable, bezel-less, and high-refresh displays further drives the integration of display drivers, making smartphones a primary contributor to global market growth.
Televisions
Televisions form a major part of the display driver market, driven by OLED and LCD adoption in 4K and 8K UHD (Ultra High Definition) displays. Advanced drivers enable HDR (High Dynamic Range), higher refresh rates, and energy-efficient operation, enhancing immersive viewing experiences. Increasing consumer demand for smart TVs and premium home entertainment systems supports broader deployment of display driver ICs, particularly in large-format displays for households worldwide.
Automotive
Automotive displays, including digital dashboards, infotainment systems, and HUDs, are growing rapidly. Automotive-grade DDICs and TDDIs ensure high reliability, precise visualization, and real-time responsiveness for in-vehicle applications. The rise of connected cars, digital cockpits, and autonomous vehicle displays is driving demand for advanced display driver solutions, enabling enhanced safety, better user interfaces, and a more immersive driving experience.
Smart Wearables
Wearables, such as smartwatches and fitness trackers, are expanding demand for ultra-compact, energy-efficient driver ICs compatible with small OLED and LCD panels. Advanced drivers support high touch sensitivity, brightness uniformity, and extended battery life in space-constrained designs. Growing adoption of health monitoring, fitness tracking, and wearable communication devices is accelerating deployment of display driver solutions in this rapidly expanding segment.
HMD
Head-mounted displays depend on high-performance driver ICs to deliver low-latency, high-resolution visuals for immersive AR/VR experiences. OLED and LCD panels with high refresh rates are critical for smooth motion, accurate color, and user comfort, driving the adoption of integrated TDDI solutions. Increasing applications in gaming, simulation, and enterprise AR/VR are further boosting demand in this specialized segment.
Monitors
High-end monitors used for gaming, professional design, and content creation rely on OLED and LCD panels paired with advanced driver ICs. These drivers ensure precise color reproduction, high refresh rates, and HDR support, enhancing visual performance for demanding users. Steady adoption in the professional, creative, and enterprise markets continues to drive segment growth, making monitors an important contributor to the display driver market.
Market by Driver Type
Display Driver IC (DDIC)
DDICs represent the core of the display driver market, widely adopted in LCD and OLED panels across smartphones, televisions, monitors, and automotive displays. These ICs control pixel-level accuracy, brightness, and refresh performance, ensuring superior image quality. Continuous innovation in energy efficiency, resolution enhancement, and multi-display support is driving steady DDIC demand in both consumer and industrial devices.
Touch and Display Driver Integration (TDDI)
TDDI solutions are gaining momentum as manufacturers seek integration of touch and display functions into a single chip, reducing space and cost. These drivers enhance touch responsiveness, optical clarity, and overall device thinness, particularly in OLED smartphones, tablets, and wearables. Rising adoption of bezel-less and foldable displays is fueling TDDI demand, with strong growth expected across portable and automotive segments.
Market by Package Type
Chip-on-Film (COF)
COF packaging dominates modern display driver integration, especially in flexible OLED panels and slim LCDs. It allows for thinner profiles, lightweight designs, and high interconnection density, essential for compact devices like smartphones and wearables. With the growing adoption of foldable and edge-to-edge displays, COF technology continues to expand, supported by advances in substrate materials and manufacturing precision.
Chip-on-Glass (COG)
COG packaging remains relevant in cost-sensitive and large-format displays, such as televisions, monitors, and industrial panels. By bonding driver ICs directly onto the glass substrate, COG offers robust signal stability and simplified assembly. While its use is gradually declining in portable devices, it maintains a steady presence in mid-range and high-durability display applications where cost and reliability are key.
Market by Geography
Geographically, the display driver market is experiencing significant growth across the Asia Pacific, North America, Europe, and the Middle East & Africa. Asia Pacific leads, driven by high smartphone adoption, rapid OLED and LCD panel production, and expanding automotive and wearable device industries. North America demonstrates strong demand through premium consumer electronics, advanced automotive displays, and enterprise-grade monitors. Europe is growing steadily, supported by professional design, AR/VR, and industrial applications. Meanwhile, the Middle East & Africa are emerging markets, with rising adoption of luxury electronics, smart infrastructure, and high-end automotive displays, offering new opportunities for display driver manufacturers.
Market Dynamics
Driver: Rising Consumer Electronics Demand
The growing adoption of smartphones, televisions, wearables, and high-end monitors is a key driver for the display driver market. Advanced DDIC and TDDI solutions are increasingly required to support high-resolution OLED and LCD panels, improve touch responsiveness, and enable thinner, energy-efficient designs. Rising demand for foldable, bezel-less, and high-refresh displays further boosts the integration of display drivers, making consumer electronics the primary growth engine for the market across global regions.
Restraint: High Manufacturing Costs
The production of advanced OLED and MicroLED panels requires significant investment in equipment, materials, and precision manufacturing. High costs of substrates, encapsulation, and flexible display technologies limit adoption, especially in mid-range and budget devices. These expenses also impact smaller manufacturers, making it challenging to compete with established players. As a result, despite technological advantages, price-sensitive markets may delay upgrading to premium display technologies, restricting overall market penetration.
Opportunity: Flexible and Foldable Displays
The emergence of foldable smartphones, curved TVs, wearable devices, and automotive dashboards is creating new growth avenues for display driver ICs. These innovative form factors require specialized, compact, and energy-efficient driver solutions to maintain display performance, touch sensitivity, and visual clarity. As manufacturers focus on next-generation flexible displays, there is significant potential for the adoption of integrated TDDI and DDIC solutions, particularly in premium consumer devices, automotive applications, and industrial-grade display systems.
Challenge: Technological Complexity
Rapid advancements in display technologies, including OLED, MicroLED, high refresh rates, and AI-driven displays, demand substantial R&D investment and specialized expertise. Smaller manufacturers often struggle to keep pace with the technical requirements for integration, energy efficiency, and high-resolution output. Maintaining reliability, performance, and compatibility across diverse devices adds complexity, creating barriers to entry. The market requires continuous innovation to meet evolving consumer and industrial demands, making technological sophistication a key challenge for stakeholders.
Future Outlook
Between 2025 and 2036, the display driver market is expected to experience substantial growth as high-performance, energy-efficient display solutions become central to smartphones, televisions, wearables, automotive dashboards, and professional monitors. Advances in OLED and LCD panel technologies, AI-driven image optimization, and integrated TDDI solutions will enhance display quality, responsiveness, and power efficiency. Rising adoption in AR/VR, automotive digital cockpits, industrial panels, and premium consumer devices will accelerate market expansion. As innovation continues, display drivers will enable next-generation form factors, immersive experiences, and precision visualization across industries.
Key Market Players
Leading companies in the global display driver market include Novatek Microelectronics Corp. (Taiwan), LX Semicon (South Korea), Samsung (South Korea), Himax Technologies, Inc. (Taiwan), and Beijing ESWIN Technology Group Co., Ltd. (China).
Key Questions addressed in this report:
- What are the global trends in demand for the market?
- What are the upcoming technologies that will have a significant impact on the market in the future?
- What will be the revenue pockets for the market players in the next 6 years?
- What are the prime strategies followed by key players in the market?
 Exclusive indicates content/data unique to MarketsandMarkets and not available with any competitors.
Table of Contents
1 Introduction (Page No. - 16)
1.1 Objectives of the Study
1.2 Definition
1.3 Study Scope
1.3.1 Markets Covered
1.3.2 Geographic Scope
1.4 Years Considered for the Study
1.5 Currency
1.6 Market Stakeholders
2 Research Methodology (Page No. - 19)
2.1 Research Data
2.1.1 Secondary Data
2.1.1.1 Secondary Sources
2.1.2 Primary Data
2.1.2.1 Key Industry Insights
2.1.2.2 Breakdown of Primaries
2.2 Market Size Estimation
2.2.1 Bottom-Up Approach
2.2.2 Top-Down Approach
2.3 Market Breakdown and Data Triangulation
2.4 Research Assumptions
3 Executive Summary (Page No. - 28)
4 Premium Insights (Page No. - 34)
4.1 Attractive Opportunities in Display Driver Market
4.2 Global Display Panel Shipments, By Device, 2015–2023
4.3 Market, By Driver and Package Type, 2015 vs 2018 vs 2023
4.4 Market, By Display Technology, 2018 vs 2023
4.5 Market Opportunity Analysis, By Device
4.6 Market, By Device Size and Country, 2018 vs 2023
4.7 Market, By Country, 2015 vs 2018 vs 2023
4.8 Market in China, By Device, 2015–2023
5 Market Overview (Page No. - 40)
5.1 Introduction
5.2 Market Dynamics
5.2.1 Drivers
5.2.1.1 Increasing OLED and Flexible Display Demand
5.2.1.2 Increasing Demand for Highly Priced and Advanced Display Drivers
5.2.1.3 Growth in Use of 4K & 8K Televisions and Availability of Uhd Content
5.2.1.4 Increasing Demand for Automotive Displays
5.2.1.5 Evolving Role of DDICs From Individual Components to Single Integration Chips
5.2.2 Restraints
5.2.2.1 Saturated Growth and Declining Volumes of Shipments of Display Panels of Tvs, Tablets, and Monitors
5.2.3 Opportunities
5.2.3.1 Development of COF Package-Based Display Drivers and Innovations in TDDI-Type Display Drivers
5.2.3.2 Construction of New OLED and LCD Panel Manufacturing Facilities
5.2.3.3 Increasing Demand for Wearable Displays for Smartwatches and AR/VR HMDs
5.2.3.4 Emerging Display Technologies—Micro-Led and True Quantum Dot
5.2.3.5 Emerging New Applications for Display Panels
5.2.4 Challenges
5.2.4.1 High Competition and Demand for Diverse Product Specifications
5.2.4.2 Increasing Ram Capacity of DDICs for High-Resolution Displays
5.2.4.3 Rapid Advancements in Display Panel Technology
6 Industry Trends (Page No. - 53)
6.1 Introduction
6.2 Value Chain Analysis
6.2.1 Research and Development
6.2.2 DDIC Manufacturing
6.2.3 Display Panel Integration
6.2.4 Input Components and Materials
6.3 Key Trends in Display Driver
6.3.1 Touch and Display Driver Integration (TDDI)
6.3.2 Package Type (COF & COG)
6.4 Key Display Panel Trends Impacting Display Drivers Market
6.4.1 Oled
6.4.2 Quantum Dot
6.4.3 Micro-Led
6.4.4 Flexible Displays
7 Display Driver Market, By Display Size & Devices (Page No. - 59)
7.1 Introduction
7.2 Small Devices
7.2.1 Smartphone
7.2.1.1 South Korea to Dominate the Market for Smartphone
7.2.2 Tablet
7.2.2.1 Display Driver Demand for Tablets to Decline During Forecast Period
7.2.3 Automotive Display
7.2.3.1 Market to Witness Significant Growth in Automotive Segment
7.2.4 Others
7.2.4.1 Market for Other Small Devices to Decline During the Forecast Period
7.3 Medium-Sized and Large Devices
7.3.1 Television
7.3.1.1 Television to Witness Growth in Market Due to Increasing Resolution and Size
7.3.2 Monitor & Notebook
7.3.2.1 Market to Witness Decline in Monitor & Notebook Segment
7.3.3 Others
7.3.3.1 Other Medium-Sized and Large Devices to Account for Minor Share in Market
7.4 Smart Wearables
7.4.1 Smartwatch
7.4.1.1 Smartwatch Accounted for Major Share in Market for Smart Wearables
7.4.2 AR HMD
7.4.2.1 Market for AR HMD to Surge Rapidly During the Forecast Period
7.4.3 VR HMD
7.4.3.1 Market for VR HMD to Grow Rapidly During the Forecast Period
8 Display Driver Market, By Display Technology (Page No. - 75)
8.1 Introduction
8.2 LCD
8.2.1 Market for LCD Displays to Be Highly Competitive During Forecast Period
8.3 OLED
8.3.1 OLED Displays Expected to Define the Growth of Global Market During Forecast Period
8.4 Others
8.4.1 Major Demand of Display Drivers for Other Display Technologies to Emerge From China, Taiwan, and RoW
9 Display Driver Market, By Driver & Package Type (Page No. - 82)
9.1 Market By Driver Type
9.1.1 Display Driver IC (DDIC)
9.1.1.1 DDIC-Type Display Drivers to Account for Major Share in the Market During Forecast Period
9.1.2 Touch and Display Driver Integration (TDDI)
9.1.2.1 Market for TDDI-Type Display Drivers to Grow at A Higher CAGR During Forecast Period
9.2 Market By Package Type
9.2.1 Chip-On-Glass (COG)
9.2.1.1 Market for COG Package-Based Display Drivers Expected to Decline During Forecast Period
9.2.2 Chip-On-Film (COF)
9.2.2.1 COF Package-Based Display Drivers to Witness Rapid Growth in the Market During Forecast Period
10 Geographic Analysis (Page No. - 88)
10.1 Introduction
10.2 South Korea
10.2.1 OLED Displays to Account for Major Share in Market in South Korea During Forecast Period
10.3 China
10.3.1 LCD Displays to Account for Major Share in Market in China During Forecast Period
10.4 Taiwan
10.4.1 Small Displays to Account for Major Share in Market in Taiwan During Forecast Period
10.5 Japan
10.5.1 Market to Witness Growth for Smart Wearables in Japan During Forecast Period
10.6 Rest of the World (RoW)
10.6.1 Major Demand for Display Drivers to Emerge for Other Display Technologies in RoW Region
11 Competitive Landscape (Page No. - 110)
11.1 Overview
11.2 Player Market Share in Display Driver Market
11.3 Competitive Scenario
11.3.1 Product Launches and Developments
11.3.2 Mergers and Acquisition
12 Company Profiles (Page No. - 115)
12.1 Introduction
(Business Overview, Products Offered, Recent Developments, MnM View, SWOT Analysis)*
12.2 Key Players
12.2.1 Samsung Electronics
12.2.2 Novatek Microelectronics
12.2.3 Synaptics
12.2.4 Himax Technologies
12.2.5 Silicon Works
12.2.6 Sitronix Technology
12.2.7 Raydium Semiconductor
12.2.8 Magnachip Semiconductor
12.2.9 Focaltech
12.2.10 Mediatek
12.2.11 Fitipower Integrated Technology
12.2.12 Rohm Semiconductor
12.3 Other Players
12.3.1 Olightek
12.3.2 Solomon Systech
12.3.3 Microchip Technology
12.3.4 Solasoled
12.3.5 Dialog Semiconductor
12.3.6 Lucid Display Technology (LDT)
12.3.7 Sinowealth Electronic
12.3.8 Ultrachip
*Business Overview, Products Offered, Recent Developments, MnM View, SWOT Analysis Might Not Be Captured in Case of Unlisted Companies.
13 Appendix (Page No. - 148)
13.1 Discussion Guide
13.2 Knowledge Store: Marketsandmarkets’ Subscription Portal
13.3 Available Customization
13.4 Related Reports
13.5 Author Details
List of Tables (36 Tables)
Table 1 LCD and OLED Fab Construction Roadmap in China
Table 2 Display Panel Shipments, By Device, 2015–2023 ( Million Units)
Table 3 Display Driver Market, By Display Size, 2015–2023 ( USD Billion)
Table 4 Market for Small Devices, By Country 2015–2023 (USD Billion)
Table 5 Market for Small Devices, By Device Type, 2015-2023(USD Billion)
Table 6 Market for Smartphone, By Country, 2015-2023 (USD Billion)
Table 7 Market for Tablet, By Country, 2015-2023 (USD Million)
Table 8 Market for Automotive Display, By Country, 2015-2023 (USD Million)
Table 9 Market for Others Small Devices, By Country, 2015-2023 (USD Million)
Table 10 Market for Medium-Sized and Large Devices, By Country, 2015-2023 (USD Million)
Table 11 Market for Medium-Sized and Large Devices, By Device Type, 2015-2023 (USD Million)
Table 12 Market for Television, By Country, 2015-2023 (USD Million)
Table 13 Market for Monitor & Notebook, By Country, 2015-2023 (USD Million)
Table 14 Market for Smart Wearables, By Country, 2015-2023 (USD Million)
Table 15 Market for Smart Wearables, By Type, 2015-2023 (USD Million)
Table 16 Market, By Display Technology, 2015–2023 (USD Million)
Table 17 Market for LCD Displays, By Country, 2015–2023 (USD Million)
Table 18 Market for OLED Displays, By Country, 2015–2023 (USD Million)
Table 19 Market for Other Technology-Based Displays, By Country, 2015–2023 (USD Million)
Table 20 Market, By Driver Type, 2015–2023 ( USD Billion)
Table 21 Market, By Package Type, 2015–2023 ( USD Billion)
Table 22 Market, By Country, 2015–2023 (USD Million)
Table 23 Market in South Korea, By Display Technology, 2015–2023 (USD Million)
Table 24 Market in South Korea, By Display Size, 2015–2023 (USD Million)
Table 25 Market in South Korea, By Device, 2015–2023 (USD Million)
Table 26 Market in China, By Display Technology, 2015–2023 (USD Million)
Table 27 Market in China, By Display Size, 2015–2023 (USD Million)
Table 28 Market in China, By Device, 2015–2023 (USD Million)
Table 29 Market in Taiwan, By Display Technology, 2015–2023 (USD Million)
Table 30 Market in Taiwan, By Display Size, 2015–2023 (USD Million)
Table 31 Market in Taiwan, By Device, 2015–2023 (USD Million)
Table 32 Market in Japan, By Display Technology, 2015–2023 (USD Million)
Table 33 Market in Japan, By Display Size, 2015–2023 (USD Million)
Table 34 Market in Japan, By Device, 2015–2023 (USD Million)
Table 35 Market in RoW, By Display Technology, 2015–2023 (USD Million)
Table 36 Market in RoW, By Display Size, 2015–2023 (USD Million)
List of Figures (77 Figures)
Figure 1 Display Driver Market: Research Design
Figure 2 Research Flow of Market Size Estimation
Figure 3 Market Size Estimation Methodology: Bottom-Up Approach
Figure 4 Market Size Estimation Methodology: Top-Down Approach
Figure 5 Data Triangulation
Figure 6 Global Display Driver Market, 2015–2023 (USD Million)
Figure 7 TDDI to Define the Growth of Market During Forecast Period
Figure 8 COF-Based Display Drivers to Be the New Trend in Market During the Forecast Period
Figure 9 Market to Grow at Highest CAGR in OLED Segment
Figure 10 Small Devices to Dominate the Market in Terms of Size During Forecast Period
Figure 11 Market to Witness Rapid Growth From China During Forecast Period
Figure 12 OLED to Define Market During the Next 5 Years
Figure 13 Global Display Panel Market Outlook
Figure 14 TDDI-Type Display Drivers to Rapidly Gain Share in Market
Figure 15 COF-Type Packages to Rapidly Gain Share in Market
Figure 16 OLED Displays to Drive the Market Toward High Growth During Forecast Period
Figure 17 Smart Wearables, Television, Automotive, and Smartphone Segments to Create High-Growth Opportunities During Forecast Period
Figure 18 Smartphone Segment to Hold A Larger Share in the Market in 2018
Figure 19 South Korea in Country and Small Devices in Device Size to Dominate Global Market During Forecast Period
Figure 20 Demand for Display Drivers to Rapidly Grow in China in the Next 5 Years
Figure 21 Smartphone and Television Segments to Dominate the Market in China Between 2018 and 2023
Figure 22 Drivers, Restraints, Opportunities, and Challenges for the Display Driver Market
Figure 23 OLED Display Panel Shipments, 2014–2023 (Million Units)
Figure 24 Shipments for 4K TV are Forecasted to Grow Rapidly Worldwide By 2020
Figure 25 Demand for 8K TV is Expected to Surge 2018 Onwards
Figure 26 Automotive Display Shipments, 2015–2023 (Million Units)
Figure 27 Automotive Display Market Share, By Display Type, 2017 vs 2022
Figure 28 Display Devices With Saturated Growth and Declining Shipment Volumes
Figure 29 Wearable Display Shipments, By Product Type, 2015–2023 (Million Units)
Figure 30 Micro-Led Display Panel Market, 2017-2025 (USD Billion)
Figure 31 Micro-Led Market: Revenue Impact on Key Players in Supply Chain
Figure 32 Display Driver Market: Value Chain Analysis
Figure 33 Smartphone is Expected to Be the Largest Segment for OLED Display Panels During the Forecast Period
Figure 34 Highly Growing Quantum Dot Display Panel Market
Figure 35 Smartphone to Be Largest Segment in Micro-Led Display Market By 2025
Figure 36 Display Driver Market, By Display Size & Devices
Figure 37 Small Devices to Dominate Market in Terms of Size During Forecast Period
Figure 38 South Korea to Dominate the Market for Smartphone, in Terms of Size, During Forecast Period
Figure 39 Market for Automotive Display to Grow at Highest CAGR in China During Forecast Period
Figure 40 Market for Television to Grow at the Highest CAGR in China During the Forecast Period
Figure 41 Market, By Display Technology
Figure 42 Market to Grow at Highest CAGR in OLED Segment During Forecast Period
Figure 43 Market for LCD Displays, Market Share By Country, 2018 vs 2023
Figure 44 Market for OLED Displays, Market Share By Country, 2018 vs 2023
Figure 45 Market, By Driver Type
Figure 46 Market for TDDI-Type Display Drivers to Grow at A Higher CAGR During Forecast Period
Figure 47 Market, By Package Type
Figure 48 COF Package-Based Display Drivers to Witness Rapid Growth in the Market During Forecast Period
Figure 49 Display Drivers Market, By Country
Figure 50 Geographic Snapshot of Global Display Driver Market
Figure 51 South Korea to Account for A Major Share of Market During Forecast Period
Figure 52 OLED to Define Growth of Market in South Korea
Figure 53 OLED Displays to Account for Major Share in Market in South Korea During Forecast Period
Figure 54 Smartphones to Account for Highest Demand in Market in South Korea During Forecast Period
Figure 55 Market in China to Grow for Both LCD and OLED Displays
Figure 56 LCD Displays to Account for Major Share in Market in China During Forecast Period
Figure 57 Demand for Smartphone Display Drivers to Double in China During Forecast Period
Figure 58 Majority of Demand for Display Drivers to Emerge for LCD Displays in Taiwan
Figure 59 LCD Displays to Account for Major Share in Market in Taiwan During Forecast Period
Figure 60 Smartphone, Television, and Monitor & Notebook to Lead Market in Terms of Demand During Forecast Period in Taiwan
Figure 61 Market in Japan to Grow for OLED Displays
Figure 62 LCD Displays to Account for Major Share in Market in Japan During Forecast Period
Figure 63 Smartphone, Television, and Automotive to Lead Market in Terms of Demand During Forecast Period in Japan
Figure 64 Product Launches and Developments Emerged as the Key Growth Strategy Adopted By the Companies Between 2014 and 2018
Figure 65 Player Market Share: Display Driver Market, 2017
Figure 66 Samsung Electronics: Company Snapshot
Figure 67 Novatek Microelectronics: Company Snapshot
Figure 68 Synaptics: Company Snapshot
Figure 69 Himax Technologies: Company Snapshot
Figure 70 Silicon Works: Company Snapshot
Figure 71 Sitronix Technology: Company Snapshot
Figure 72 Raydium Semiconductor: Company Snapshot
Figure 73 Magnachip Semiconductor: Company Snapshot
Figure 74 Focaltech: Company Snapshot
Figure 75 Mediatek: Company Snapshot
Figure 76 Fitipower Integrated Technology: Company Snapshot
Figure 77 Rohm Semiconductor: Company Snapshot
The study involved 4 major activities to estimate the current size of the display driver market. Exhaustive secondary research was done to collect information on the market, including peer market and parent market. The next step was to validate these findings, assumptions, and sizing with industry experts across value chain through primary research. Both top-down and bottom-up approaches were employed to estimate the complete market size. Thereafter, market breakdown and data triangulation were used to estimate the market size of segments and sub segments.
Secondary Research
In the secondary research process, various secondary sources have been referred to for identifying and collecting information important for this study. Secondary sources include corporate filings (such as annual reports, investor presentations, and financial statements), trade shows, and professional associations (SID, CES/CTA, SEMI, IDEA, SOA, AIA, SPIE, FlexTech, CS International, and others), white papers, process and communication-related journals, websites, and certified publications. They also include articles from recognized authors gold-standard and silver-standard websites, directories, and databases.
The secondary research has been mainly used to obtain key information about the industry’s supply chain, the total pool of key players, market classification, and segmentation according to industry trends to the bottom-most level and key developments from both market- and technology-oriented perspectives. The secondary data have been collected and analyzed to arrive at the overall market size, which has been further validated through primary research.
Primary Research
In the primary research process, various primary sources from both supply and demand sides have been interviewed to obtain qualitative information for this report. The primary sources from the supply side include industry experts such as CEOs, vice presidents, marketing directors, technology and innovation directors, and related key executives from major companies and organizations operating in the display driver market.
After the complete market engineering (which includes calculations for market statistics, market breakdown, market size estimations, market forecasting, and data triangulation), extensive primary research has been conducted to gather information and verify and validate the critical numbers arrived at in this process. Primary research has been conducted to identify segmentation types, industry trends, key players, and key market dynamics such as drivers, restraints, opportunities, and challenges, along with the key strategies adopted by the players operating in the display driver market.
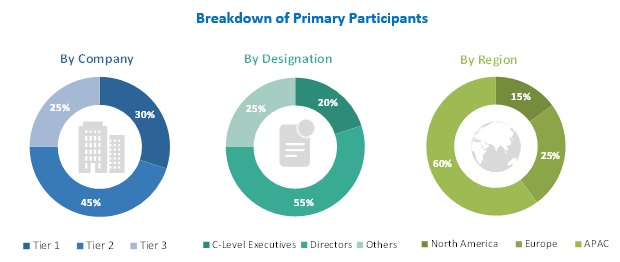
Extensive primary research has been conducted after acquiring knowledge about the display driver market through secondary research. Primary interviews have been conducted with market experts from both the demand and supply sides across three major regions North America, Europe, and Asia Pacific (APAC). Approximately 60% and 40% of the primary interviews have been conducted with both the demand and supply sides, respectively. These primary data have been collected through questionnaires, emails, and telephonic interviews.
To know about the assumptions considered for the study, download the pdf brochure
Market Size Estimation
In the complete market engineering process, both top-down and bottom-up approaches have been used, along with several data triangulation methods to perform market size estimation and forecasting for the overall market segments and sub segments listed in this report. Extensive qualitative and quantitative analyses have been performed on the complete market engineering process to list the key information/insights throughout the report.
The key players in the display driver market have been identified through secondary research, and their market shares and product revenue have been determined through primary and secondary research. This entire procedure includes the study of annual and financial reports of the top players, as well as extensive interviews with industry experts (such as CEOs, VPs, directors, and marketing executives) for key insights (both quantitative and qualitative) on the display driver market. All percentage shares, splits, and breakdowns have been determined using secondary sources and verified through primary sources. All possible parameters that affect the market covered in this research study have been accounted for, viewed in extensive detail, verified through primary research, and analyzed to derive the final quantitative and qualitative data. These data have been consolidated and supplemented with detailed inputs and analysis from MarketsandMarkets and presented in this report.
Data Triangulation
After arriving at the overall market size from the estimation process explained earlier, the overall display driver market has been split into several segments and subsegments. To complete the overall market engineering process and arrive at the exact statistics for all segments and subsegments, the data triangulation and market breakdown procedures have been employed, wherever applicable. The data have been triangulated by studying various factors and trends from both the demand and supply sides.
Study Objectives
- To define, describe, and forecast the global display driver market, in terms of value, on the basis of driver and package type, display technology, display size and devices, and geography
- To estimate and forecast the display driver market, in terms of volume, on the basis of devices
- To provide detailed information regarding the major factors (drivers, restraints, opportunities, and challenges) influencing the growth of the display driver market
- To strategically analyze the micromarkets with respect to individual growth trends, prospects, and contribution to the overall display driver market
- To analyze the opportunities in the display driver market for stakeholders and provide details of the competitive landscape for market leaders
- To analyze key trends related to driver and package type, devices, and other factors that are likely to shape and influence the market
- To strategically profile key players in the display driver market and comprehensively analyze their core competencies
- To analyze competitive developments such as mergers, acquisitions, partnerships, agreements, collaborations, and product launches, along with research and development (R&D) in the display driver market.
Available Customization
With the given market data, MarketsandMarkets offers customizations according to companies’ specific needs. The following customization options are available for the report.
- Detailed analysis and profiling of additional market players (up to five)
- Company-product-technology-specifications mapping analysis
- Top 25 company micro-quadrant analysis
- Detailed analysis of impact from Micro-LED display technology on global display driver market


Growth opportunities and latent adjacency in Display Driver Market